What I did: I fited the transfer function of Roberts linkages, and estimated the resonant frequency and Q factor of it.
I analyzed the transfer function of Roberts linkages, and try to estimate the resonant frequnecy and Q factor of it.
When I estimated the resonant frequency and Q factor, I do it separately. The reason are as follows.
First, When I measured the transfer function, the gain around the resonant frequency is crashed by out of the linar range of the photo seosor. So I need to omited these bandwidth. Meanwhile I need the bandwidth of resonant frequency when I try to analyze Q factor.
From the above situation, I estimated the resonant frequency and Q factor separately.
The result were as follows. The pictures were also attached.
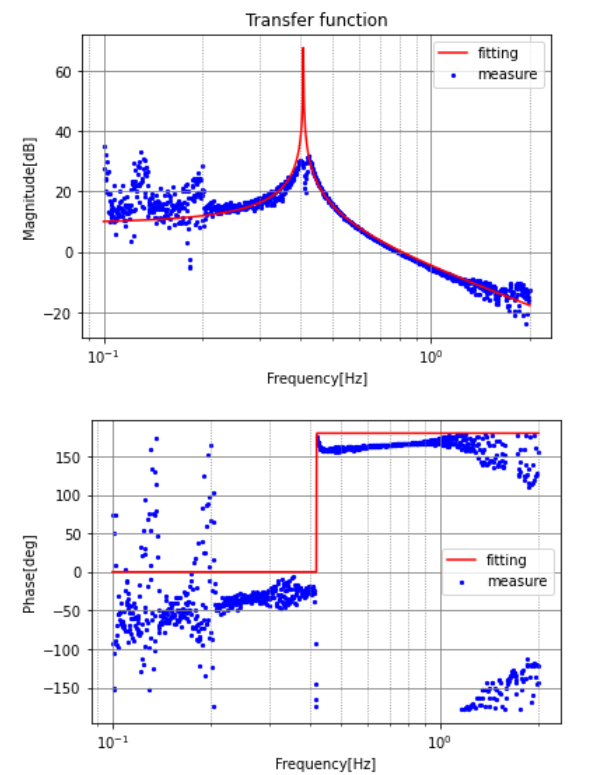
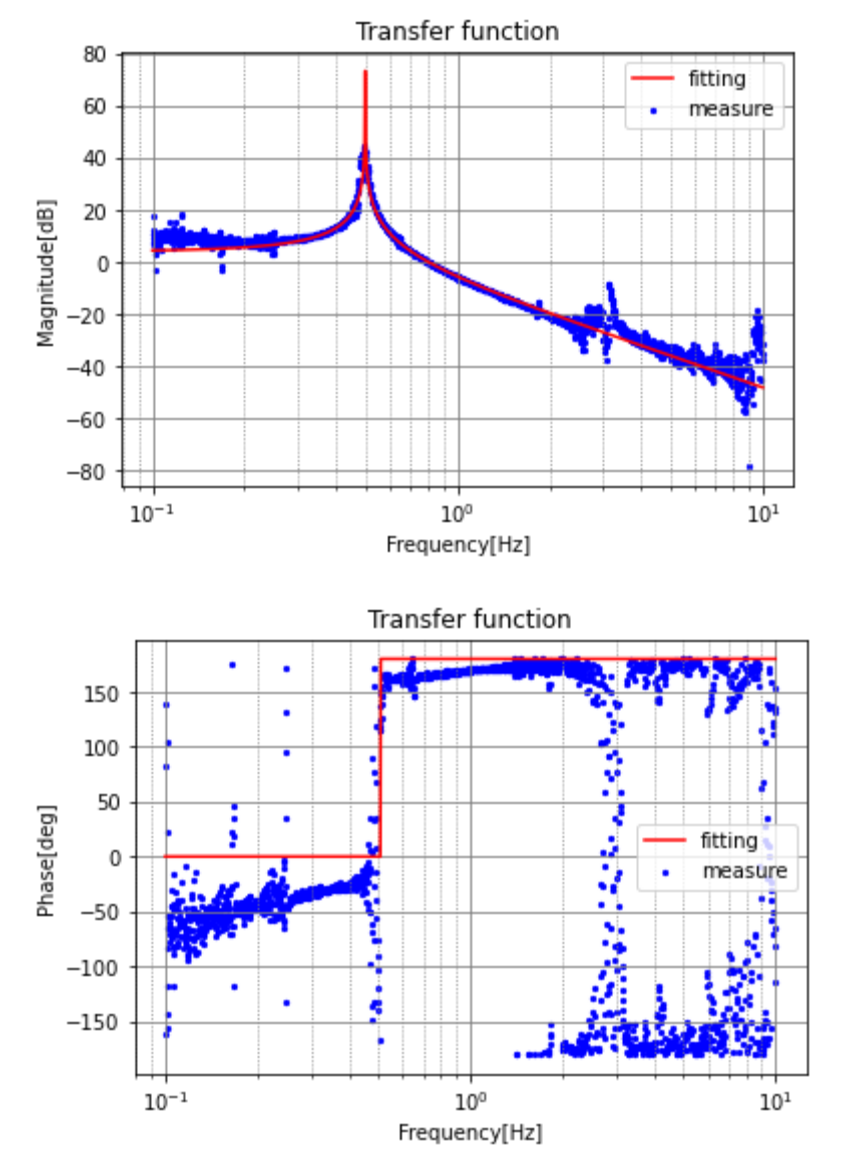
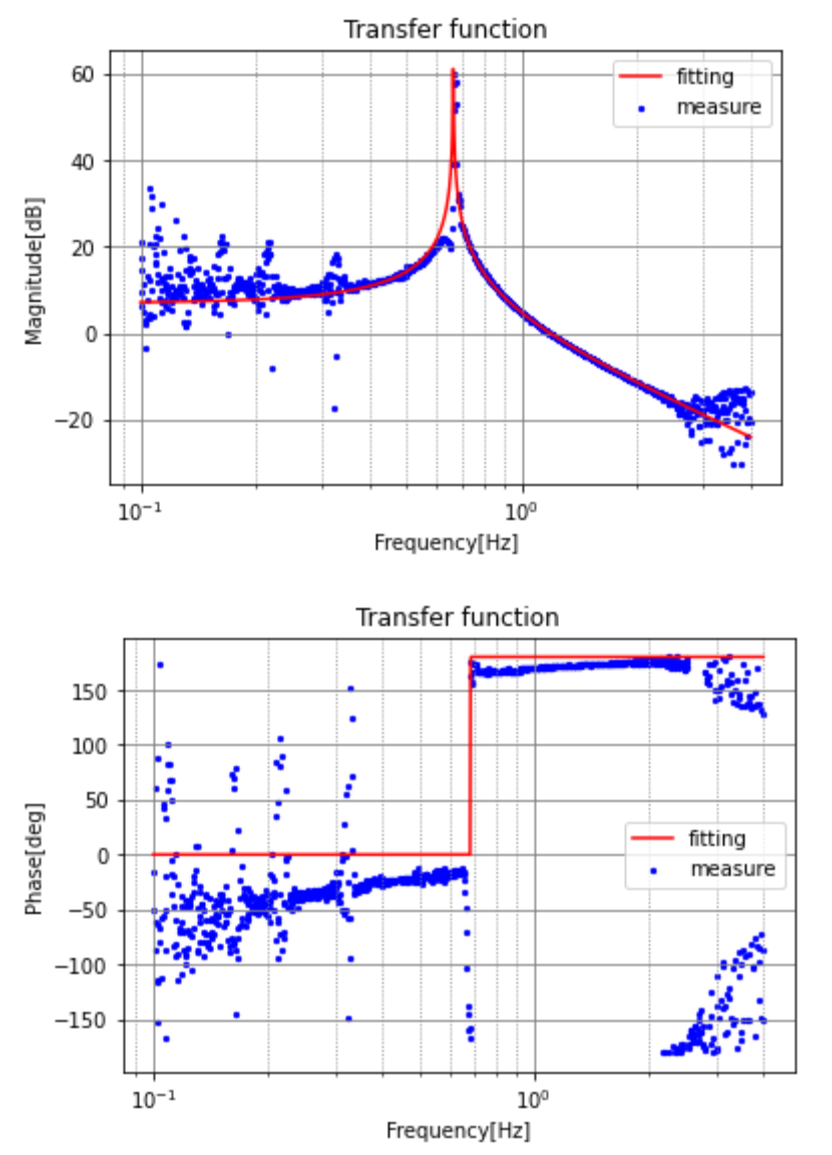
| Fig1 | Fig2 | Fig3 | |
|
position of center of mass[mm] |
-7 | -20 | -41 |
| resonant frequency[Hz] | 0.41 | 0.50 | 0.67 |
| Q factor | 2.0e+06 | 2.8e+08 | 5.4e+06 |
Position of center of mass means lenght from suspension point to center of mass vertically. Negative means that center of mass is below suspension point.
Estimated Q factor are so big and strange, and I thought It was caused by not enough time resolution.
What I will do: I measrue Q factor by ring down curve fitting.