MarcEisenmann - 19:22, Wednesday 26 July 2017 (538)
Tranfer Functions
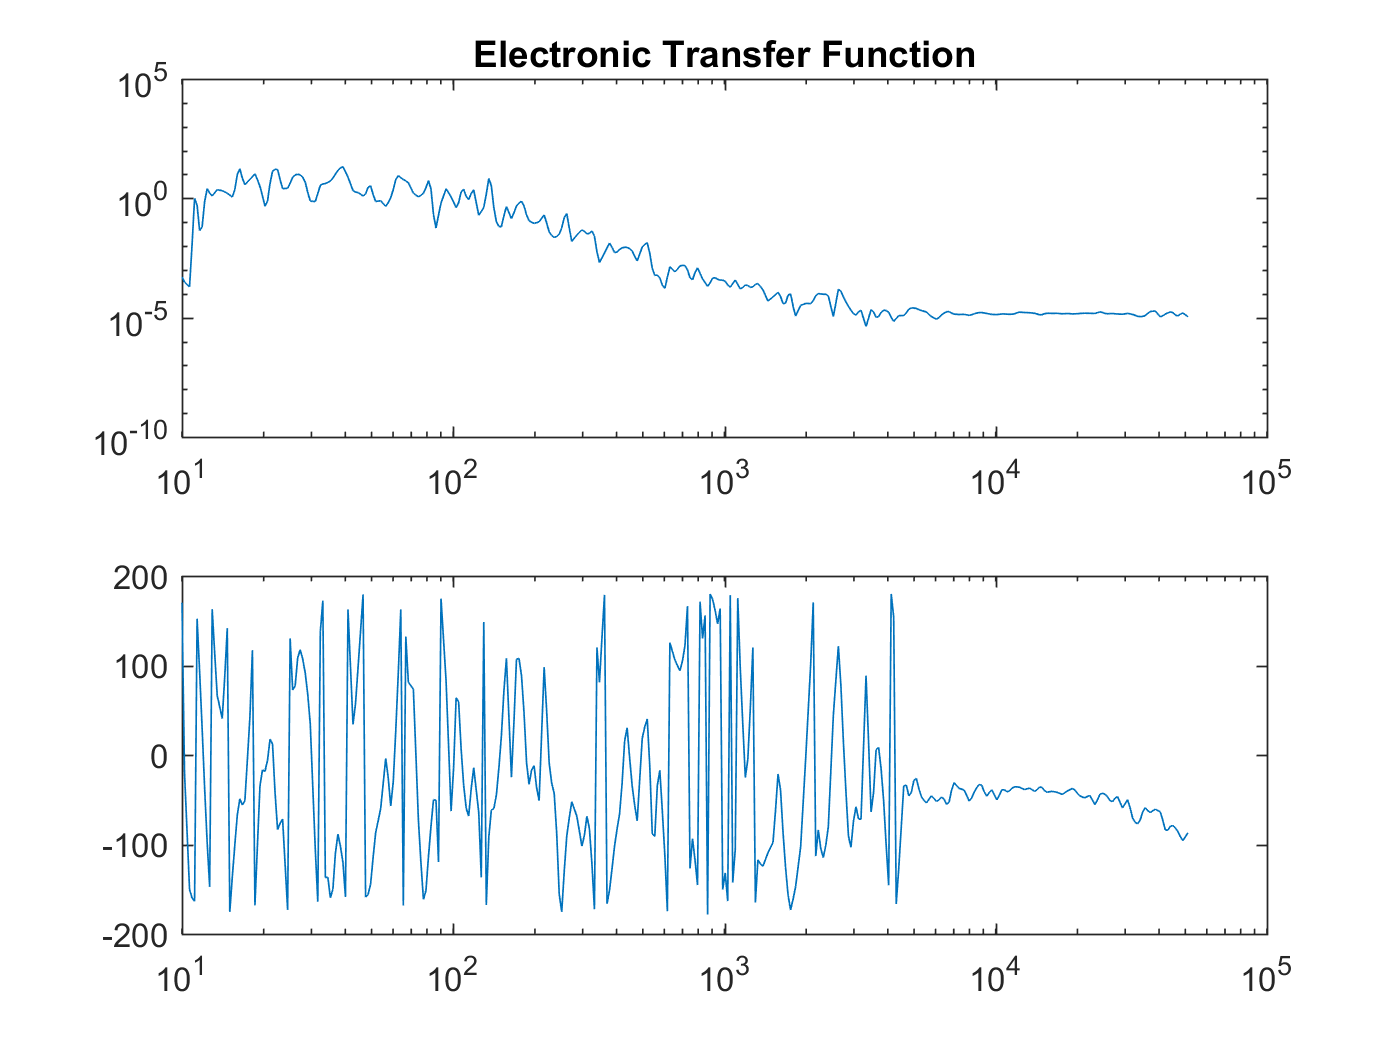
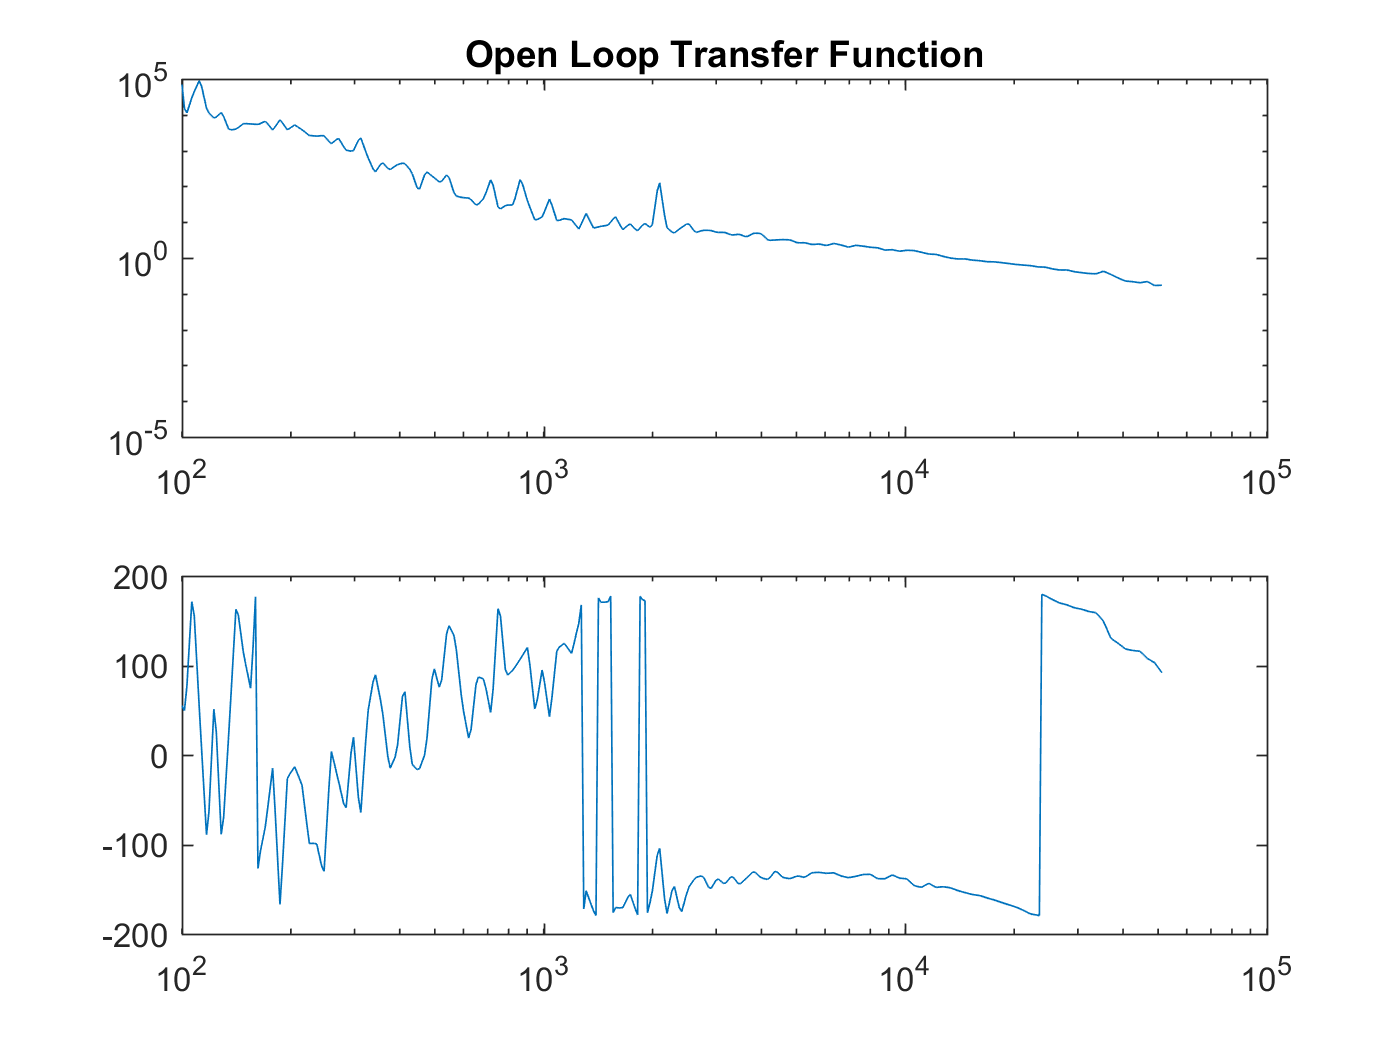
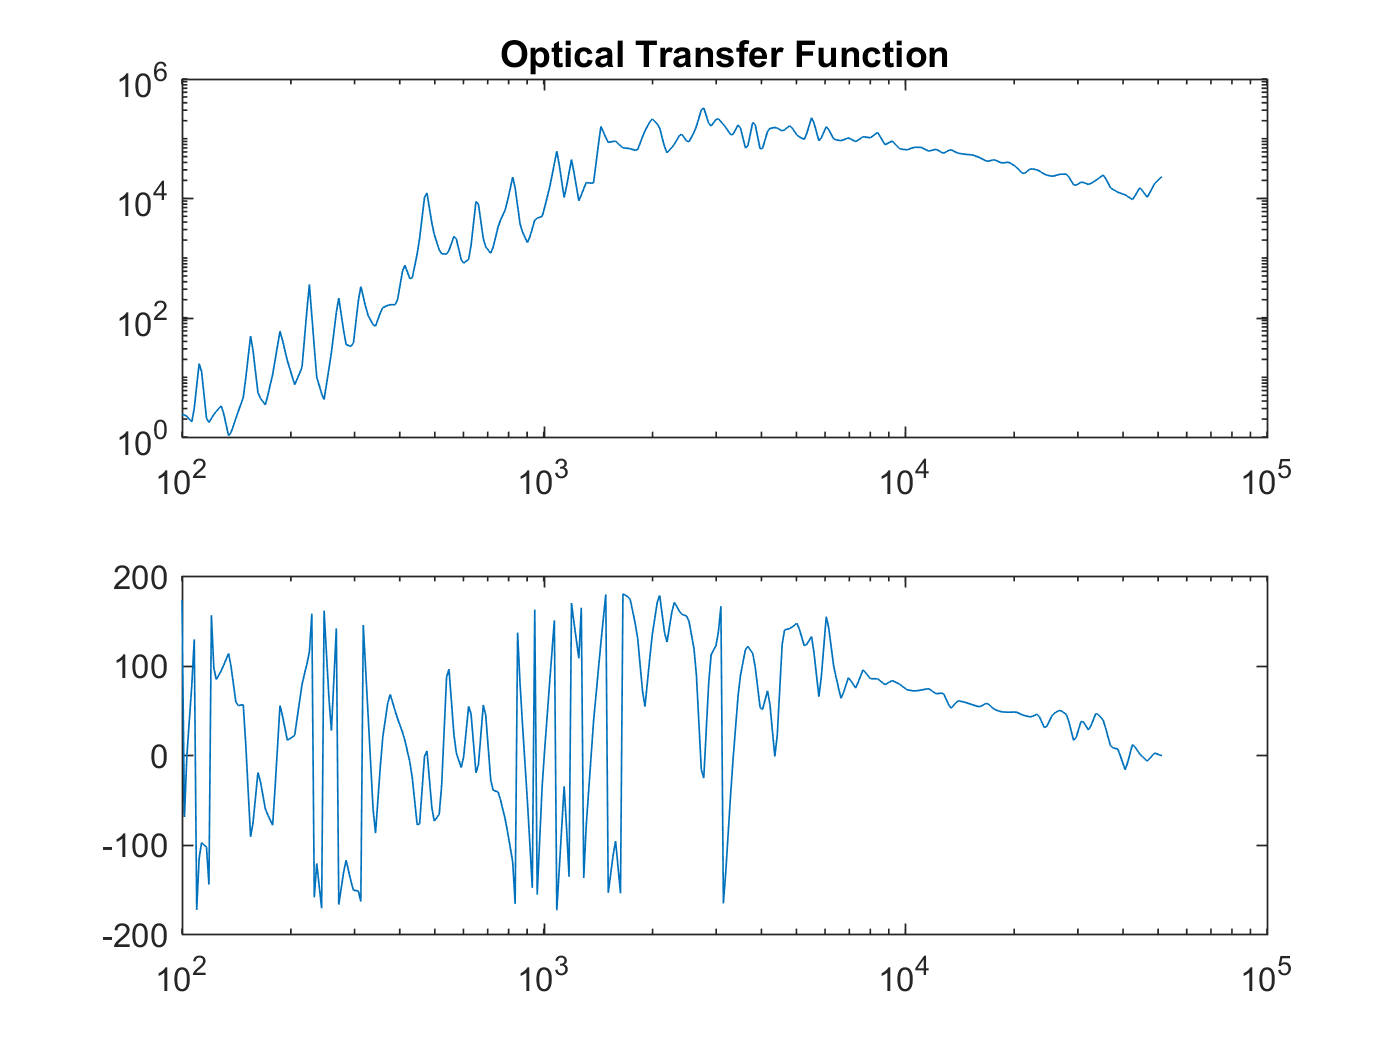
Here are the Transfer Functions we could get last Monday.
The Spectrum Analyzer provided data in ".DAT" file.
By using a program provided by Tatsumi-san, we were able to convert these data in ".DOT" file and then use Matlab to plot them.
This ".DOT" file is divided in 3 columns : frequency, magnitude and phase of the transfer function.
Attached to this entry are the open-loop, the electronic-loop and the optical loop.
They seem to be coherent with what the spectrum analyzer displayed during the measurement.
Images attached to this report