ManuelMarchio - 23:51, Tuesday 17 October 2017 (570)
Alignment of 633nm probe - Alignment of 1310nm probe
reference sample measurement:
------------------------------------------
Pump power = 0.029W with laser current I=0.77A
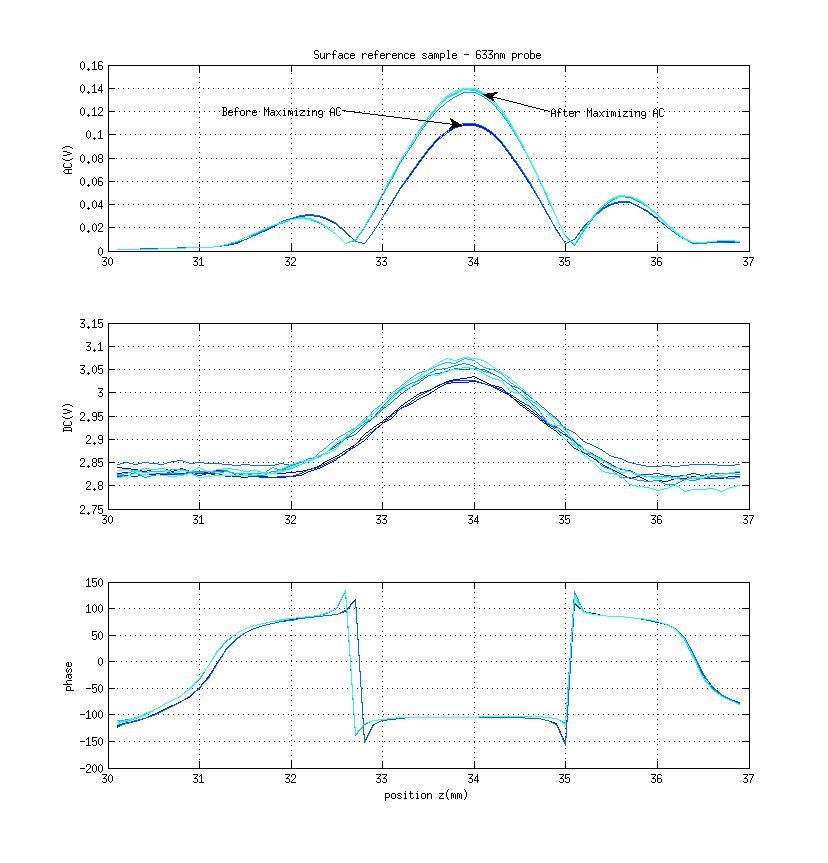
633nm probe
14:00 many scans
then adjust the pump alignment maximizing the signal
AC goes from 0.11V to 0.13 V
16:00 many scans
the imaging unit relative position is 13.4
DIDN'T CHECK THE MAXIMUM(for IU POSITION)
-------------------------------------------
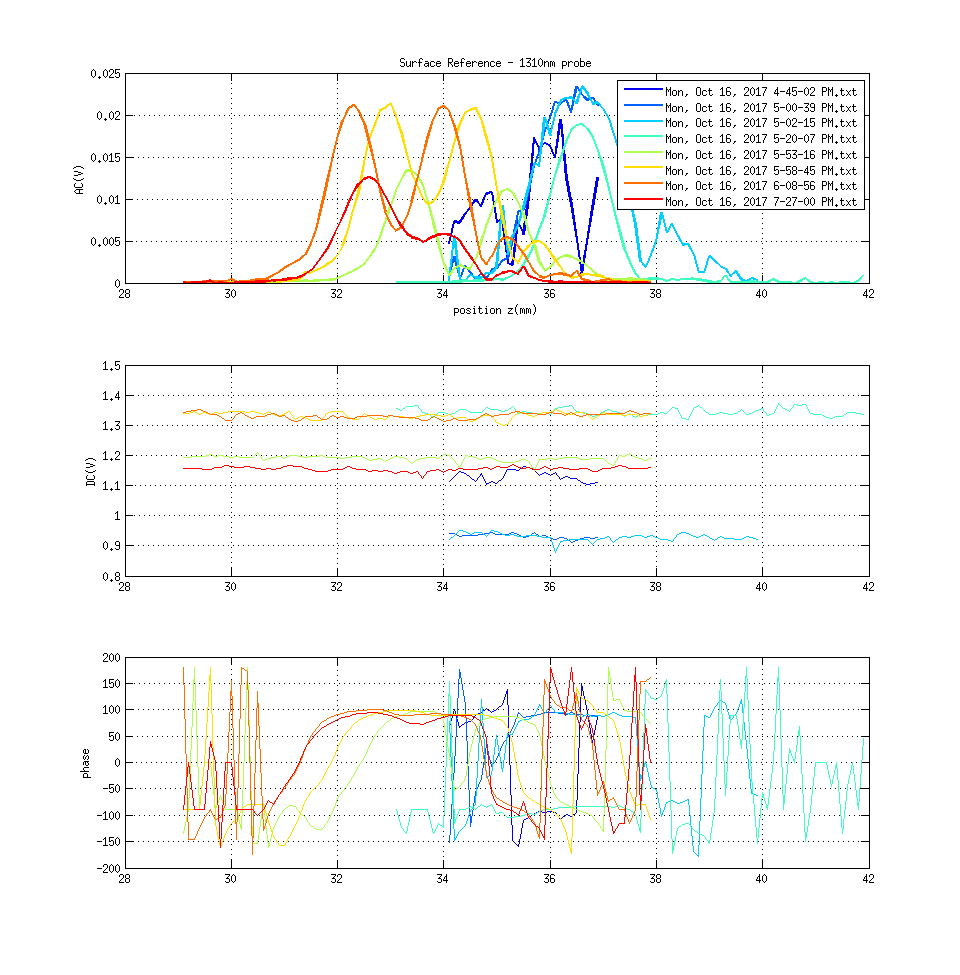
1310nm probe laser current=200mA power 41.8mW without filter
after putting filter OD2 -->
16:45 start scans to find the max
Refer to the plot legend with file names:
'Mon, Oct 16, 2017 4-45-02 PM.txt'
'Mon, Oct 16, 2017 5-00-39 PM.txt'
'Mon, Oct 16, 2017 5-02-15 PM.txt'
low signal to noise ratio
cannot go over AC=22mV , so increased the probe laser current from 200mA to 250mA
17:20 scan: 'Mon, Oct 16, 2017 5-20-07 PM.txt'
better signal to noise ratio but shape doesn't have side peaks... phase is strange
17:45 using the pinhole, reset the position of the pump
scan
17:52 scan: 'Mon, Oct 16, 2017 5-53-16 PM.txt'
the peaks have a different positions from before because the pump beam position was changed (at 17:45)
cannot see the central large peak because of heavy misalignment
adjust maximum of DC and scan again
17:58 scan: 'Mon, Oct 16, 2017 5-58-45 PM.txt';
still strange shape but different from before
set z=34mm and maximize the AC moving the pump
scan: 'Mon, Oct 16, 2017 6-08-56 PM.txt'
change the IU alignment and scan: 'Mon, Oct 16, 2017 7-27-00 PM.txt'
my opinion is that we have to adjust the alignment of the IU.
Maybe a different size of the beam on the PD or a different PD position
Images attached to this report