NAOJ GW Elog Logbook 3.2

Eleonora (remotely) and Yuhang
As suggested by Matteo, we should check oplev singal of INPUT/END mirrors. Besides, as suggested by Raffaele, the control bandwidth of AA can be evaluated by checking how long time loop takes to go back to be aligned from misalignment. Therefore, I did the following check:
1. I lock FC and close AA loop. The locking strategy for AA is: 1.lock with low pass filter 2.switch off low pass filter 3.switch on integrator.
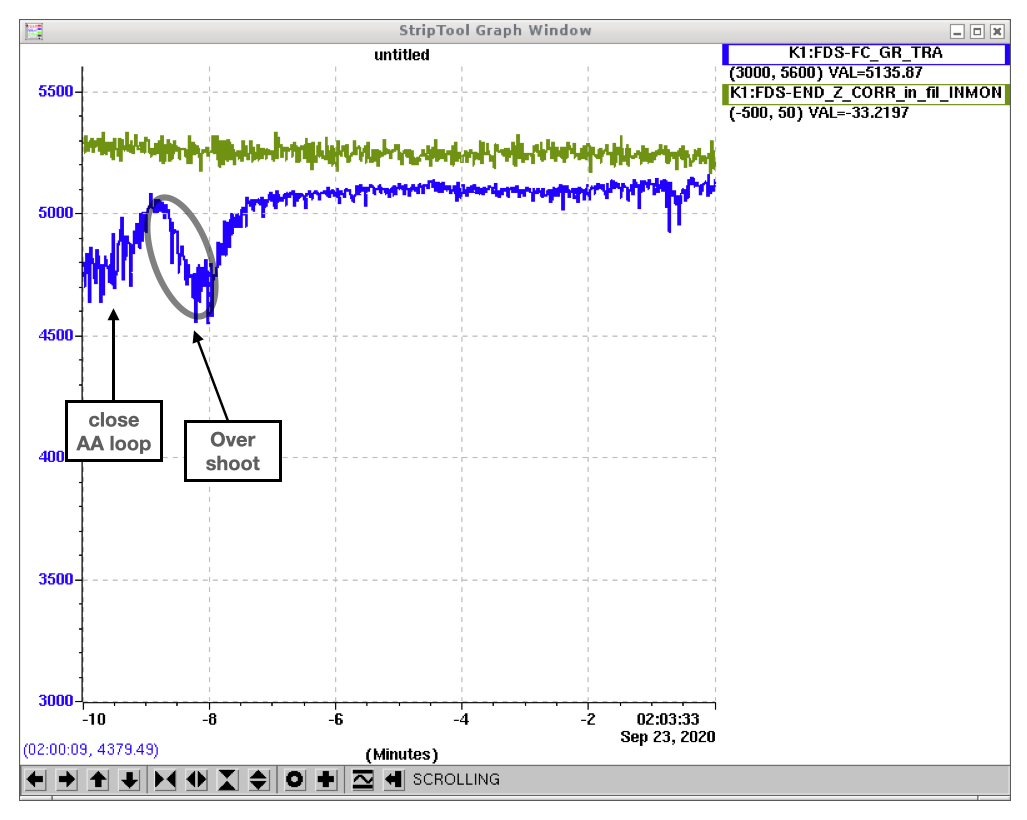
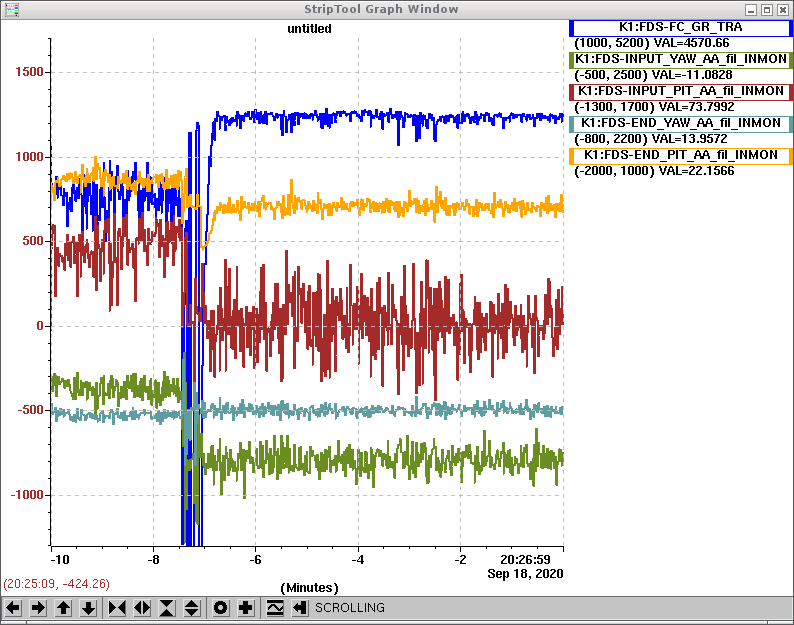
2. By adjusting BS, beam moves up on camera. Then I get oplev error signal as attached figure 1.
By looking at INPUT pitch oplev signal, we could see that AA loop takes almost 4 min to recover the pitch misalignment. Therefore, the control bandwidth should be very small for AA loop pitch. Therefore, it maybe better to increase the gain.
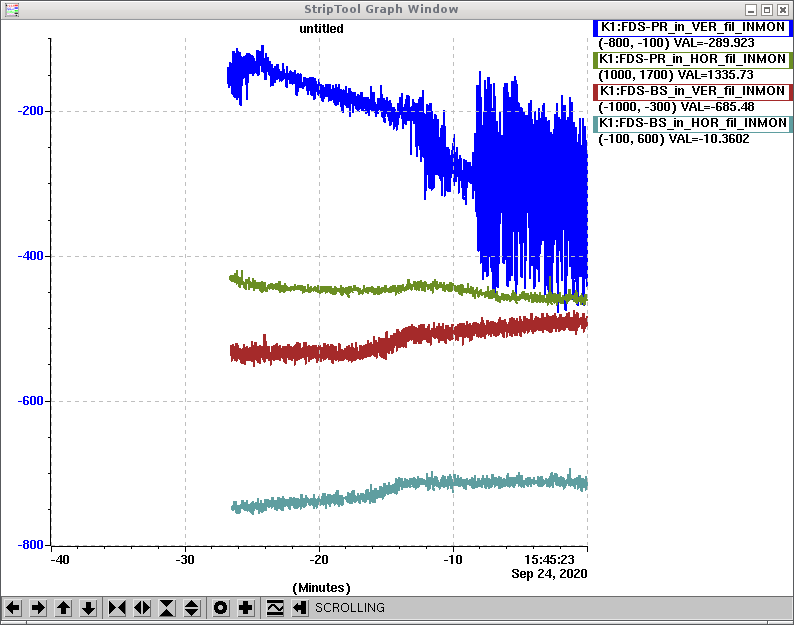
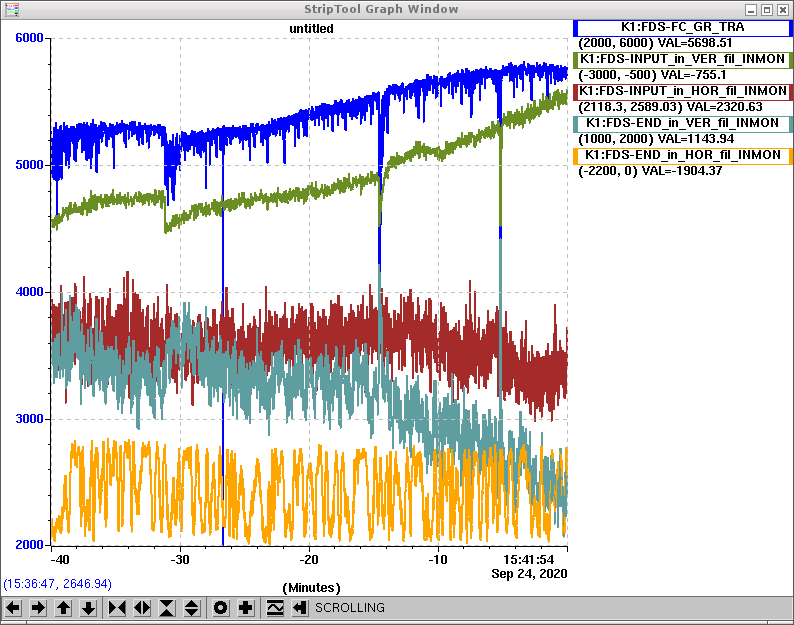
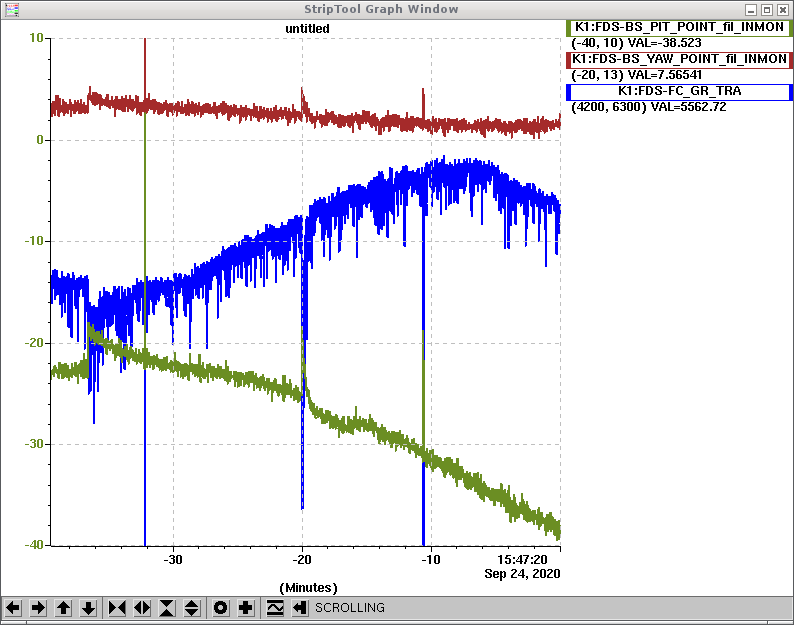
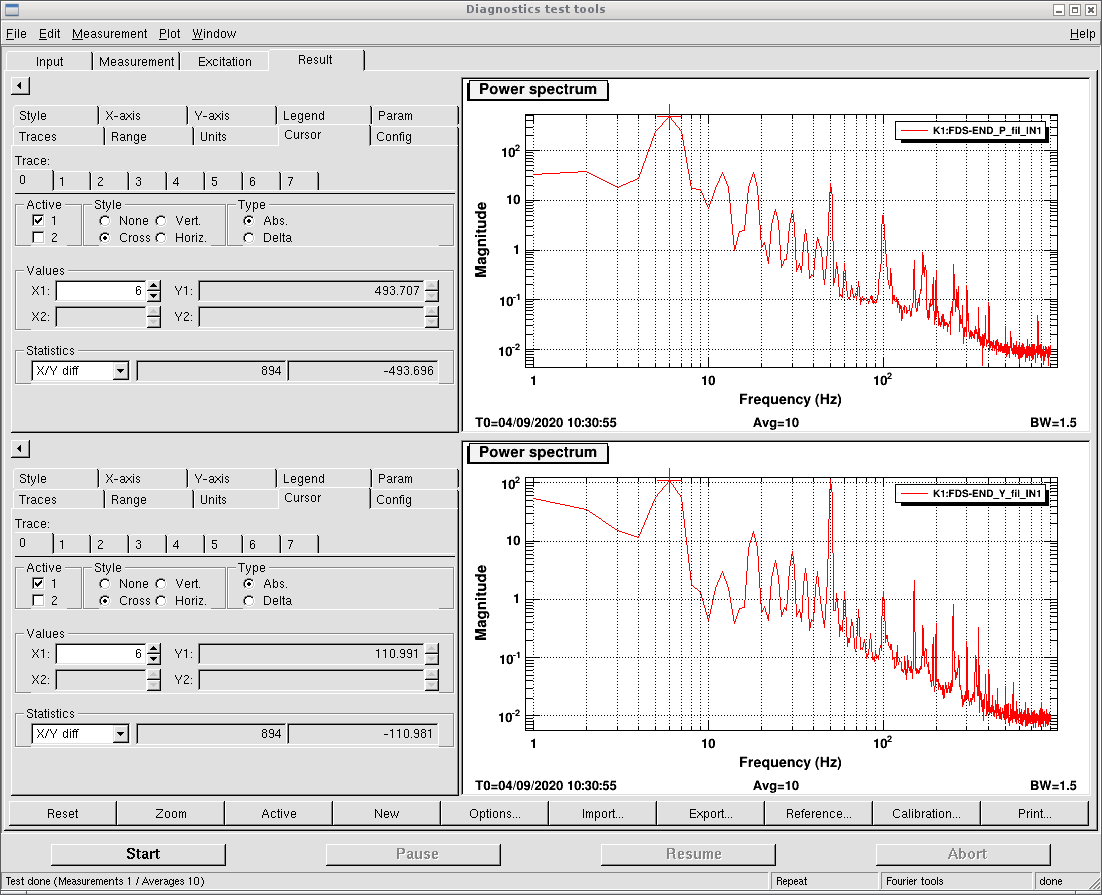
3. I monitor PR/BS/INPUT/END mirrors oplev signal and sum/diff signal of FC_tra_GR PSD for about 40 min. They are shown in attached figure 2, 3 and 4.
According to elog1874, PR/BS oplev signals have similiar calibration factors. Therefore, the attached figure 2 shows each oplev signal in a similar scale, and we could see that PR pitch moved more than others during half an hour. From attached figure 3, we could see that INPUT/END pitch moved accordingly. For yaw direction, there is also correspondence between PR/BS and INPUT/END. But END yaw is always osillating with a frequency around 0.05Hz (time scale around 20 sec). From the attached figure 4, we could see the effect of beam motion in pitch direction. The diff singal from PSD kept chaning in pitch direction (which is consistent with the motion seen from camera). Although the AA loop kept the alignment between beam axis and cavity axis, the green transmission power is not kept.
4. I increase gain of AA loop by 100 times for both INPUT and END mirror.
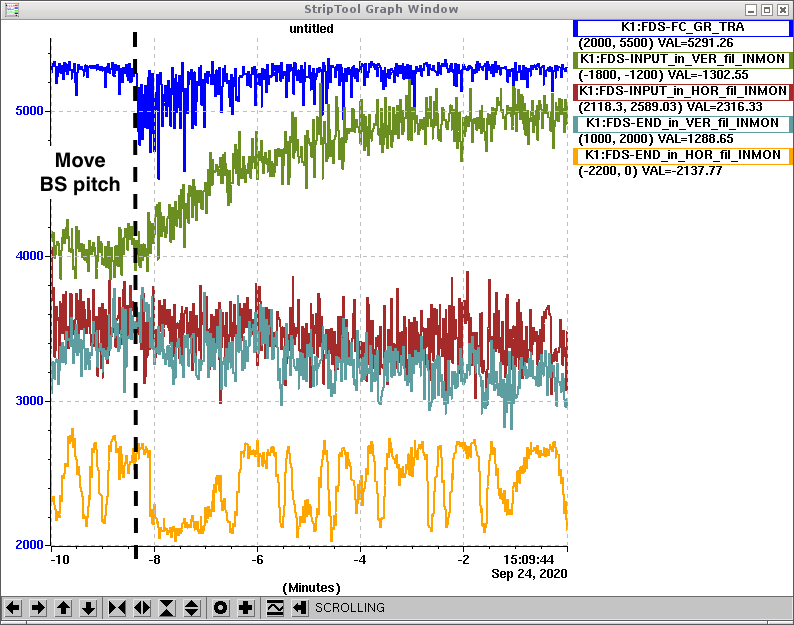
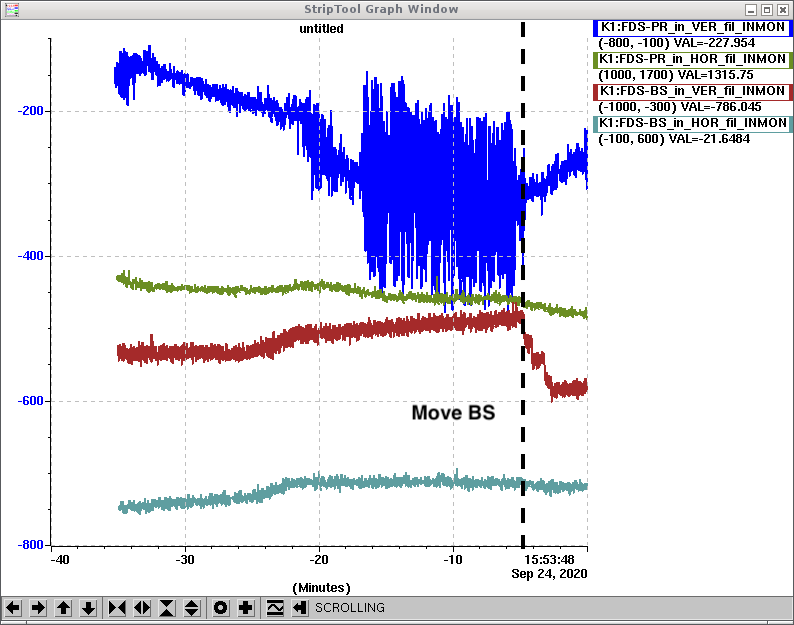
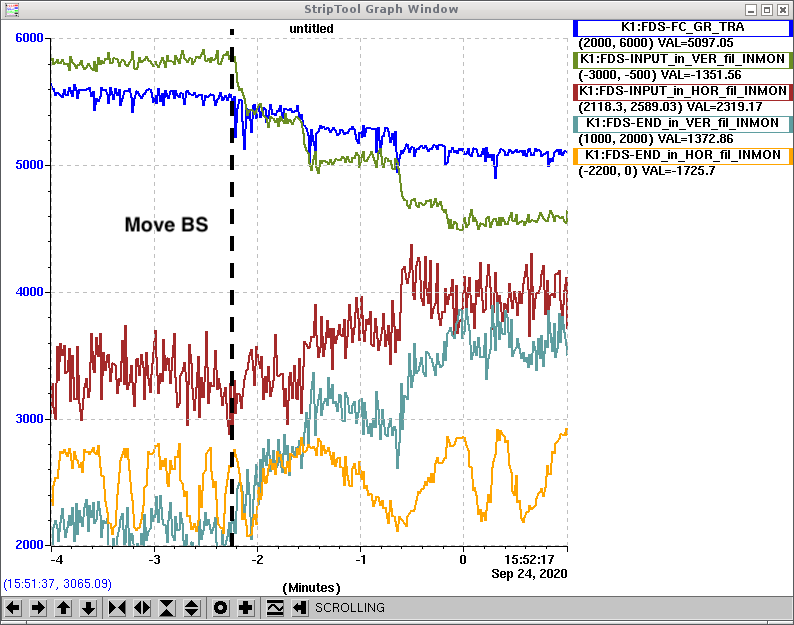
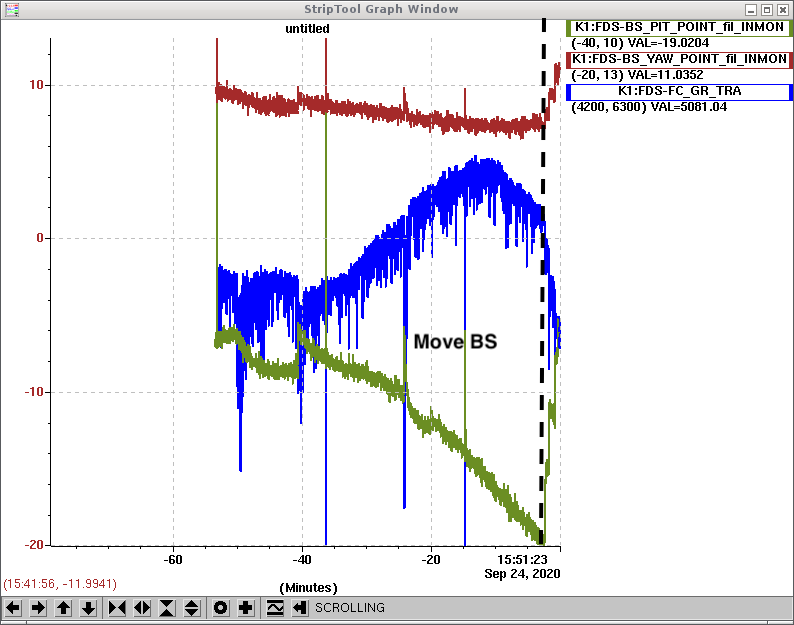
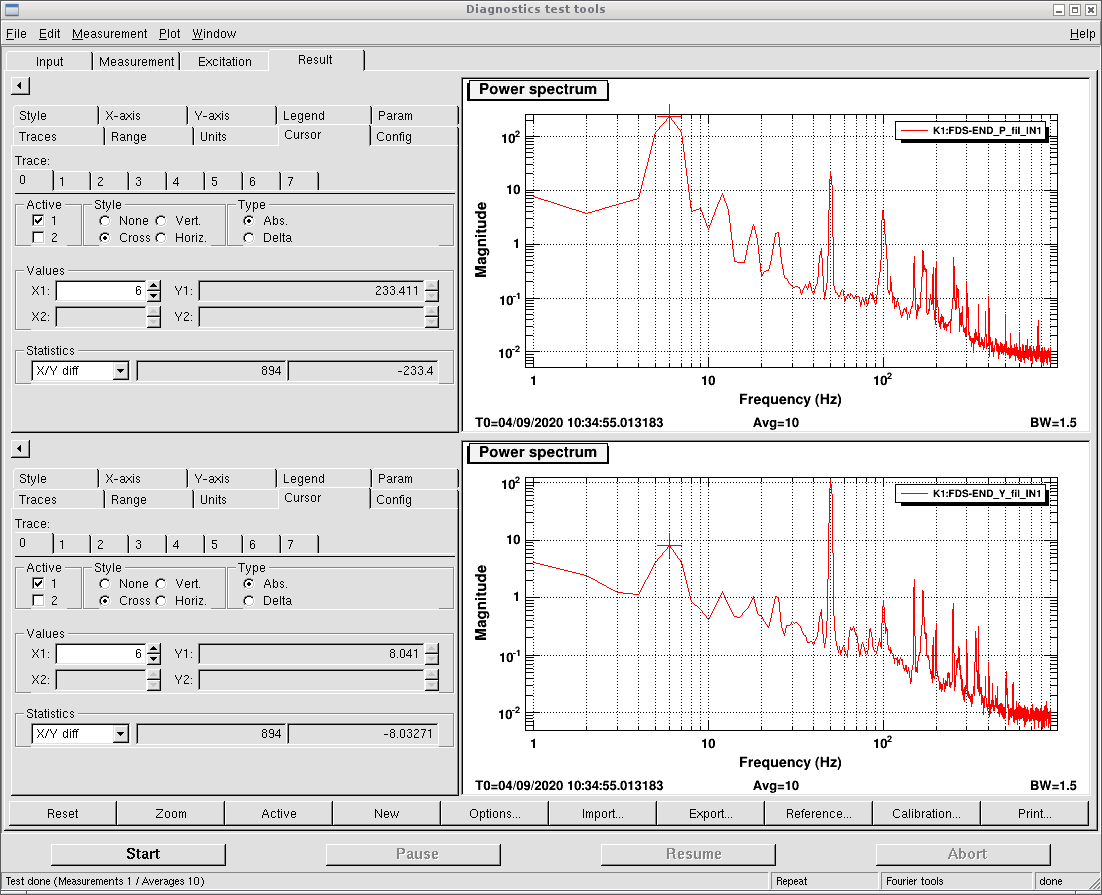
5. I move BS in pitch direction again. Then the 4 mirrors oplev signals and transmission PSD signals are shown in the attached figure 5, 6 and 7.
From attached figure 5, we could easily see the movement I did for BS pitch. From attached figure 6, we could see that INPU/END pitch follows the change of BS. Especially, after increasing the gain of AA loop in pitch, the recovery of alignment becomes quite rapid. This means the control bandwidth should be larger now. From attached figure 7, we see the beam motion on PSD. But it is a bit strange that there is also signal in yaw direction.
The large motion of mirror after closing AA loop is due to the large gain. This large gain was causing an over shoot. By adding a ramp time of 10min, the lock becomes better. As shown in the figure 2, there is still over shoot, but mirror comes back to the good position within two minutes due to the small increase of servo output.
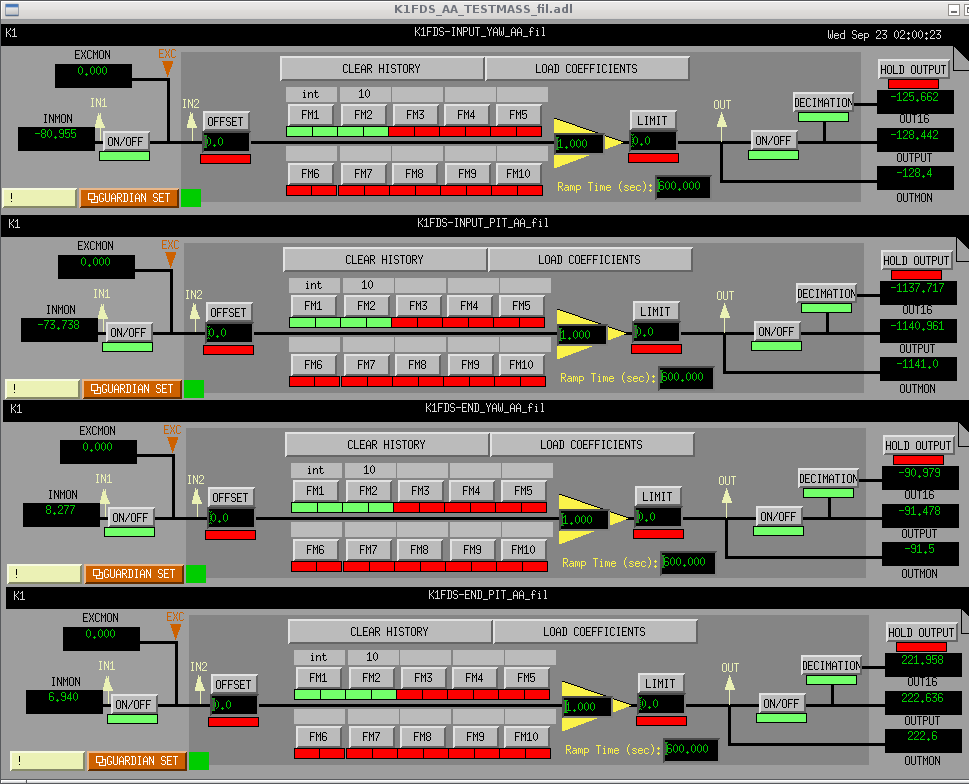
You can see the ramp time is 600 seconds in the figure 1.
Aritomi and Yuhang
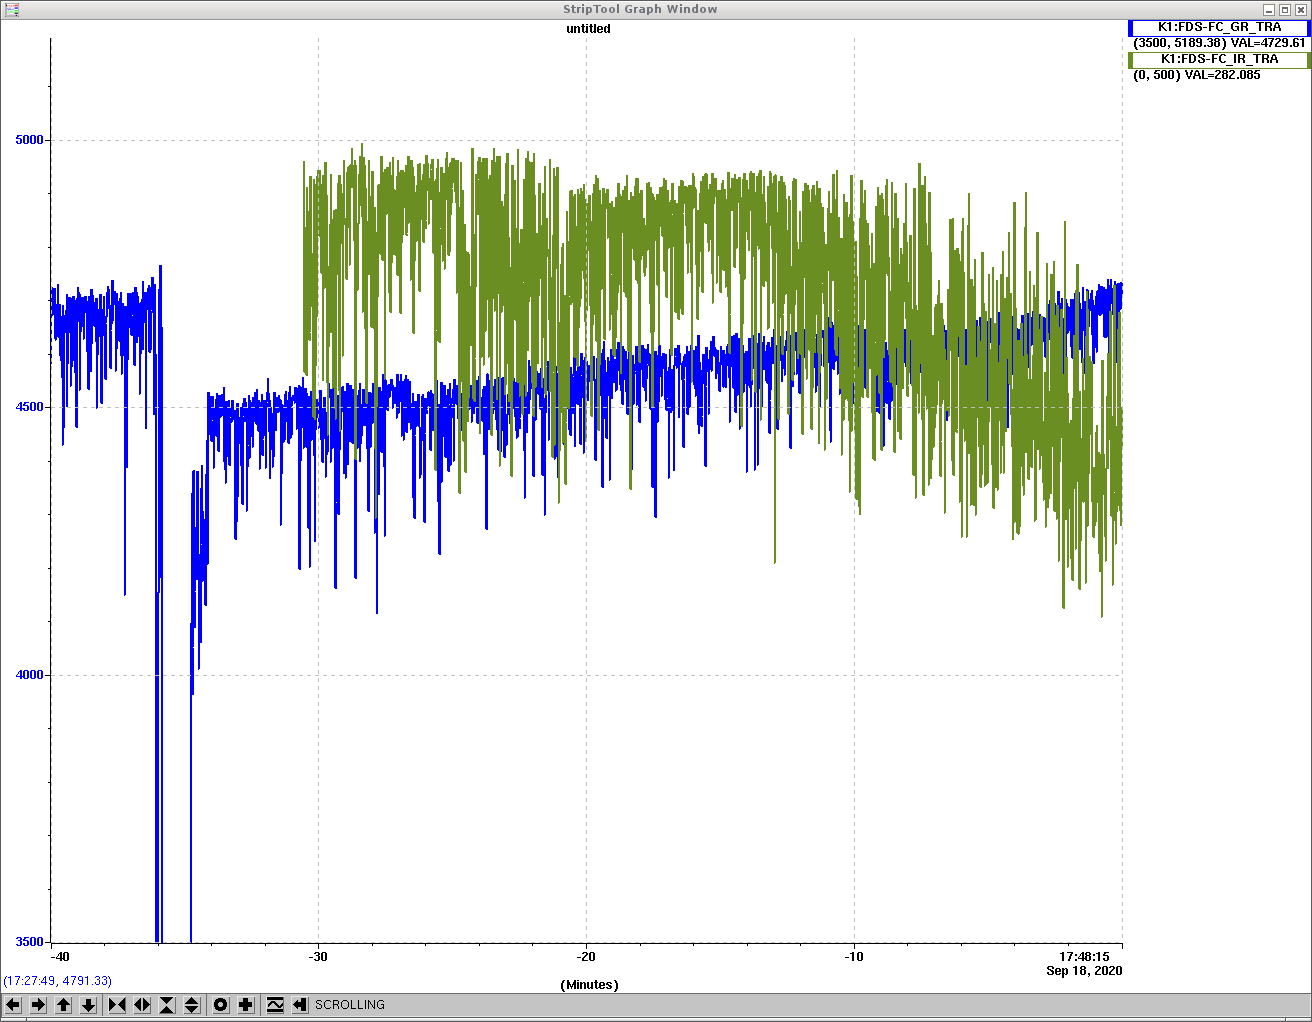
Last week, we closed Auto-alignment (AA) loop and monitor FC_tra for half an hour. As shown in the attached figure 1, both FC_tra_GR and FC_tra_IR drifts.
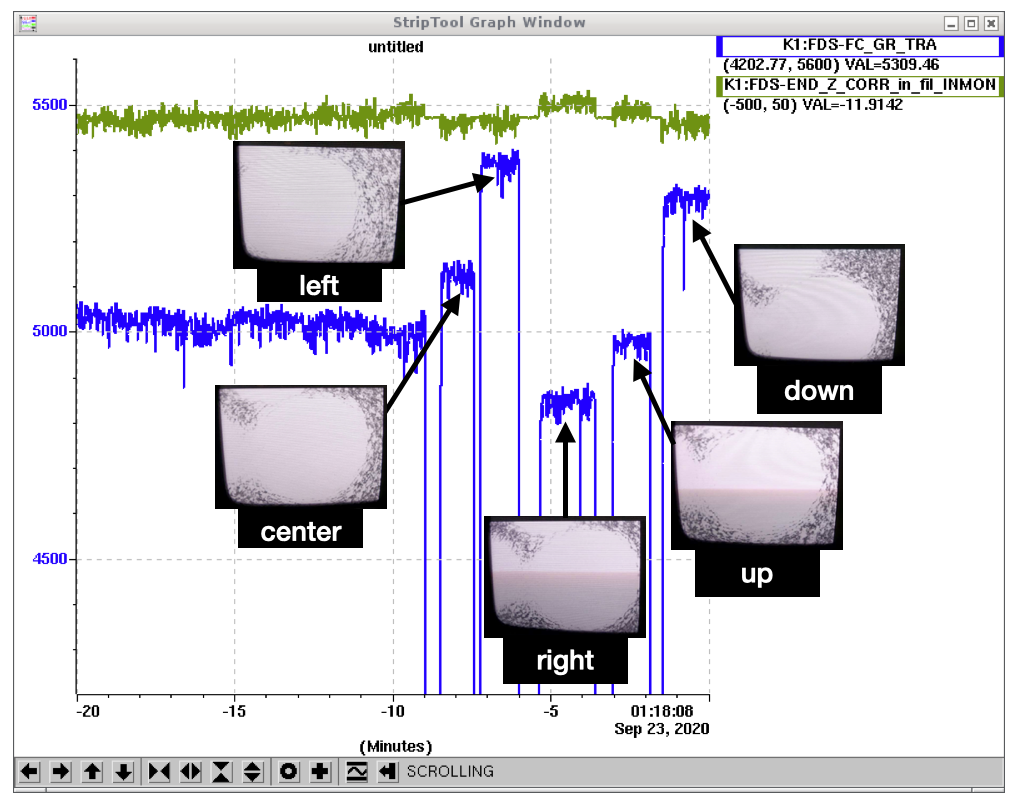
With the AA loop closed, I locked FC while transmitted GR hits on different positions of Camera_tra (different alignment). As shown in the attached figure2, FC_tra_GR changes according to different positions (alignment). Therefore, although the incident beam axis aligns with the cavity axis by the AA loop, there is different cavity behavior for GR_tra for different alignment which is causing the long time drift of FC_tra. Probably the situation will be even more different for IR, which should be checked soon. For example, it is similar to the FC optical losses for IR is different for different alignment conditions.
Can you plot the oplev signals for input and end mirror at the same time of the plot you attached in the entry?
Aritomi and Yuhang
All the loop used integrator with gain of 0.1. The pitch loop has both 10Hz low pass filter as well. These filters were chosen a bit randomly. They will be improved later.
With these filters, the loop was closed. And the alignment of filter cavity was kept as shown in the attached figure. We could see that the green power goes to maximum after the loop is closed and stays stable. Besides, all the error singal goes to zero and oscillates around.
However, there is still problem. Everytime when the loop is closed, there is a very large motion of mirror. We need to solve this problem. Apart from this, the loop works well.
Can you plot the oplev signals for input and end mirror at the same time of the plot you attached in the entry?
The large motion of mirror after closing AA loop is due to the large gain. This large gain was causing an over shoot. By adding a ramp time of 10min, the lock becomes better. As shown in the figure 2, there is still over shoot, but mirror comes back to the good position within two minutes due to the small increase of servo output.
You can see the ramp time is 600 seconds in the figure 1.
Aritomi and Yuhang
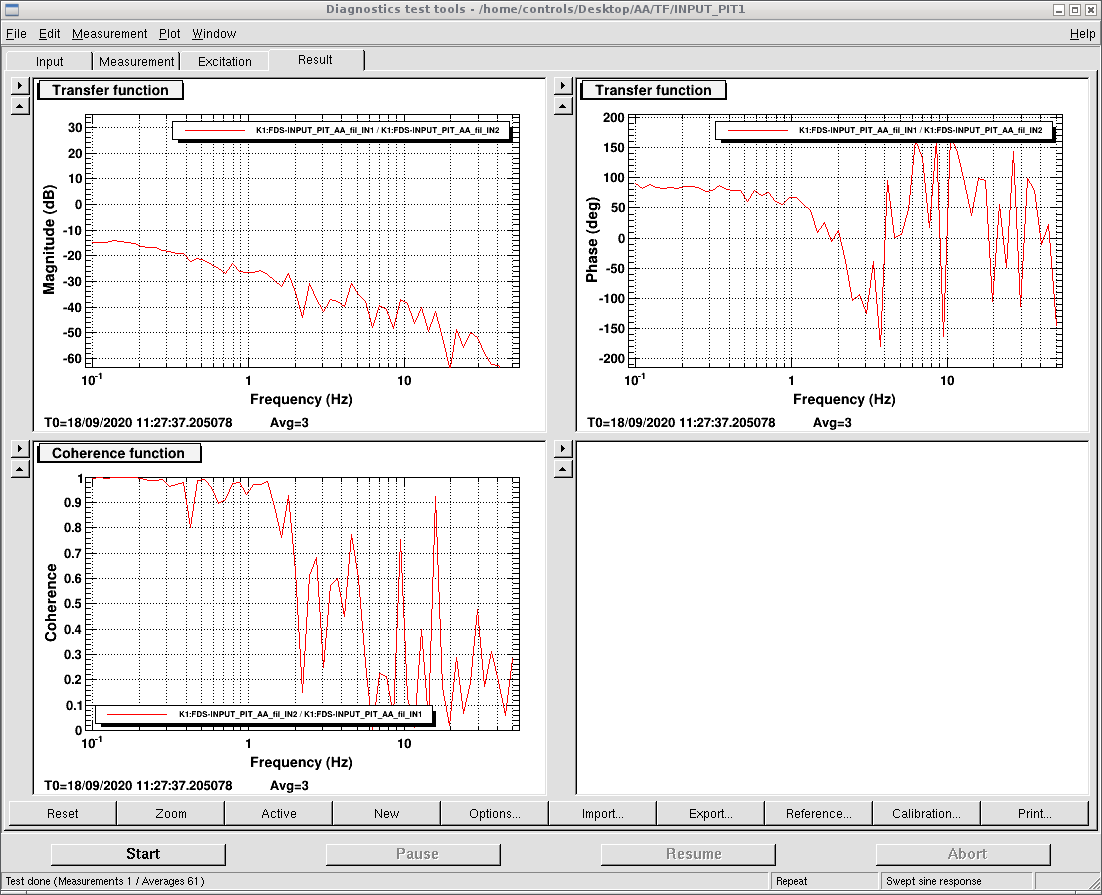
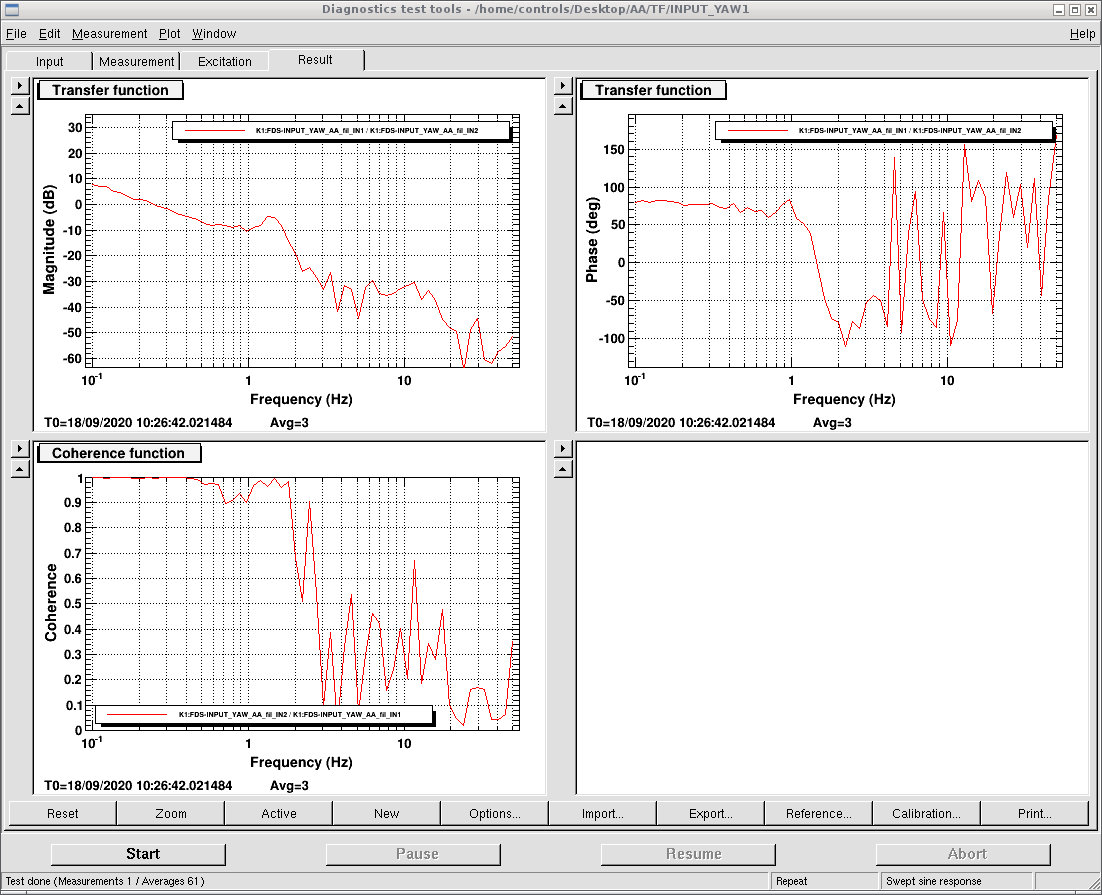
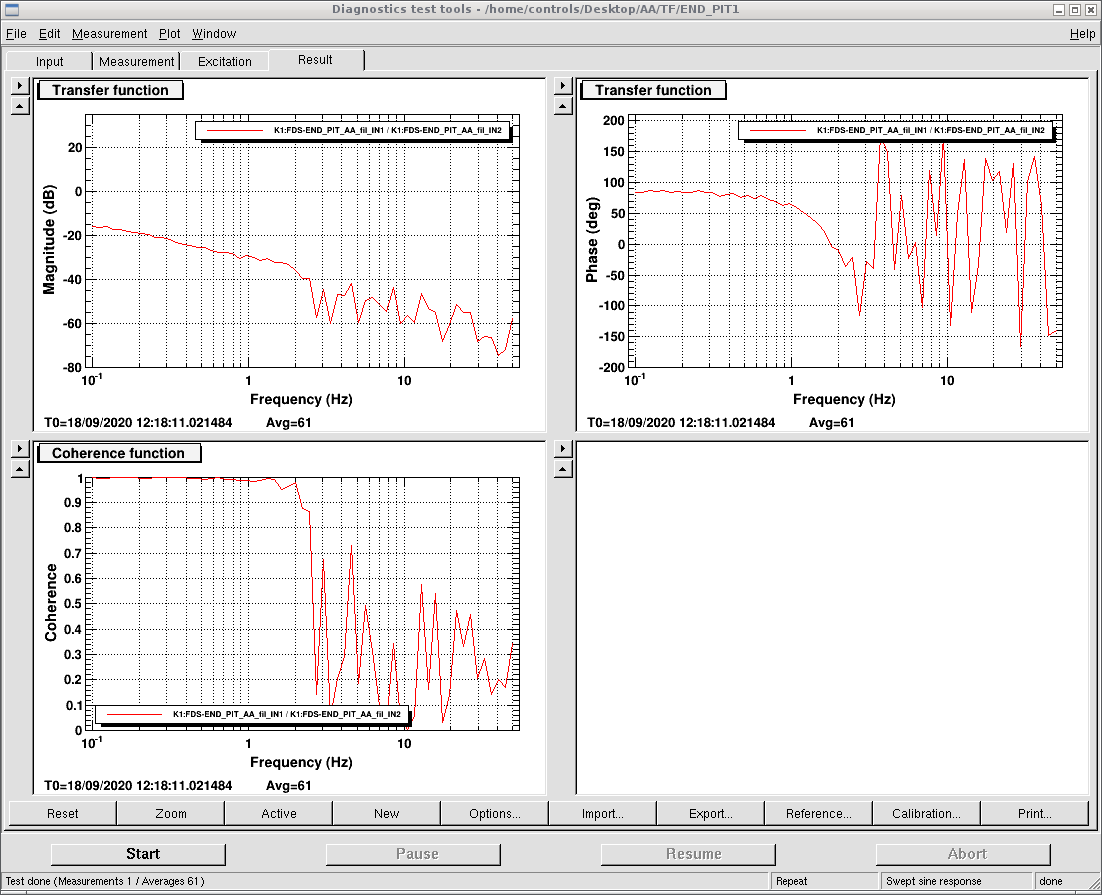
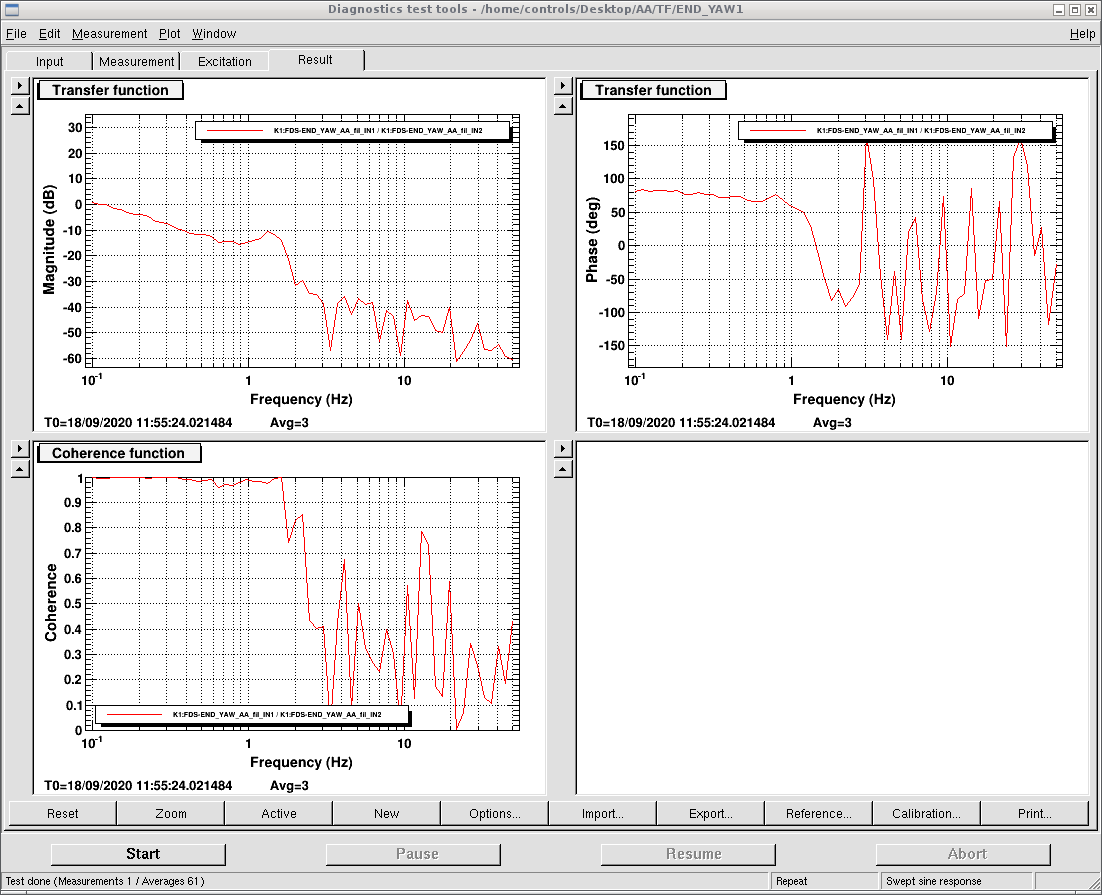
The transfer function of each control loop was measured. The measurement was done with the excitation and the channel before and after that.
The control loop for yaw has unity gain frequency around 0.2Hz.
But the control loop for pitch has unity gain frequency less than 0.1Hz.
According to the actuation calibration in elog1877, the driving of 5urad can be represented in the unit of counts.
The excitation is therefore decided to be the following table (at 2Hz).
| Input Yaw excitation | Input Pitch excitation | End Yaw excitation | End Pitch Excitation |
| 227 | 793 | 186 | 961 |
According to this excitation, the response (sensing matrix) is as the following table
| WFS1_p | WFS1_y | WFS2_p | WFS2_y | |
| Input_y_exc | 48 | 470 | 36 | 248 |
| Input_p_exc | 275 | 70 | 180 | 33 |
| End _y_exc | 66 | 180 | 73 | 161 |
| End_p_exc | 269 | 143 | 292 | 74 |
The offset of these signals is listed as the following table
| WFS1_p | WFS1_y | WFS2_p | WFS2_y | |
| offset | 31 | 20 | 29 | 13 |
Then subtracting the offset from the sensing matrix. The sensing matrix (after substracting) is used to decide the driving matrix index magnitude. The principle is that if the response is larger, the driving needs to be also larger. Without considering the coupling between pitch and yaw, the driving matrix is decided to be
| WFS1 | WFS2 | |
| input_p | 1.6 | -1 |
| end_p | 0.9 | 1 |
| input_y | -1.9 | 1 |
| end_y | -1.1 | 1 |
The sign of the above driving matrix is decided by the time-series measurement yesterday.
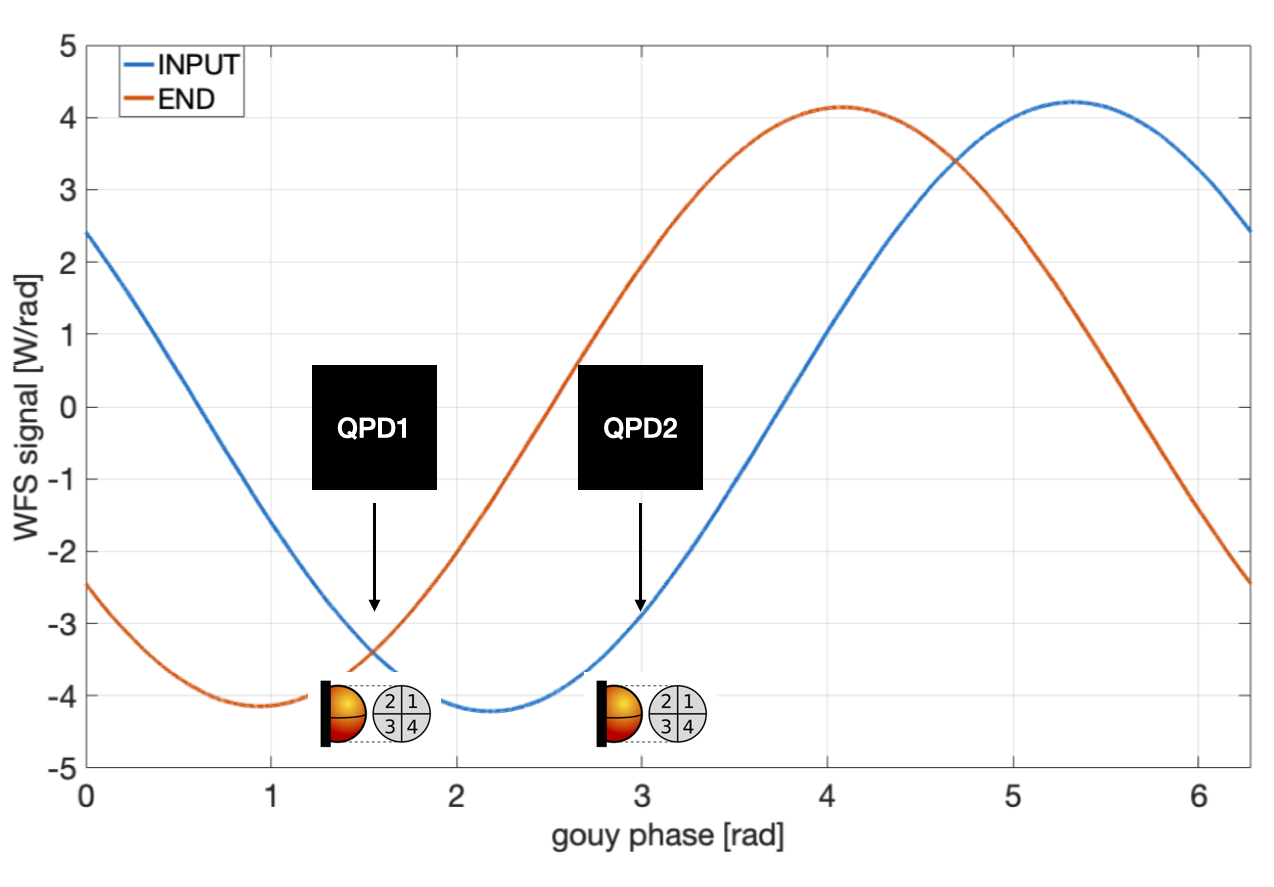
According to the WFS error signal in time, it can be inferred that situation of QPDs location is shown in the attached figure.
In this case, the error signal from input mirror is shown with opposite sign on QPD1/2. While the error signal from end mirror has the same sign.
[Aritomi, Yuhang]
We checked nonlinear gain with 56mW green and found that the nonlinear gain is below 20 while the theoretical nonlinear gain is 37.5. So we optimized the nonlinear gain. We measured OPO transmission of BAB with power meter (power meter range: 8.8 mW) while OPO and green phase is scanned.
| green power (mW) | OPO temperature (kOhm) | p pol PLL (MHz) | BAB transmission (V) | nonlinear gain |
| 0 | 7.18 | 270 | 0.0456 | 1 |
| 56 | 7.18 | 127.5 | 1.42 | 31.1 |
Then we measured FDS, but we couldn't find any squeezing with 56mW green. We decided to reduce the green power to 41.5mW (MZ offset 4.5). We optimized OPO temperature and p pol PLL for 41.5mW green. The nonlinear gain is 13.4 and consistent with theoretical value which is 12.8.
| green power (mW) | OPO temperature (kOhm) | p pol PLL (MHz) | BAB transmission (V) | nonlinear gain |
| 0 | 7.164 | 240 | 0.0456 | 1 |
| 41.5 | 7.164 | 135 | 0.612 | 13.4 |
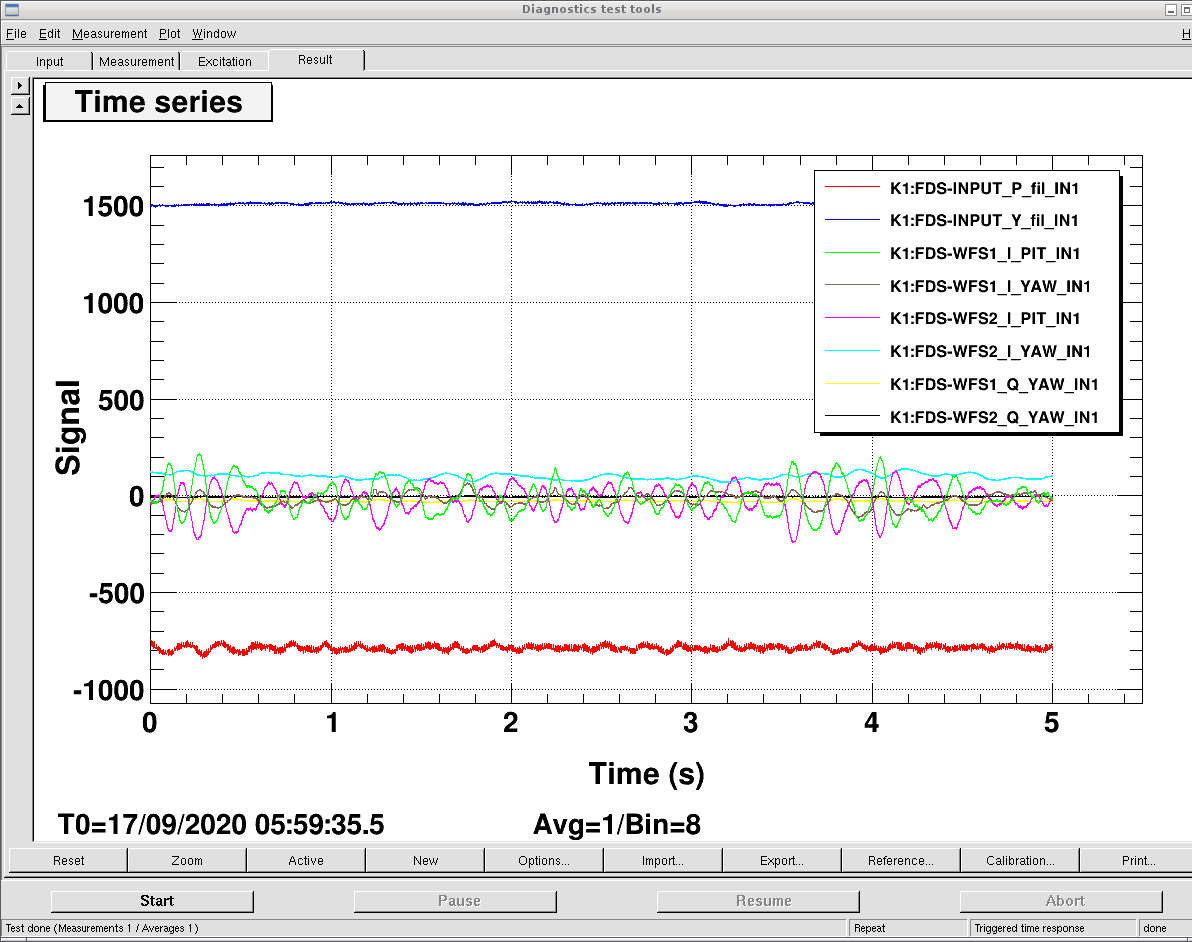
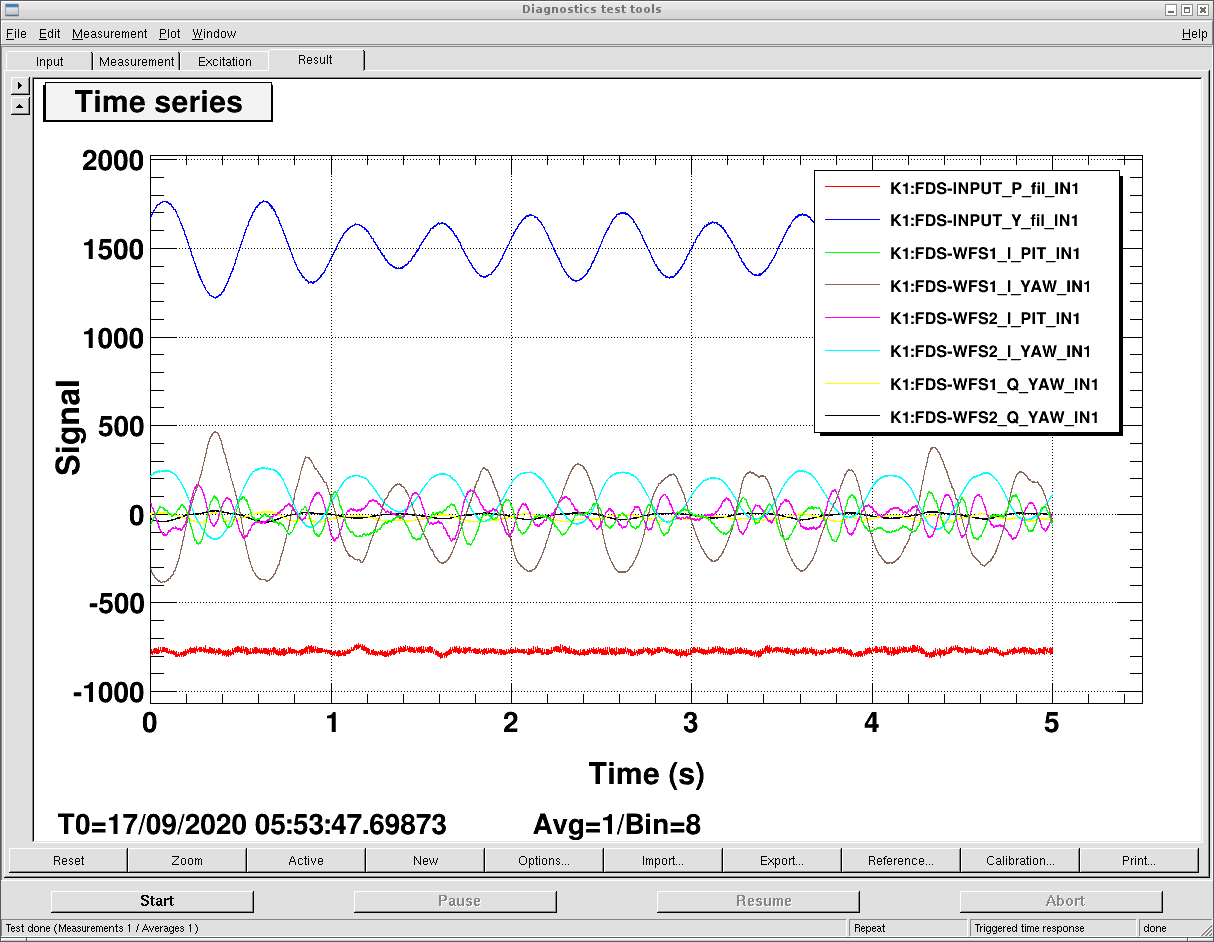
The error signal in time tells phase information(error signal in/out of phase with driving) and locking information(if error signal is around zero, the locking is good). Therefore, I checked WFS error signal in time on QPD1/2 while driving/nodriving INPUT/END mirror Pitch/Yaw separately. This time, the driving is at 2Hz.
Figure 1: no driving. Even when there is no driving, the pitch error signal oscillates around zero, which indicates mirrors have very large oscillation in pitch direction (known before in other ways).
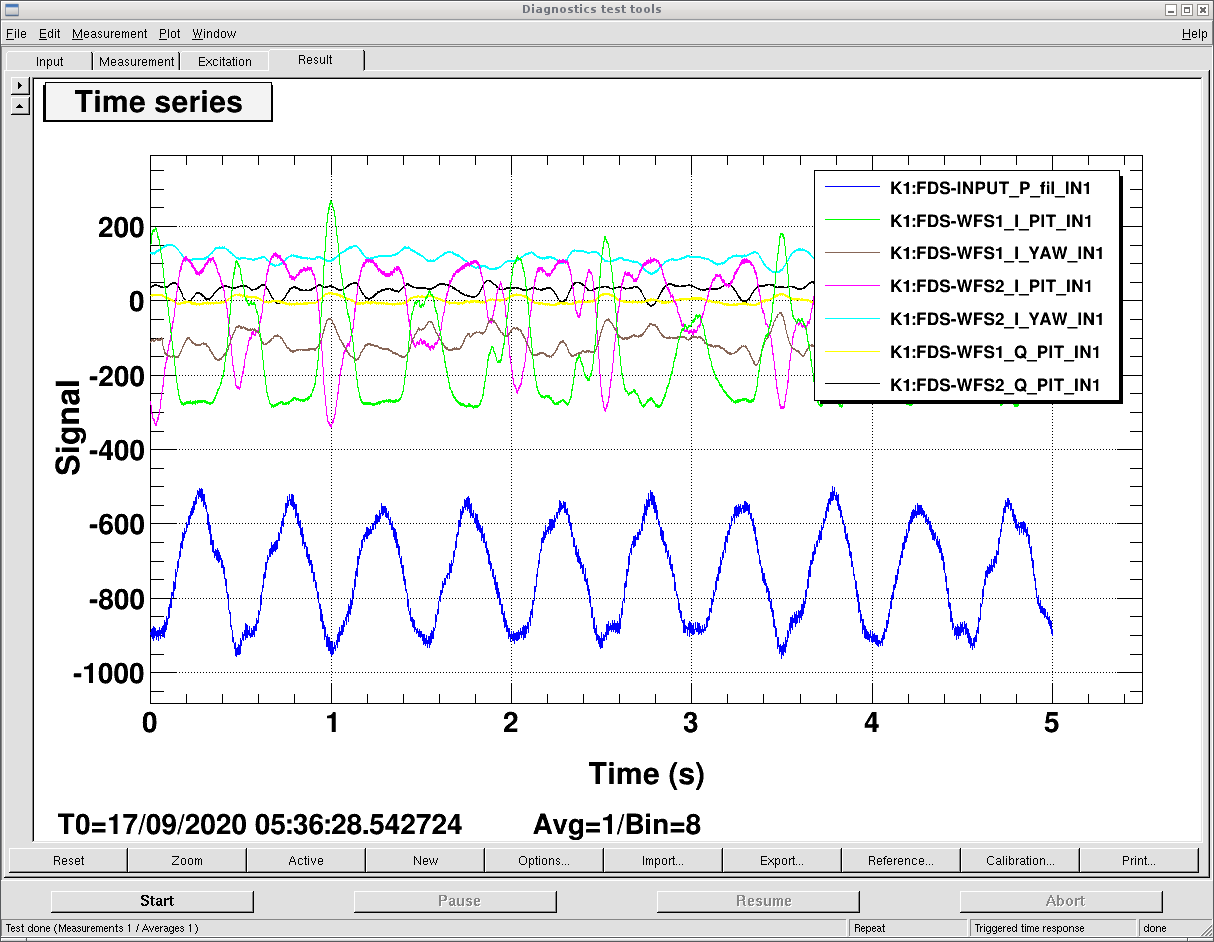
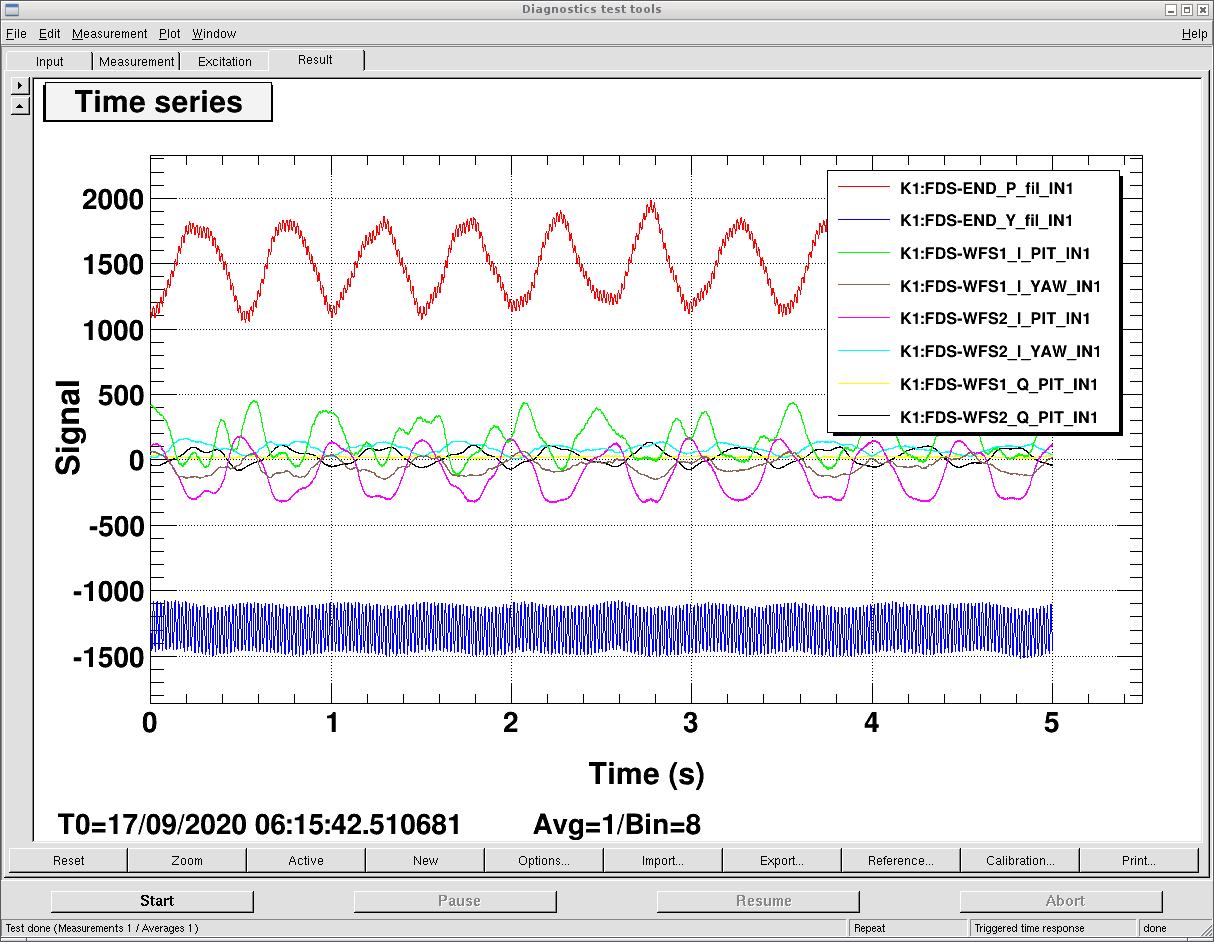
Figure 2: Drive INPUT pitch. We could see WFS1 reconstructed pitch error signal is in phase with the local control pitch motion (driving). But WFS2 reconstructed pitch error signal is out-of phase with the local control pitch motion (driving). We could see that there is some signal in Yaw error signal, but if you compare it with the no driving case, this Yaw error signal fluctuation seems not to be from Pitch driving (or coupling is covered by yaw original fluctuation). (The coupling to Q_phase is also very small)
Figure 3: Drive INPUT yaw. We could see WFS1 reconstructed pitch error signal is out-of phase with the local control yaw motion (driving). But WFS2 reconstructed pitch error signal is in phase with the local control yaw motion (driving). The pitch/yaw is also not visible. The coupling to Q-phase is also quite small.
Figure 4: Drive END pitch. Both WFS1/2 are giving out-of phase error singal. The coupling to yaw could be seen in WFS1. There is also lots of coupling to WFS2 Q phase (will not be used to feedback, so it's fine).
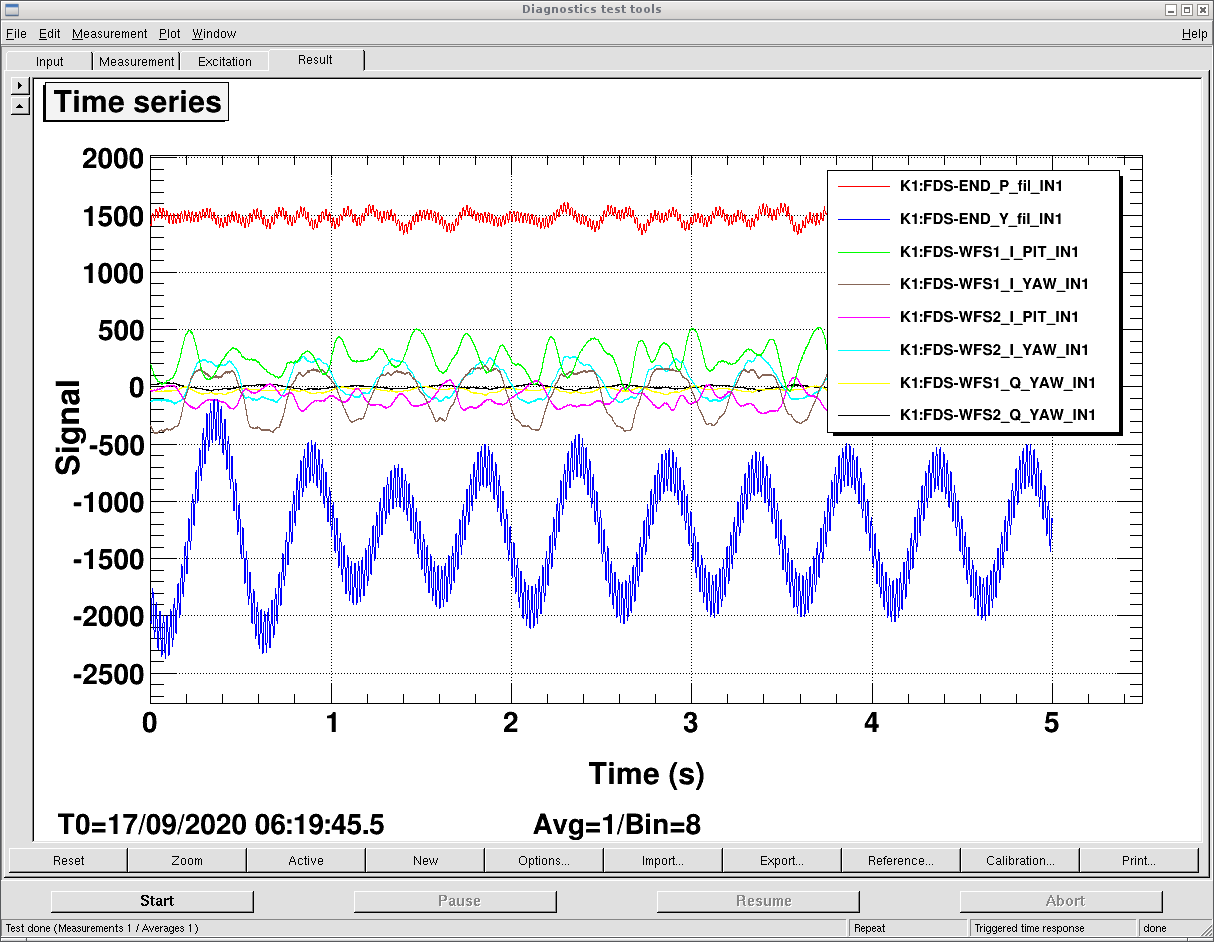
Figure 5: Drive END yaw. Both WFS1/2 are giving in-phase error signal. The coupling to pitch is not obvious. The coupling to Q phase is also not obvious.
The phase information could be used to decide the sign for feeding back.
According to the WFS error signal in time, it can be inferred that situation of QPDs location is shown in the attached figure.
In this case, the error signal from input mirror is shown with opposite sign on QPD1/2. While the error signal from end mirror has the same sign.
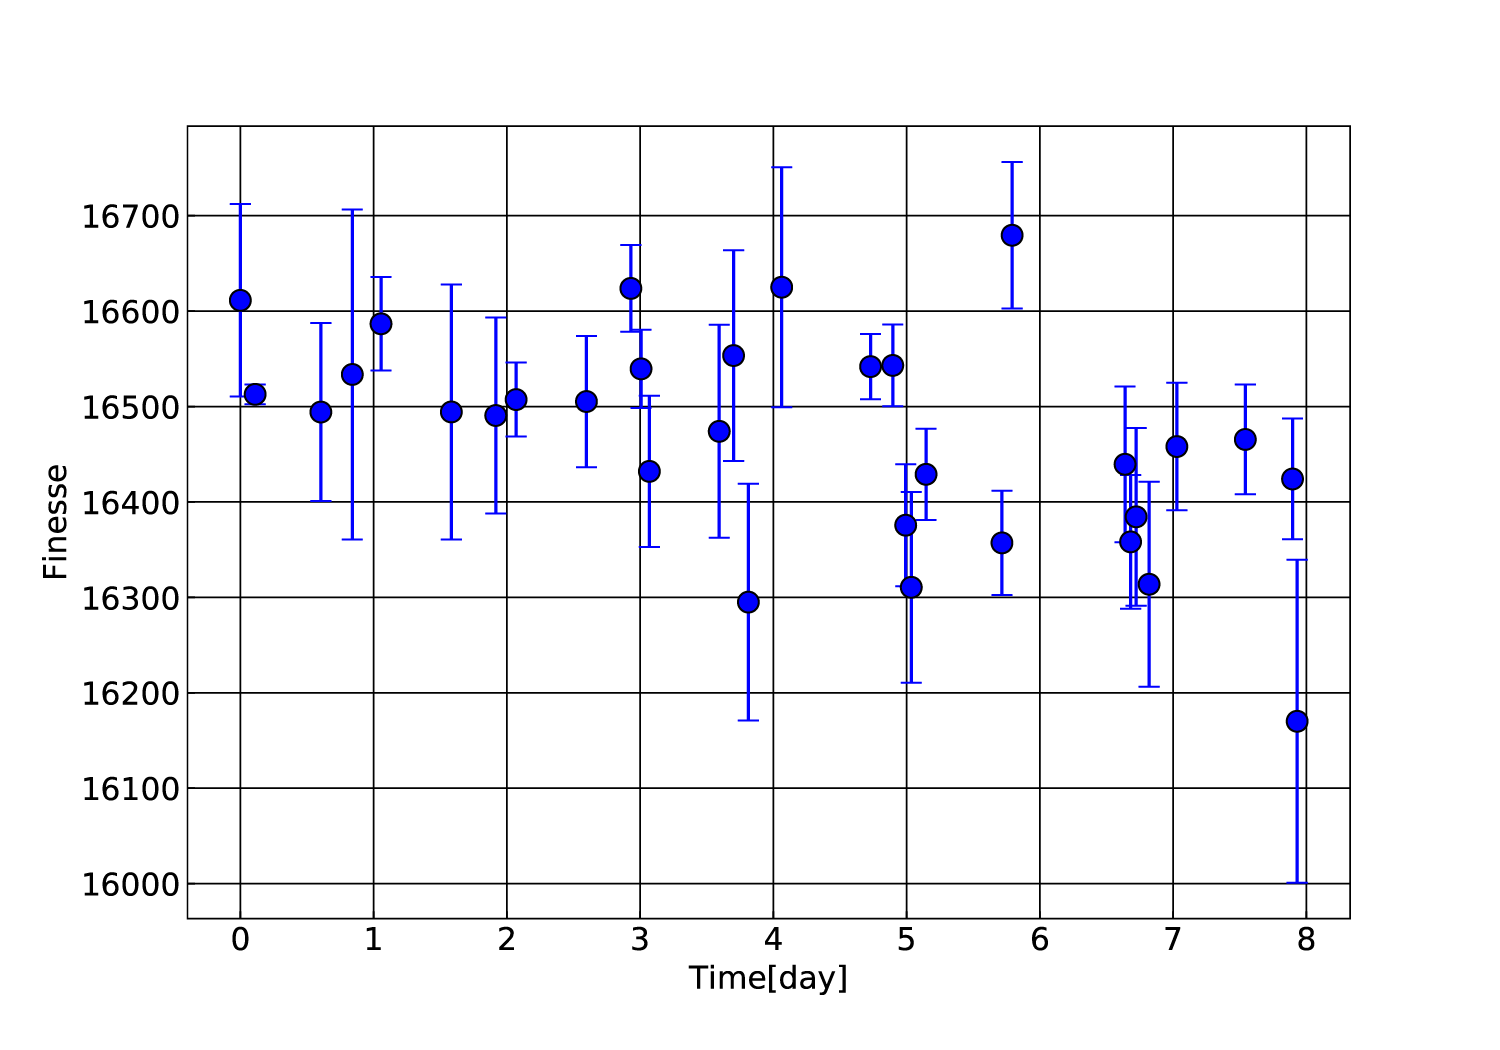
I'm monitoring the finesse of the cavity and it is slightly decreasing.
I'm planing to try to desorb the molecular layer by illuminating the main laser.
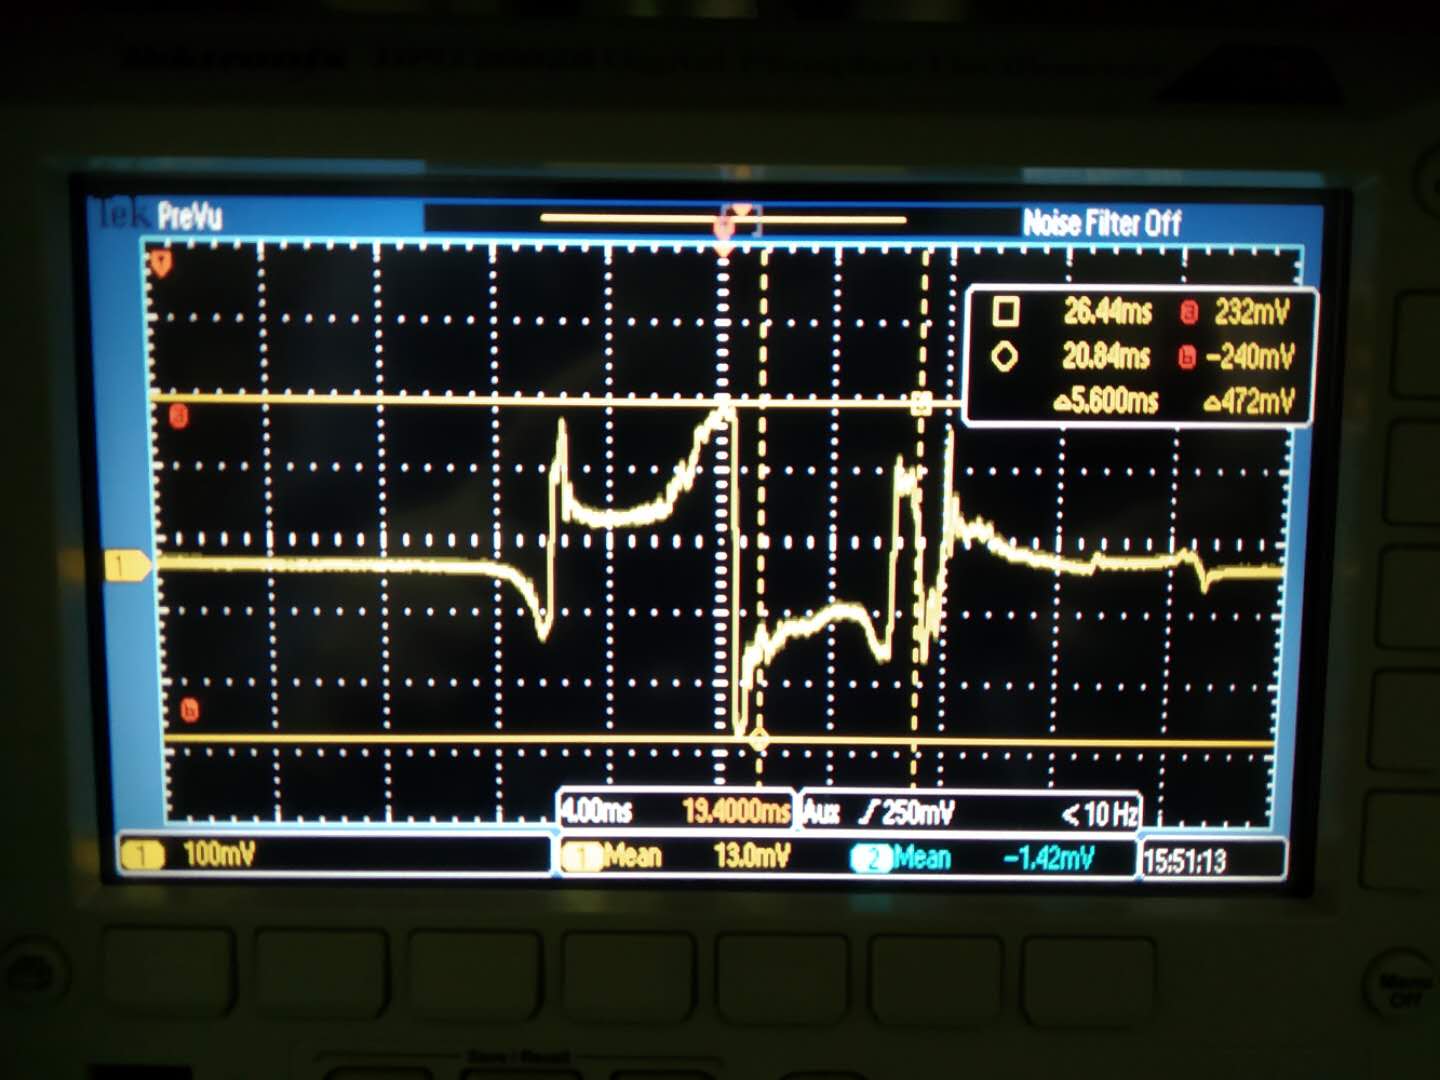
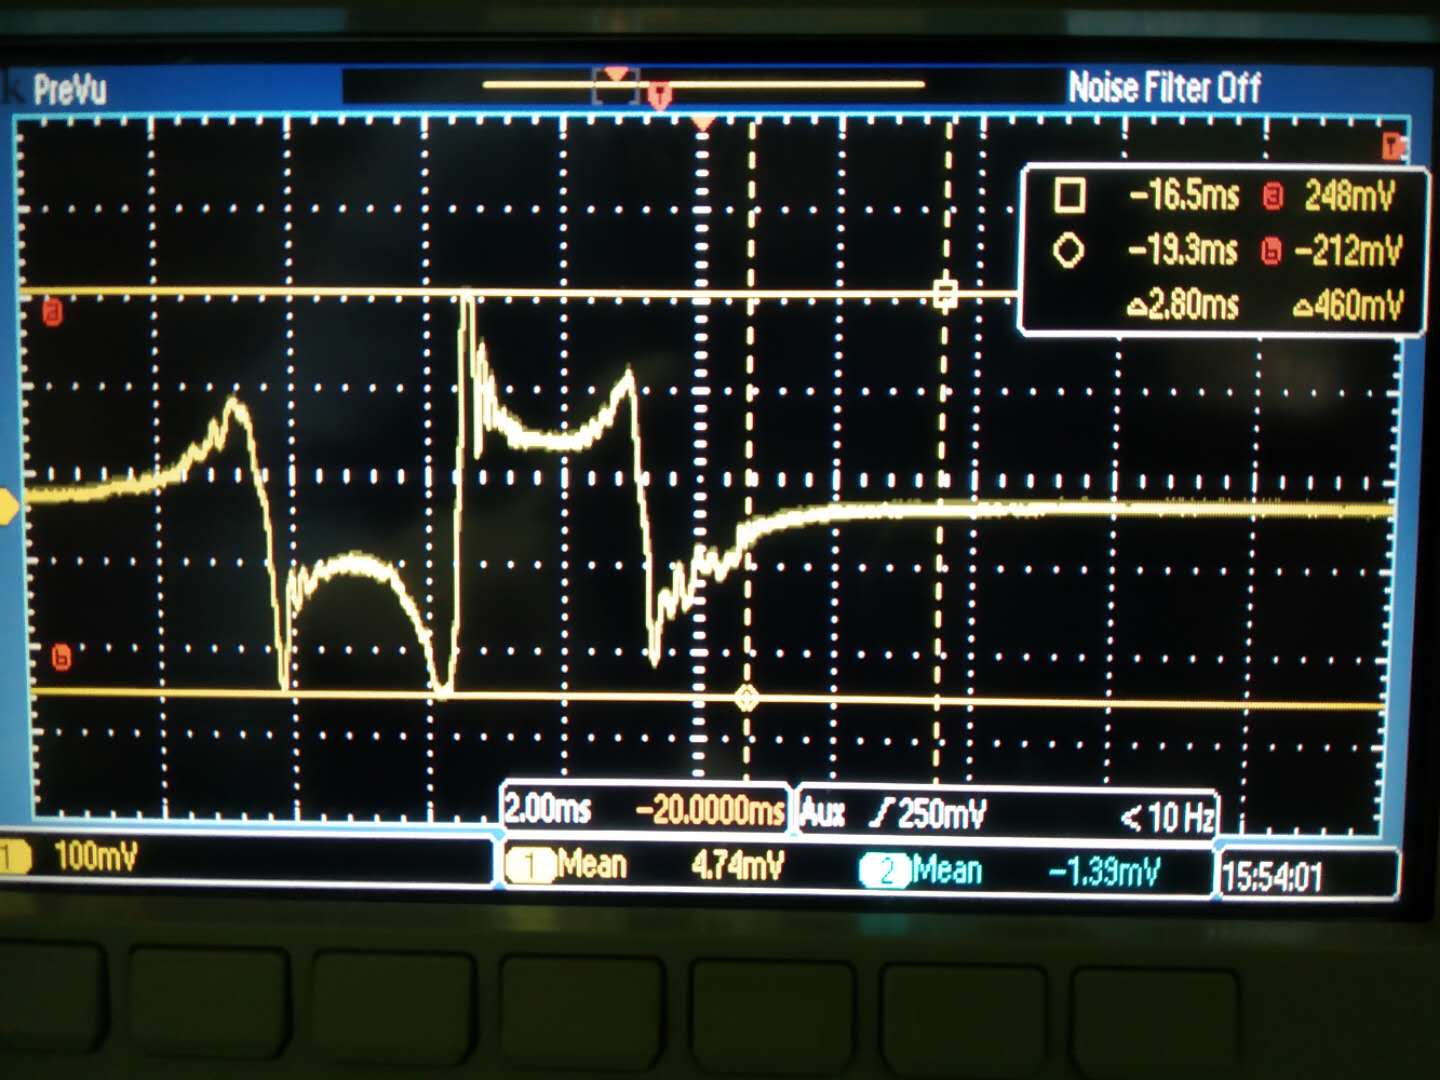
Firstly, I checked that PDH signal coming from Q-phase gives basically 0 when crossing carrier frequency (DDS2 channel3 phase 150deg). Then to check the RF gain/demodulation gain, a check of PDH singal in time was performed by looking at I-phase channel.
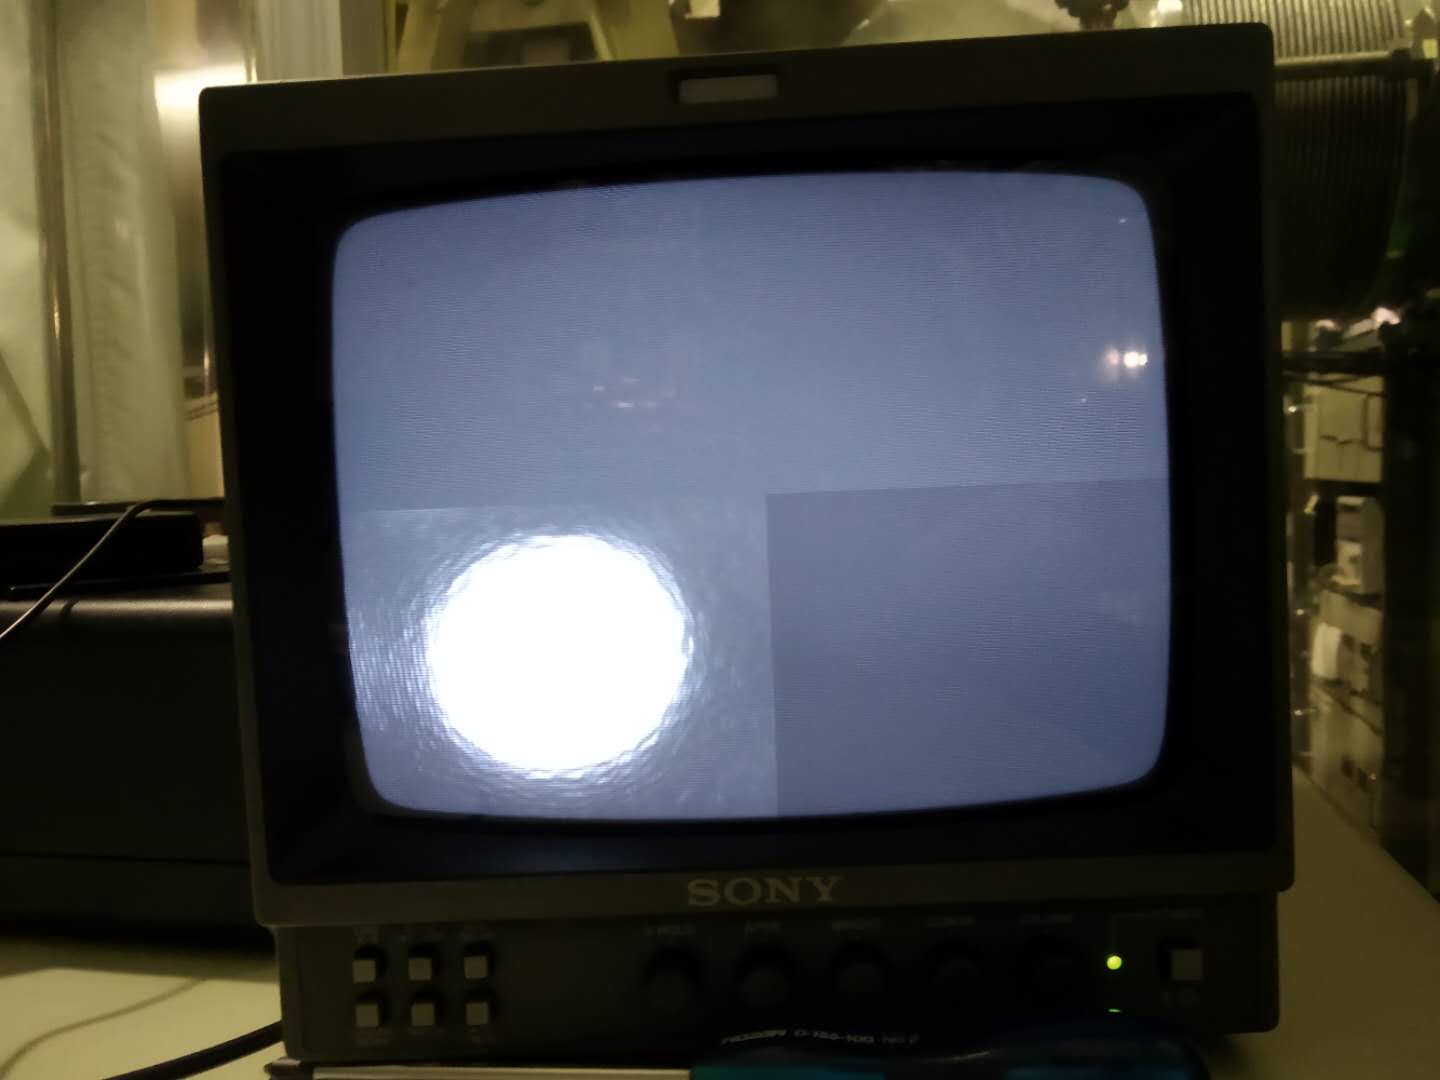
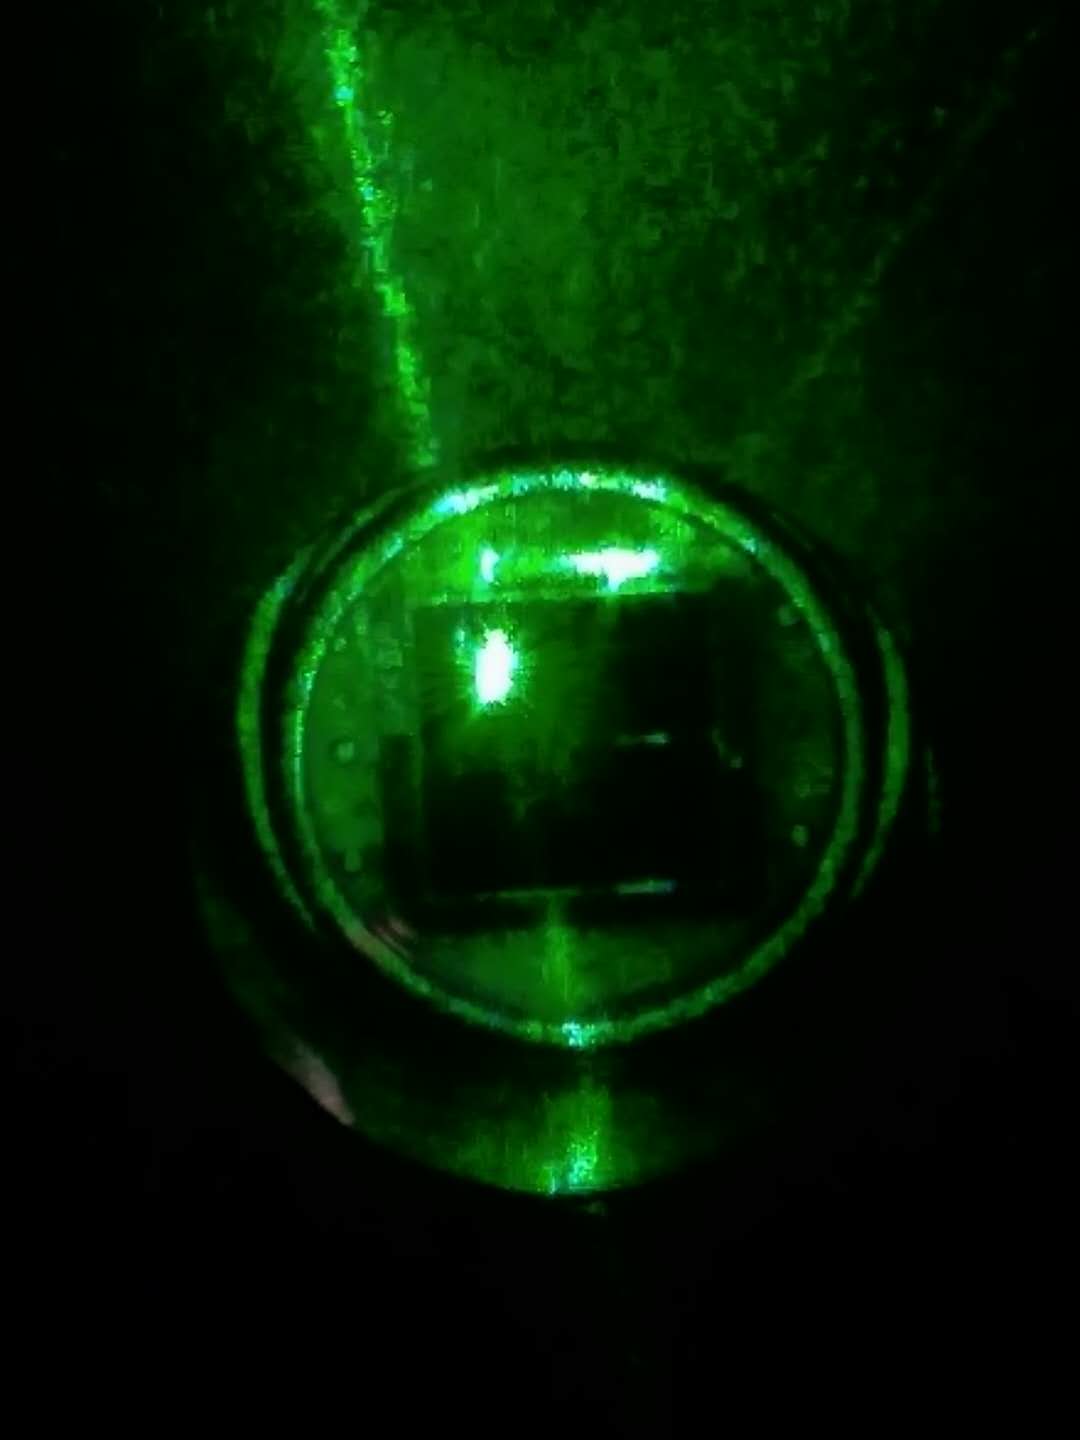
To have values for each segment, the alignment was checked to be as good as possible. (green tra dc is around 5200~5300) (a moment of flash is shown in attached figure 1) For each measurement, the light beam is centered on separate segment of QPDs by adjusting its closest steering mirror. (as shown in attached figure 2)
After checking demodulation phase, alignment and beam centering, the PDH singal was measured (several measurement is attached) and summarized as the following table.
|
|
QPD1 |
QPD2 |
|
seg1 |
440 |
472 |
|
seg2 |
412 |
460 |
|
seg3 |
440 |
468 |
|
seg4 |
424 |
472 |
Note that: the value showed in above table comes from a single measurement. The PDH signal actually have small variation around 10mV.
Although this measurement is not very much precise, it gives information about the signal coming from each QPD's segment.
[Yuhang, Aritomi]
[Aritomi, Yuhang]
First we fixed DDS AA phase to 150 deg and optimized I/Q demodulation phase again. As long as FC alignment is good, changes of the optimal demodulation phase are within a few degrees. During this measurement, we checked that WFS1 I3/Q3 coupling is less than 3%.
| segment | WFS1 1 | WFS1 2 | WFS1 3 | WFS1 4 | WFS2 1 | WFS2 2 | WFS2 3 | WFS2 4 |
| DGS demod phase | 100 | 105 | 104 | 99 | 135 | 136 | 137 | 135 |
Then we injected a 12Hz line to INPUT PIT and measured sensing matrix, but there is still large PY coupling. We found that 12Hz peak heights on each QPD1 segment are quite different (following table).
| segment | WFS1 I1 | WFS1 I2 | WFS1 I3 | WFS1 I4 |
| 12Hz peak height | 20.52 | 10.21 | 17.05 | 11.65 |
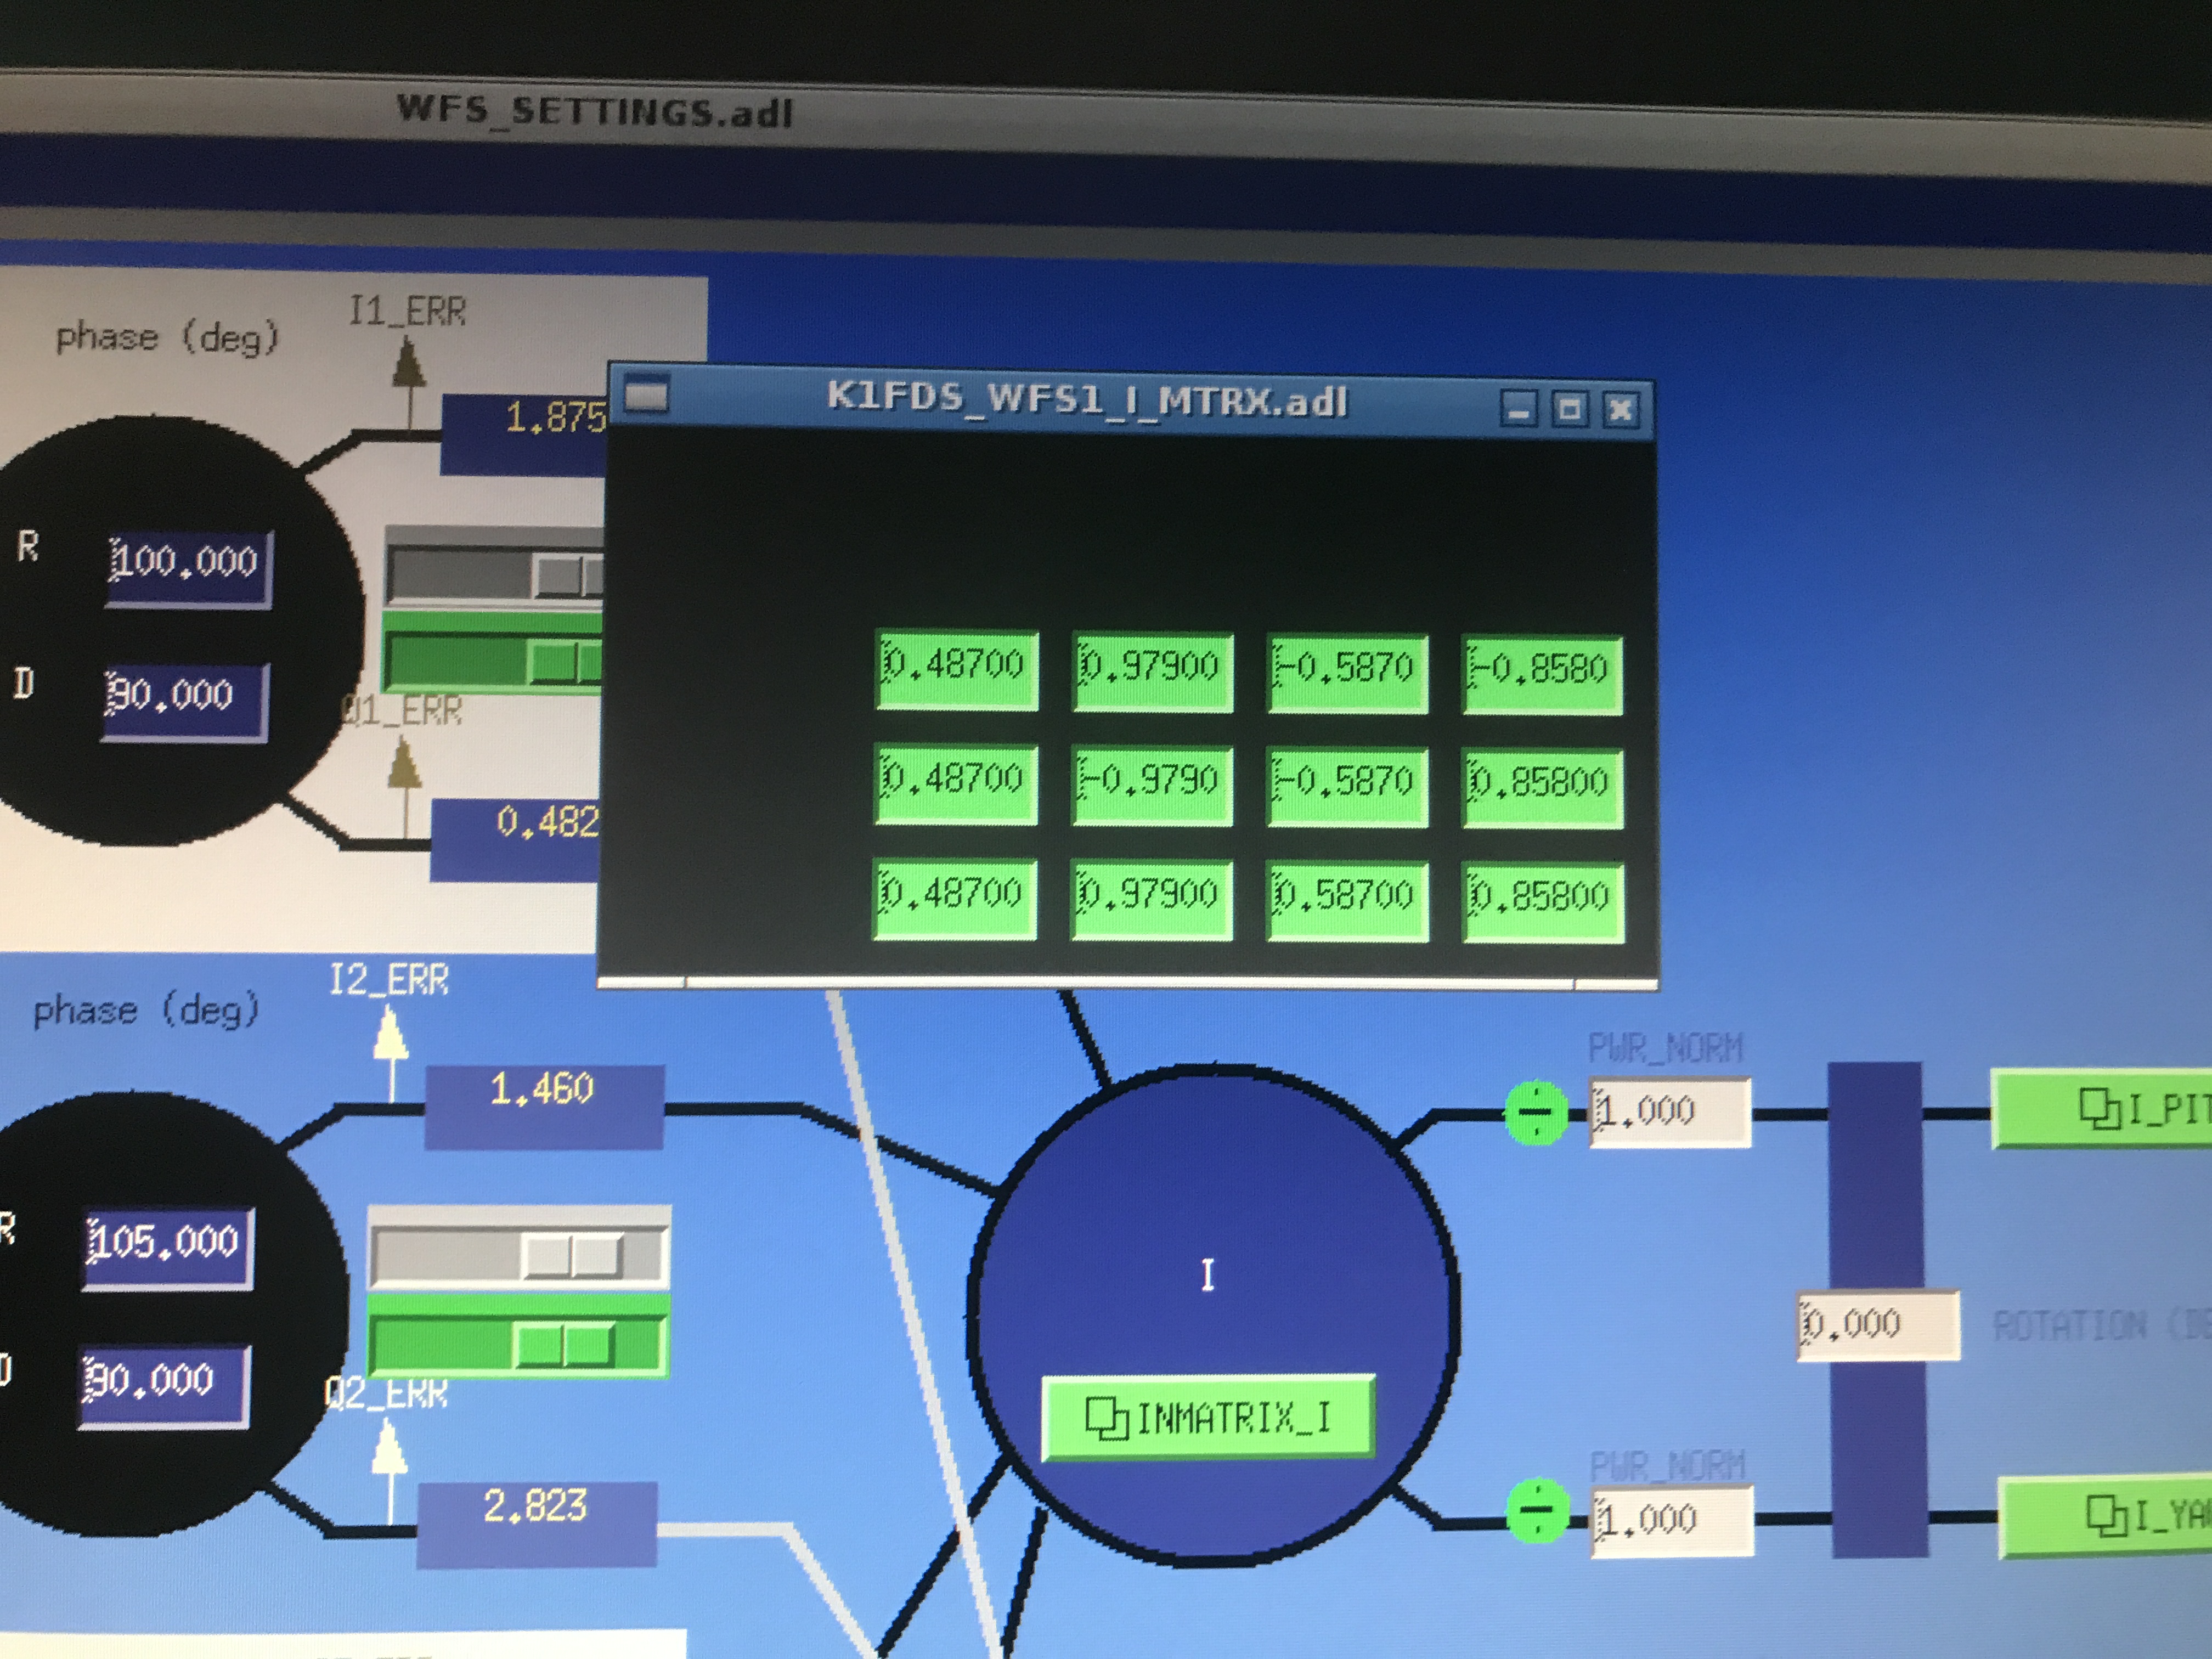
This gain unbalance may cause the coupling problem. So we compensated this gain unbalance in matrix in DGS (attached picture). Each number in the matrix is decided by 10/(12Hz peak height on the segment). In this case, there is no coupling in WFS1 I YAW for INPUT PIT driving, but there is still 16% coupling in WFS1 I PIT for INPUT YAW driving.
After that we aligned FC well and measured 12Hz peak height again. This time the gain unbalance is different from previous measurement.
| segment | WFS1 I1 | WFS1 I2 | WFS1 I3 | WFS1 I4 |
| 12Hz peak height | 16.77 | 11.06 | 19.73 | 9.53 |
To decide the gain unbalance precisely, we will check PDH signal on each segment and calibrate it by sending a 12 kHz line to PZT as we did for FC PDH signal. 12kHz is within DGS bandwidth and it is around UGF of FC loop. Since what only matters is ratio of gain of each segment, it is not a problem even if the injected line is suppressed by FC control loop.
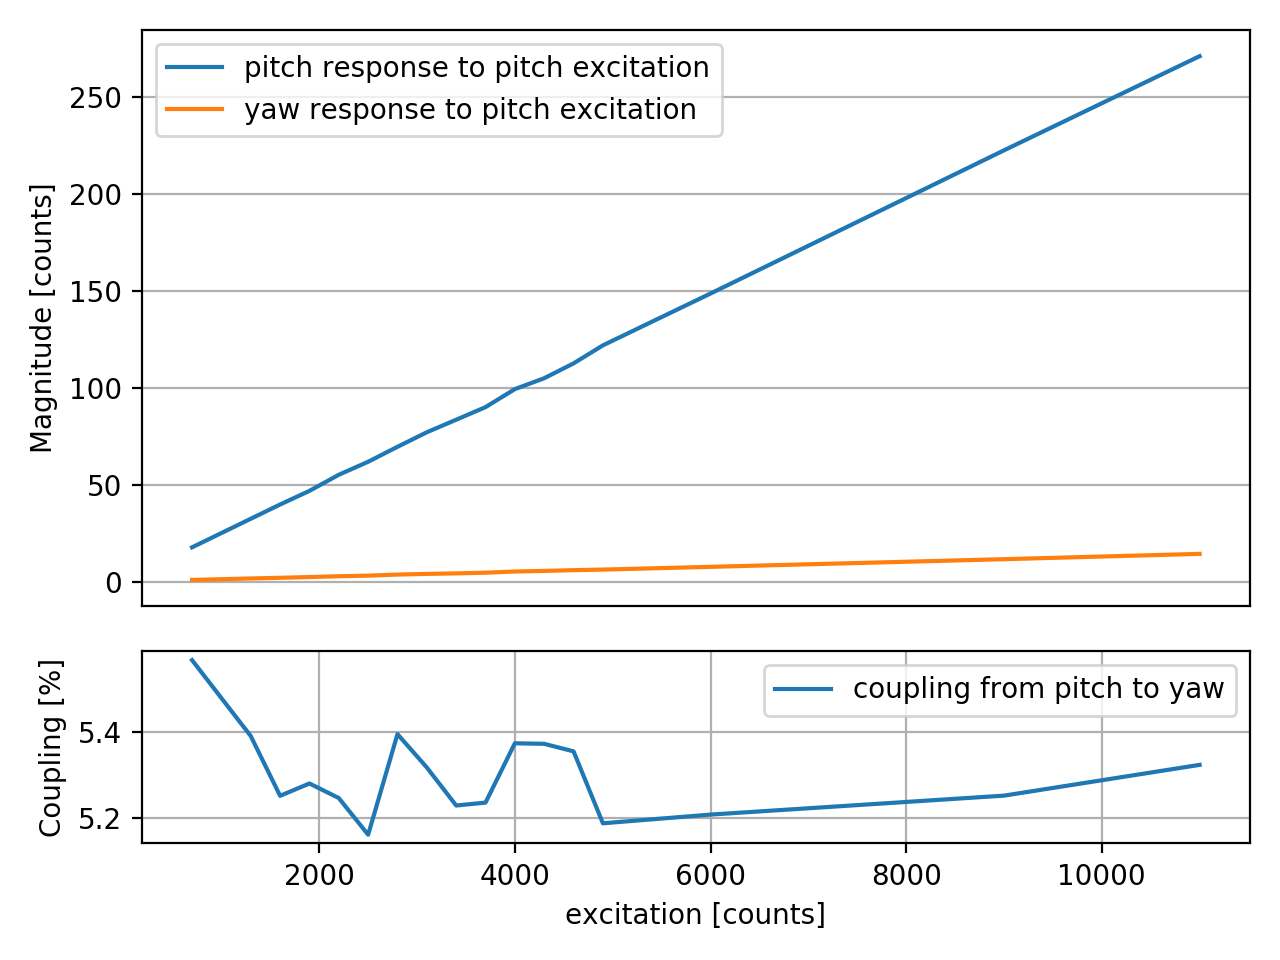
There was strange coupling observed in elog2206, but I think it may due to the not proper excitation singal sent to END mirror.
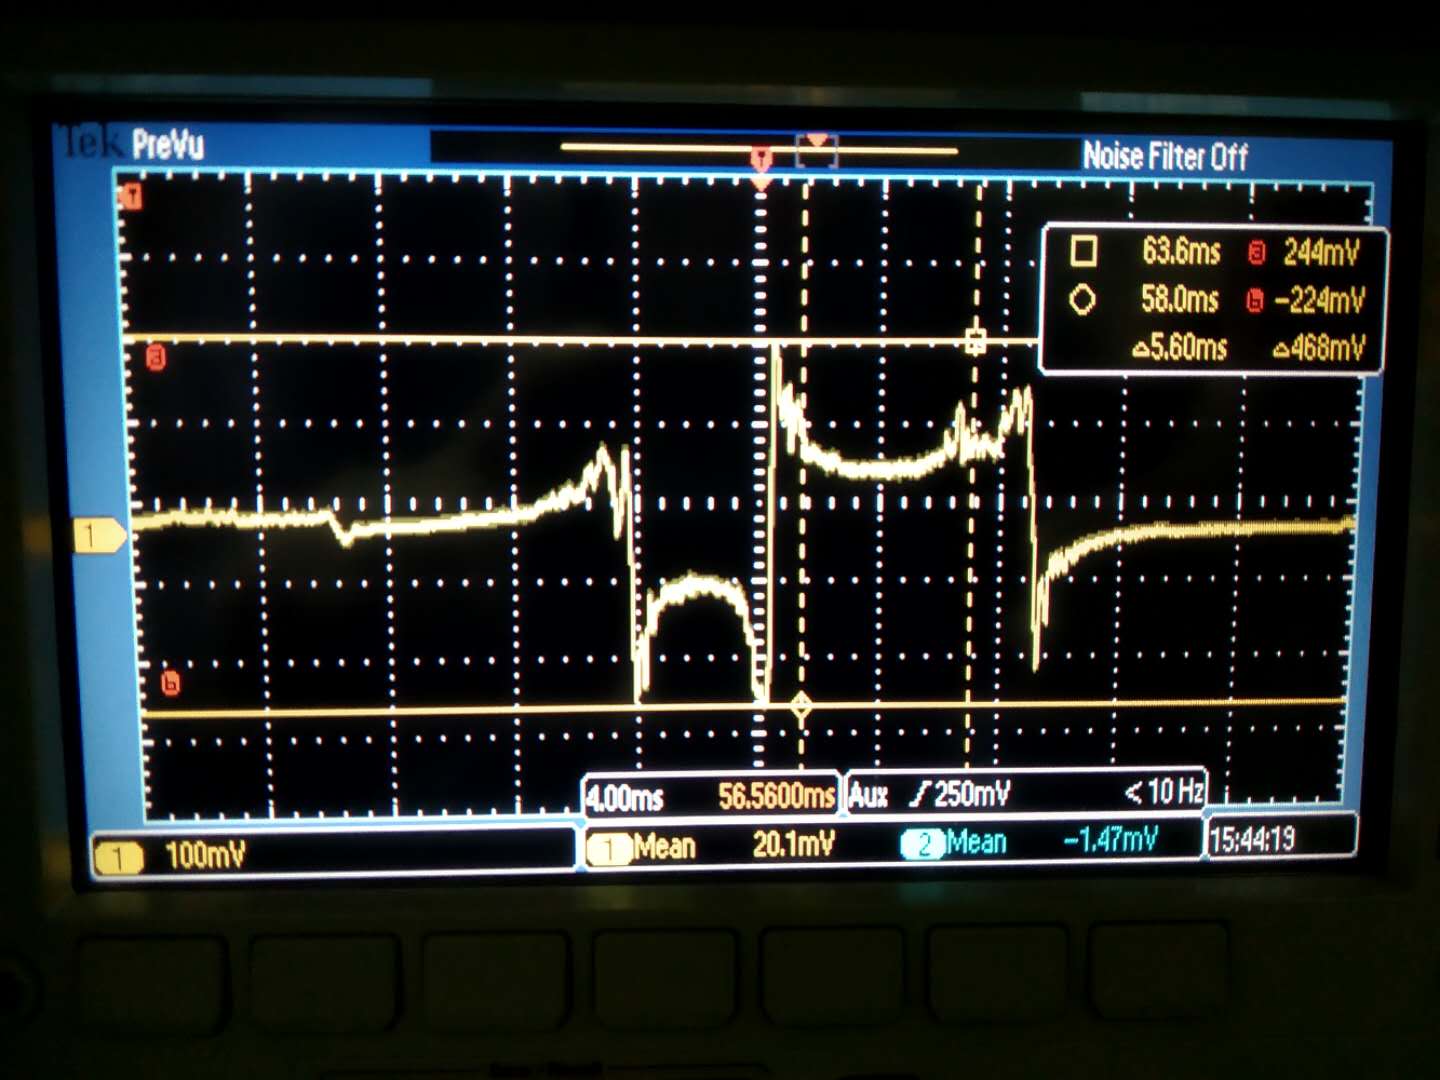
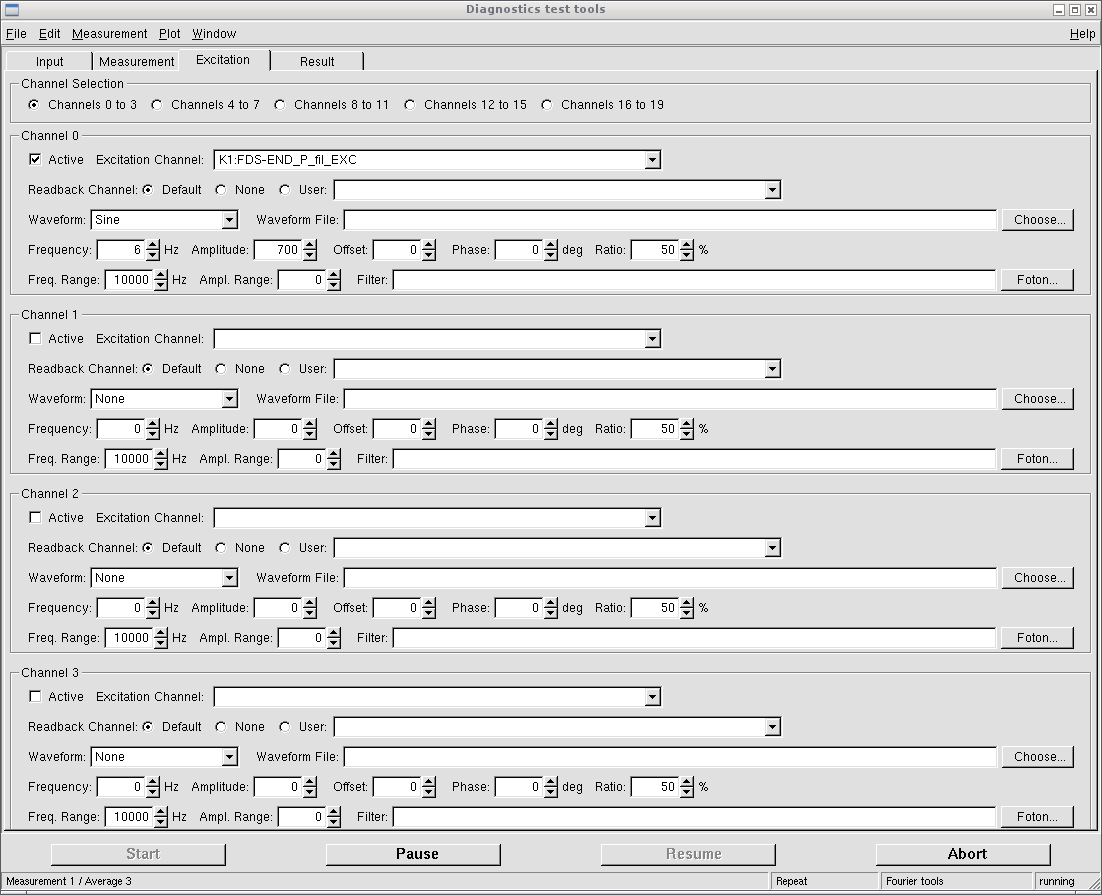
Excitation: the excitation is a sine wave, with amplitude from 700 to 11000, sent to END mirror pitch. (An example shotscreen is shown in attached figure 2)
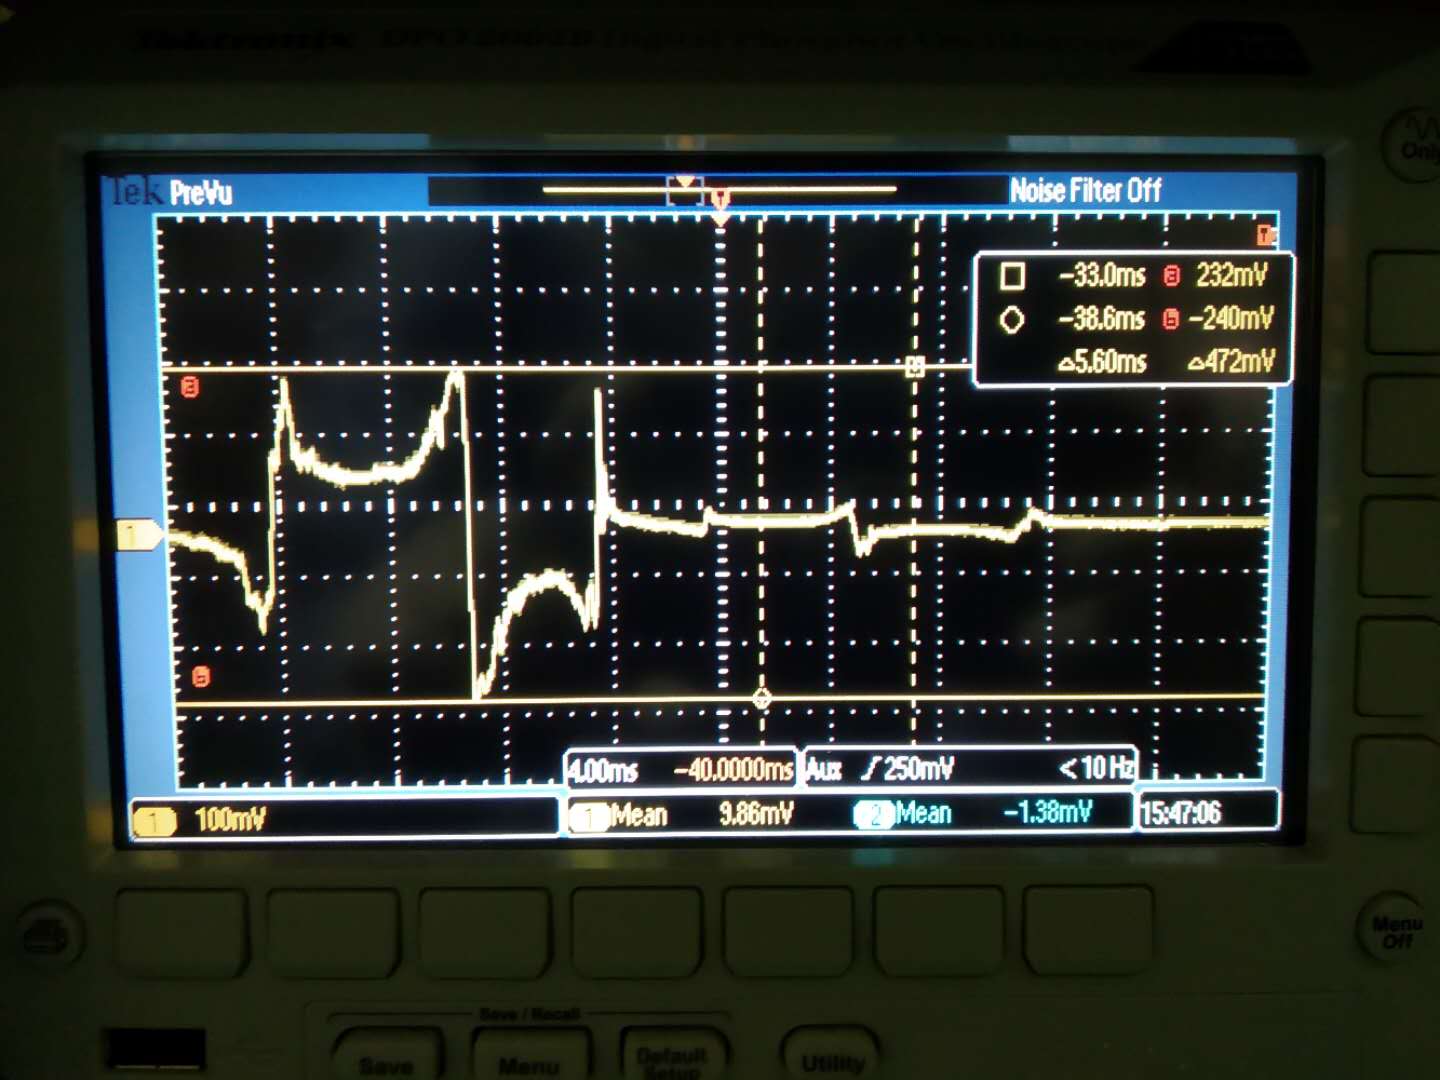
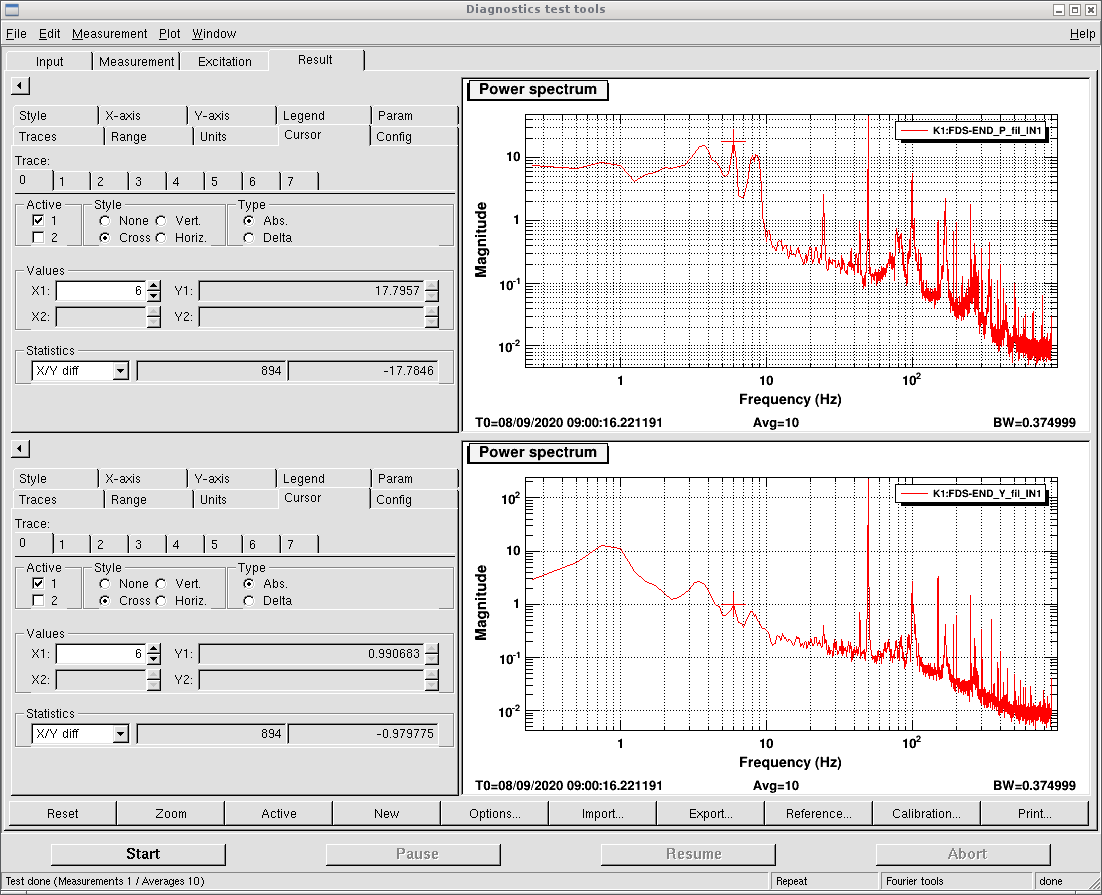
Measurement: the spectrum of end mirror optical lever pitch/yaw were observed. (An example shotscreen is shown in attached figure 3)
The response information is extracted by using the cursor at 6Hz on each spectrum, and read the value of cursor. The coupling is the ratio of yaw/pitch peaks.
The coupling was always around 5.2%, which is the minimum could be found now.
The method used to find minimum was by adjusting the coefficient for H1 and H3 coils (giving them same/slightly different values from 0.02 to 0.06). The minimum is around -0.05 for H1 and 0.05 for H3.
What I did
I replaced the PD at transmitted port in order for precise measurement of decay time.
Current PD has the bandwidth of 150 MHz.
Then I measured the ringdown of transmitted beam around 8 K.
Results
The PD has fast response such that the measurement can be done well.
The finesse was obtained by fitting the measured data, and it was about 1.65*10^4 though 1.67*10^4 at room temperature.
Next step
As the UGF of PDH servo is about 3 kHz and cannot achieve stable lock, I have to modify the servo to set higher UGF.
In addition, I will monitor the finesse behavior for a while.
Aritomi and Yuhang
As reported in elog2173, the driving for end mirror has some coupling between pitch and yaw. To decouple them, we decide to modify the driving matrix.
However, we found out that the coupling between pitch and yaw is different for different excitation strength. The coupling situation is shown in the attached figures and sumarized in the following table.
| excitation | coupling (pitch to yaw) |
| 5000 | 22.5% |
| 1000 | 3.4% |
This measurement is done after optimizing the coupling with excitation of 1000. The pitch driving matrix is as following:
| H1 | H2 | H3 | H4 |
| -0.052 | 1.4 | 0.052 | 1 |
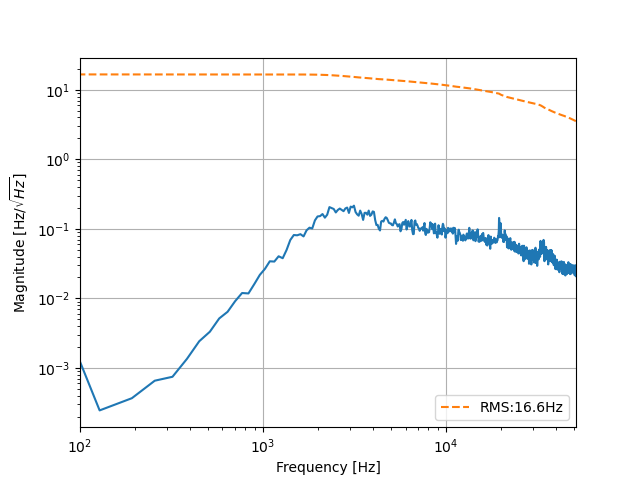
I compared green, BAB, CCFC locking accuracy.
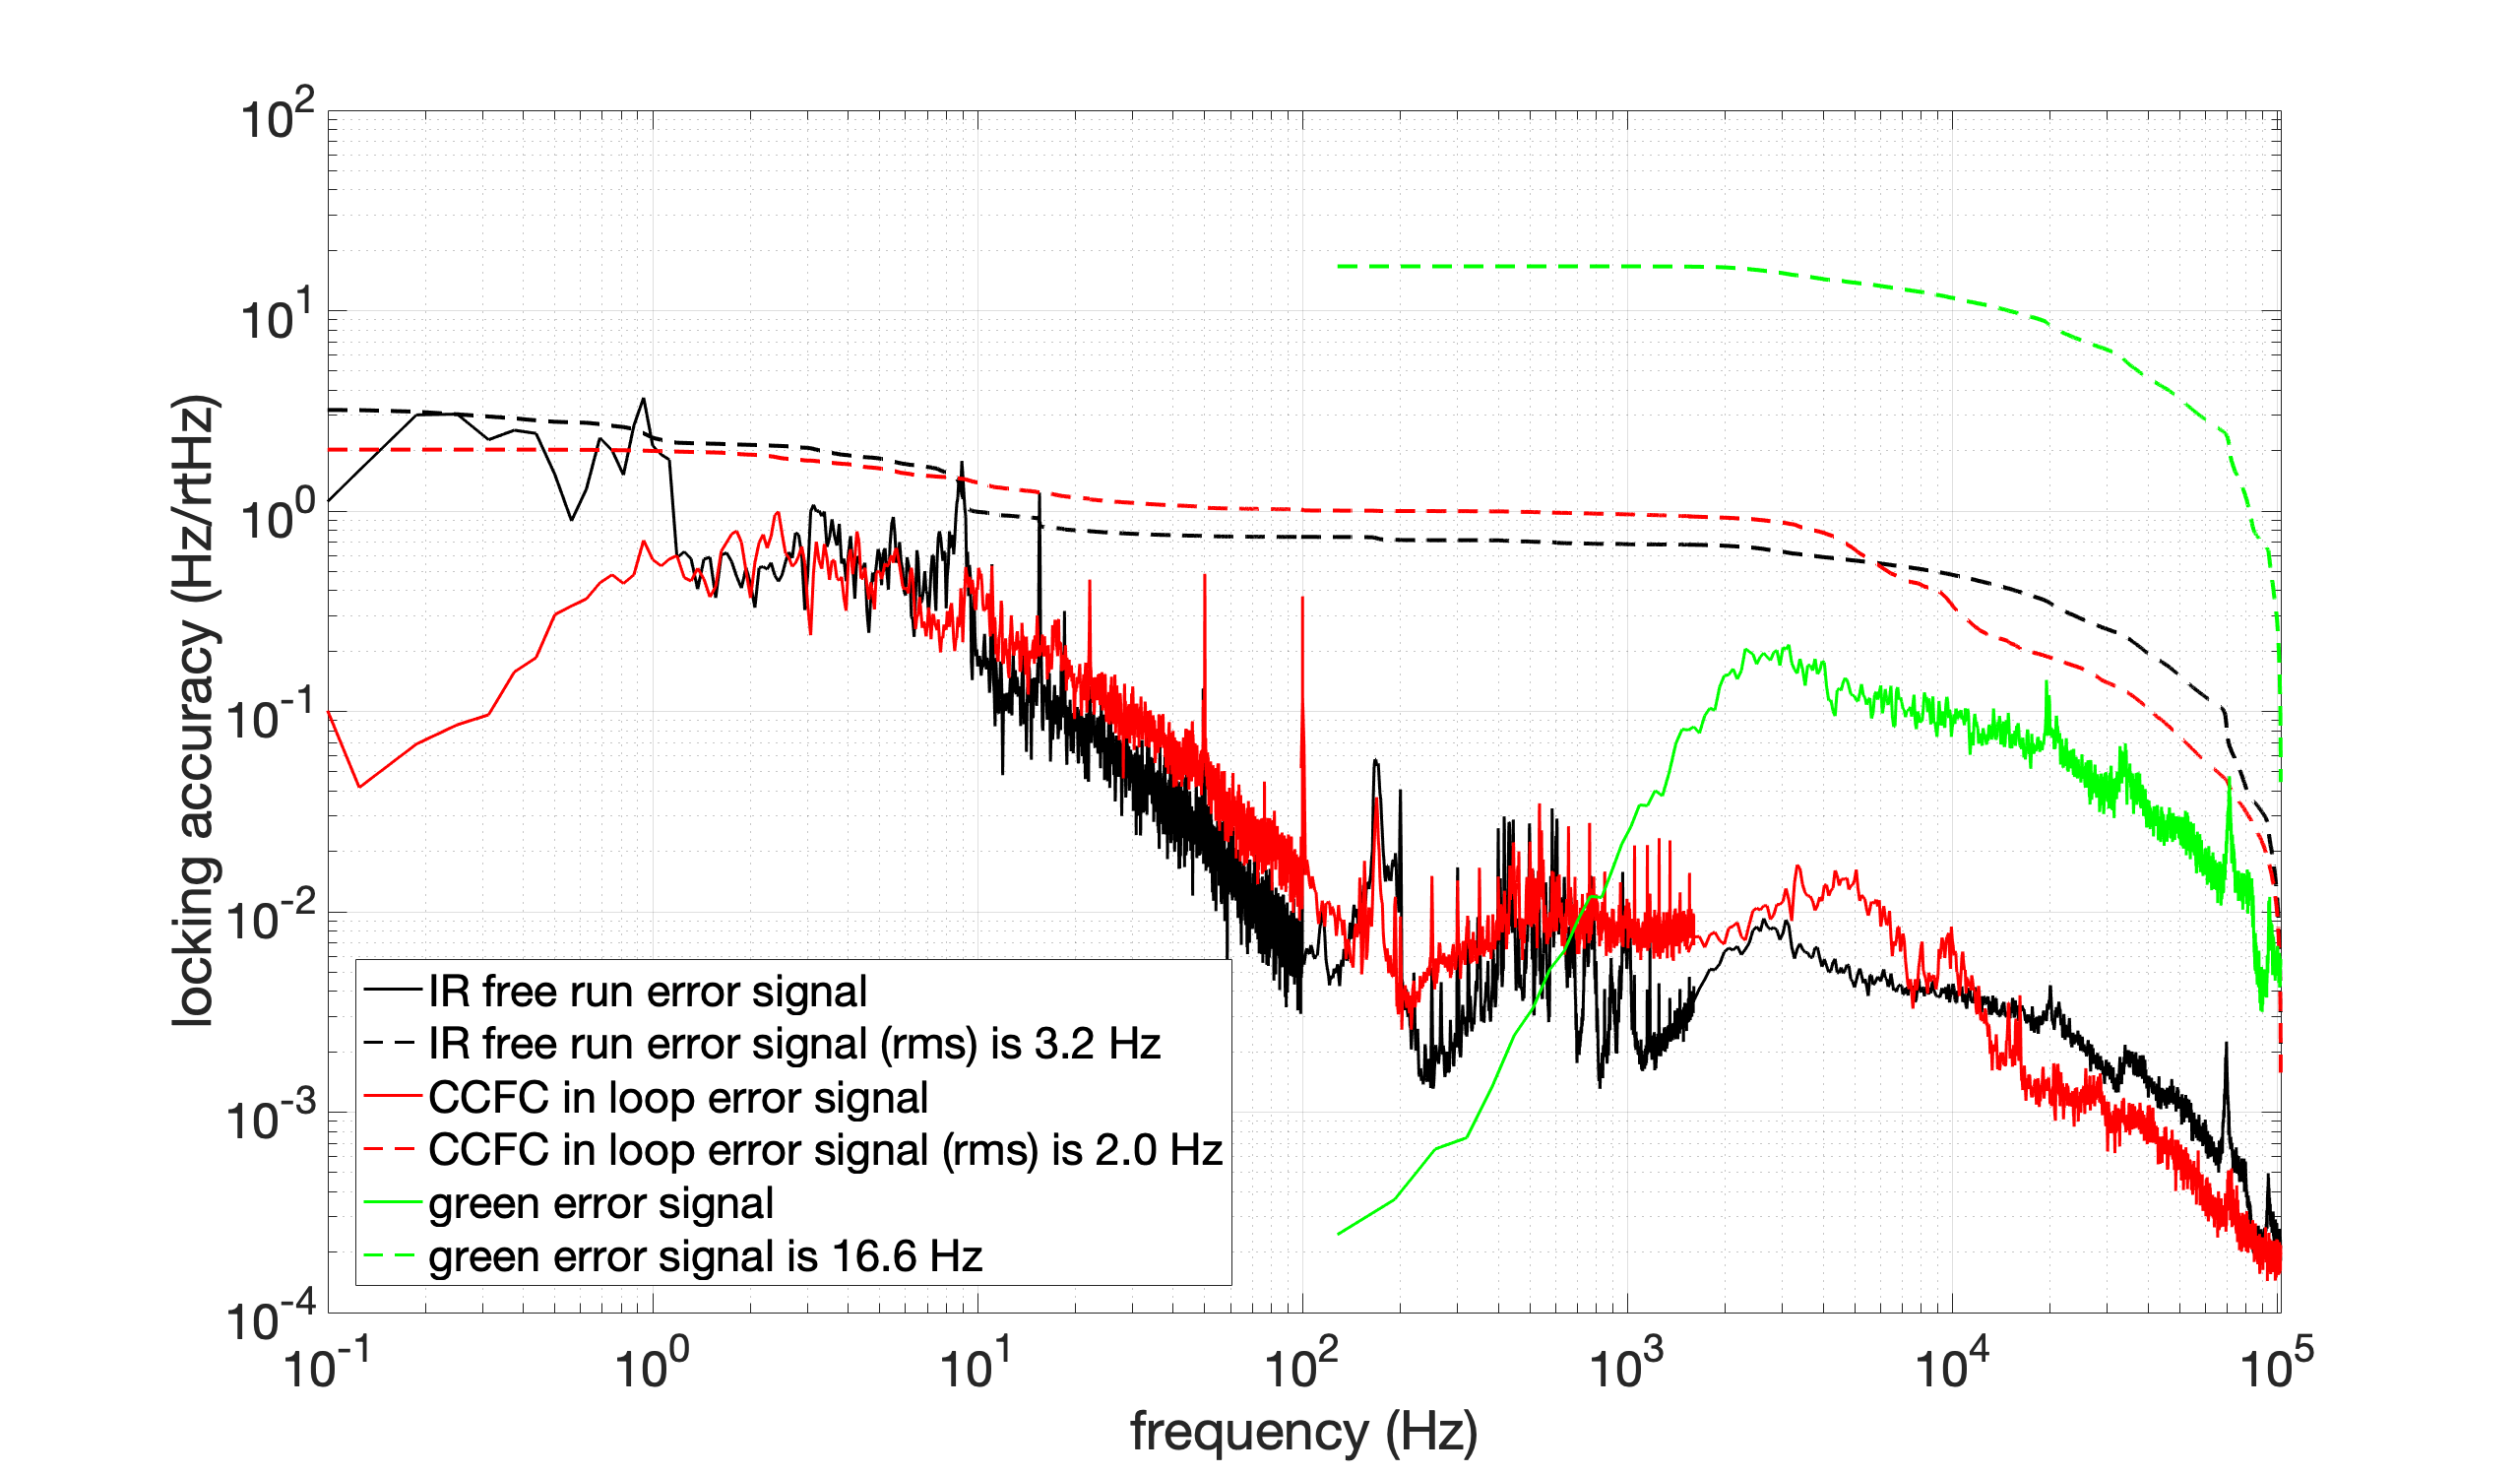
As pointed out by Aritomi-san, the formula used to calibrate the measurement had some problem (check entry642). After correcting that, the measurement result becomes reasonable.
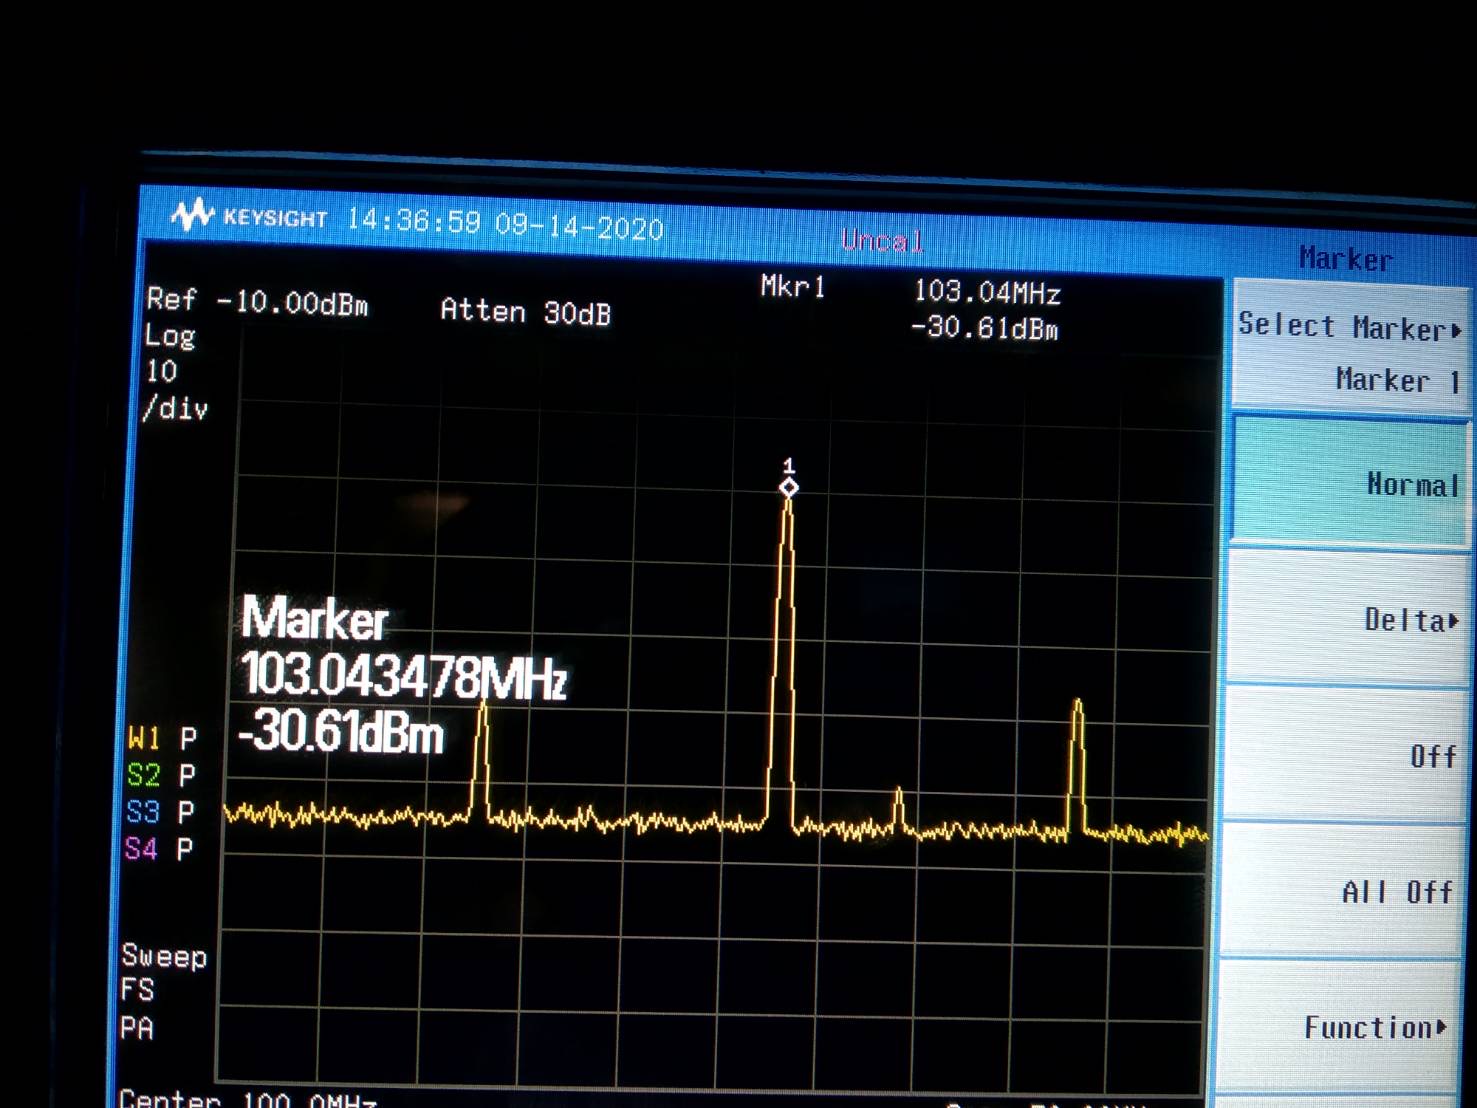
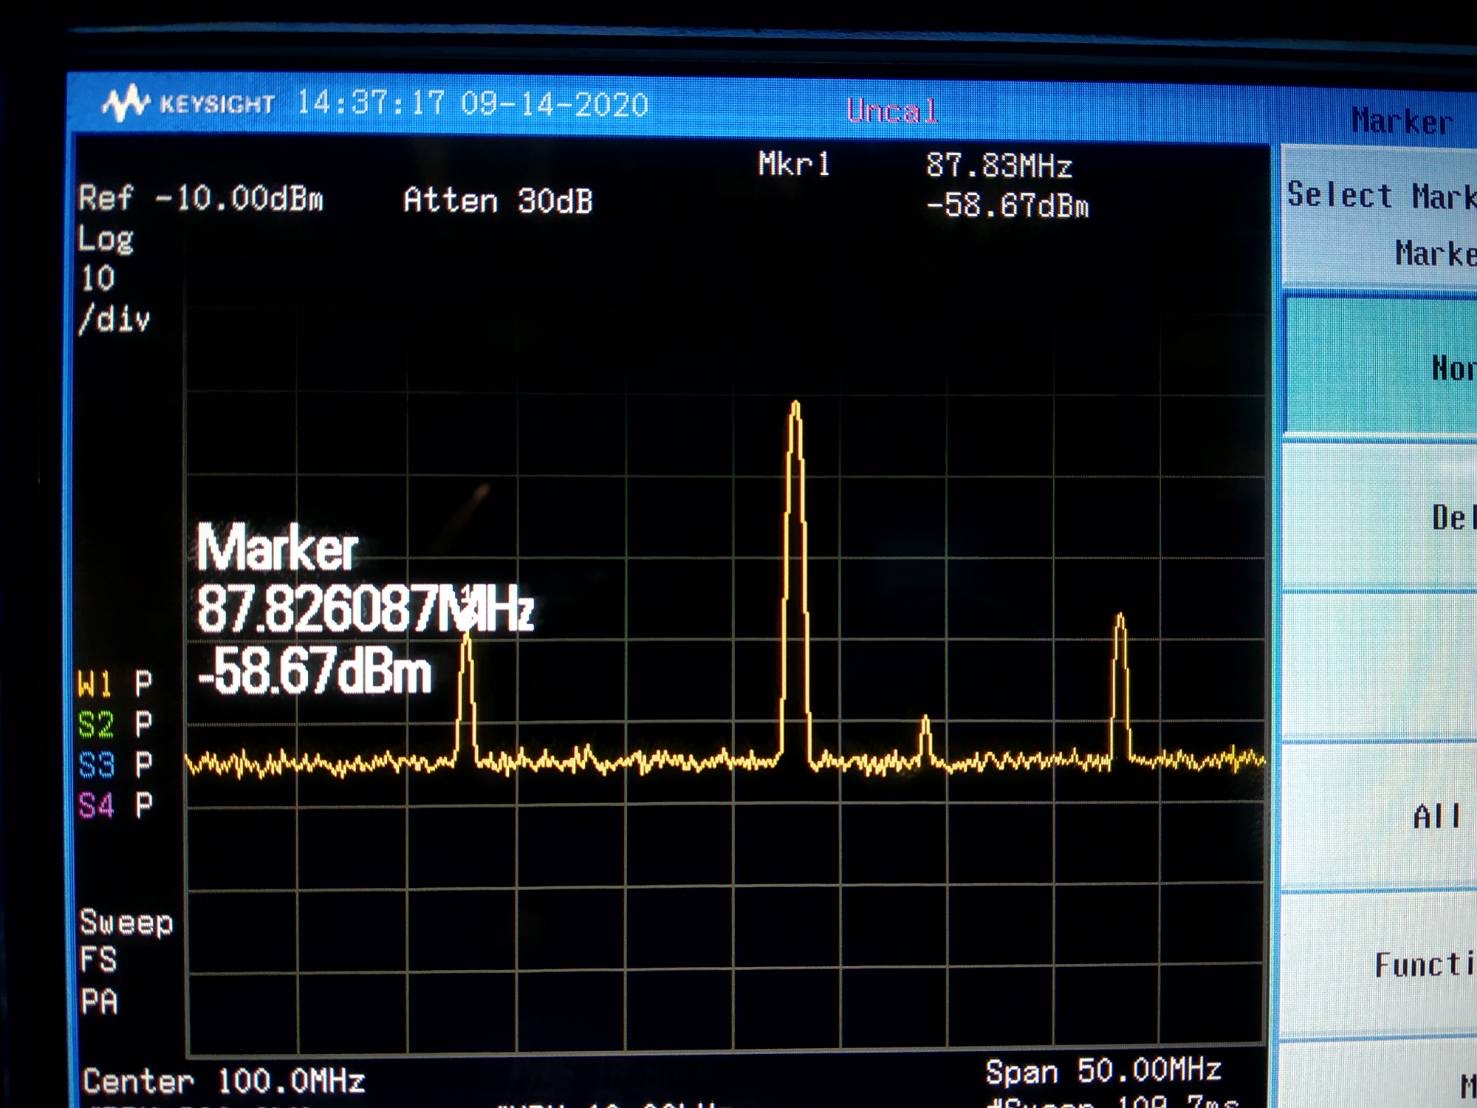
Today, we find that we were injecting 25kHz noise inside the PZT.
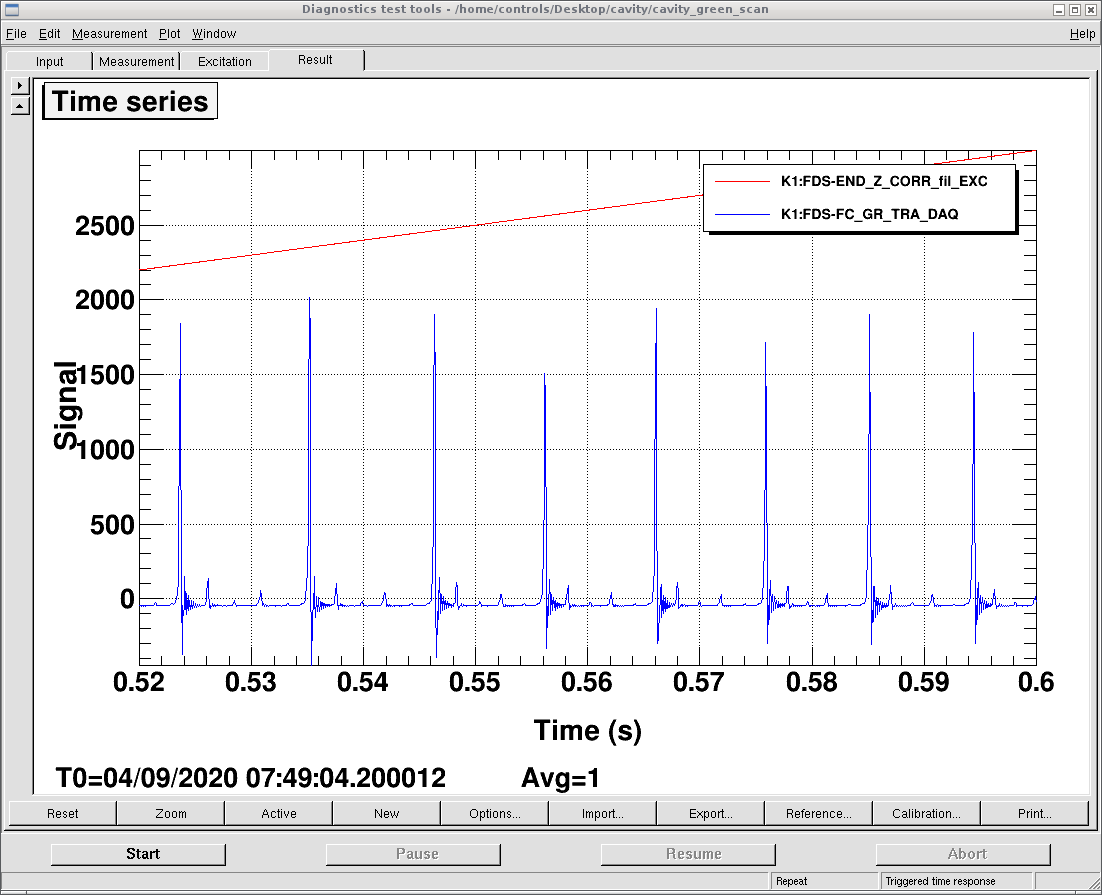
After removing the injected signals, the cavity scan was performed again. The diaggui file for cavity scan (green) is saved in Desktop/cavity as cavity_green_scan.xml.
This time, the spectrum is good.
Apart from this, FC green locking is normal again.