NAOJ GW Elog Logbook 3.2

I started a measurement of aztec60 40 2 rotated (same as previous one) yesterday afternoon that it is still on-going.
issue seems solved
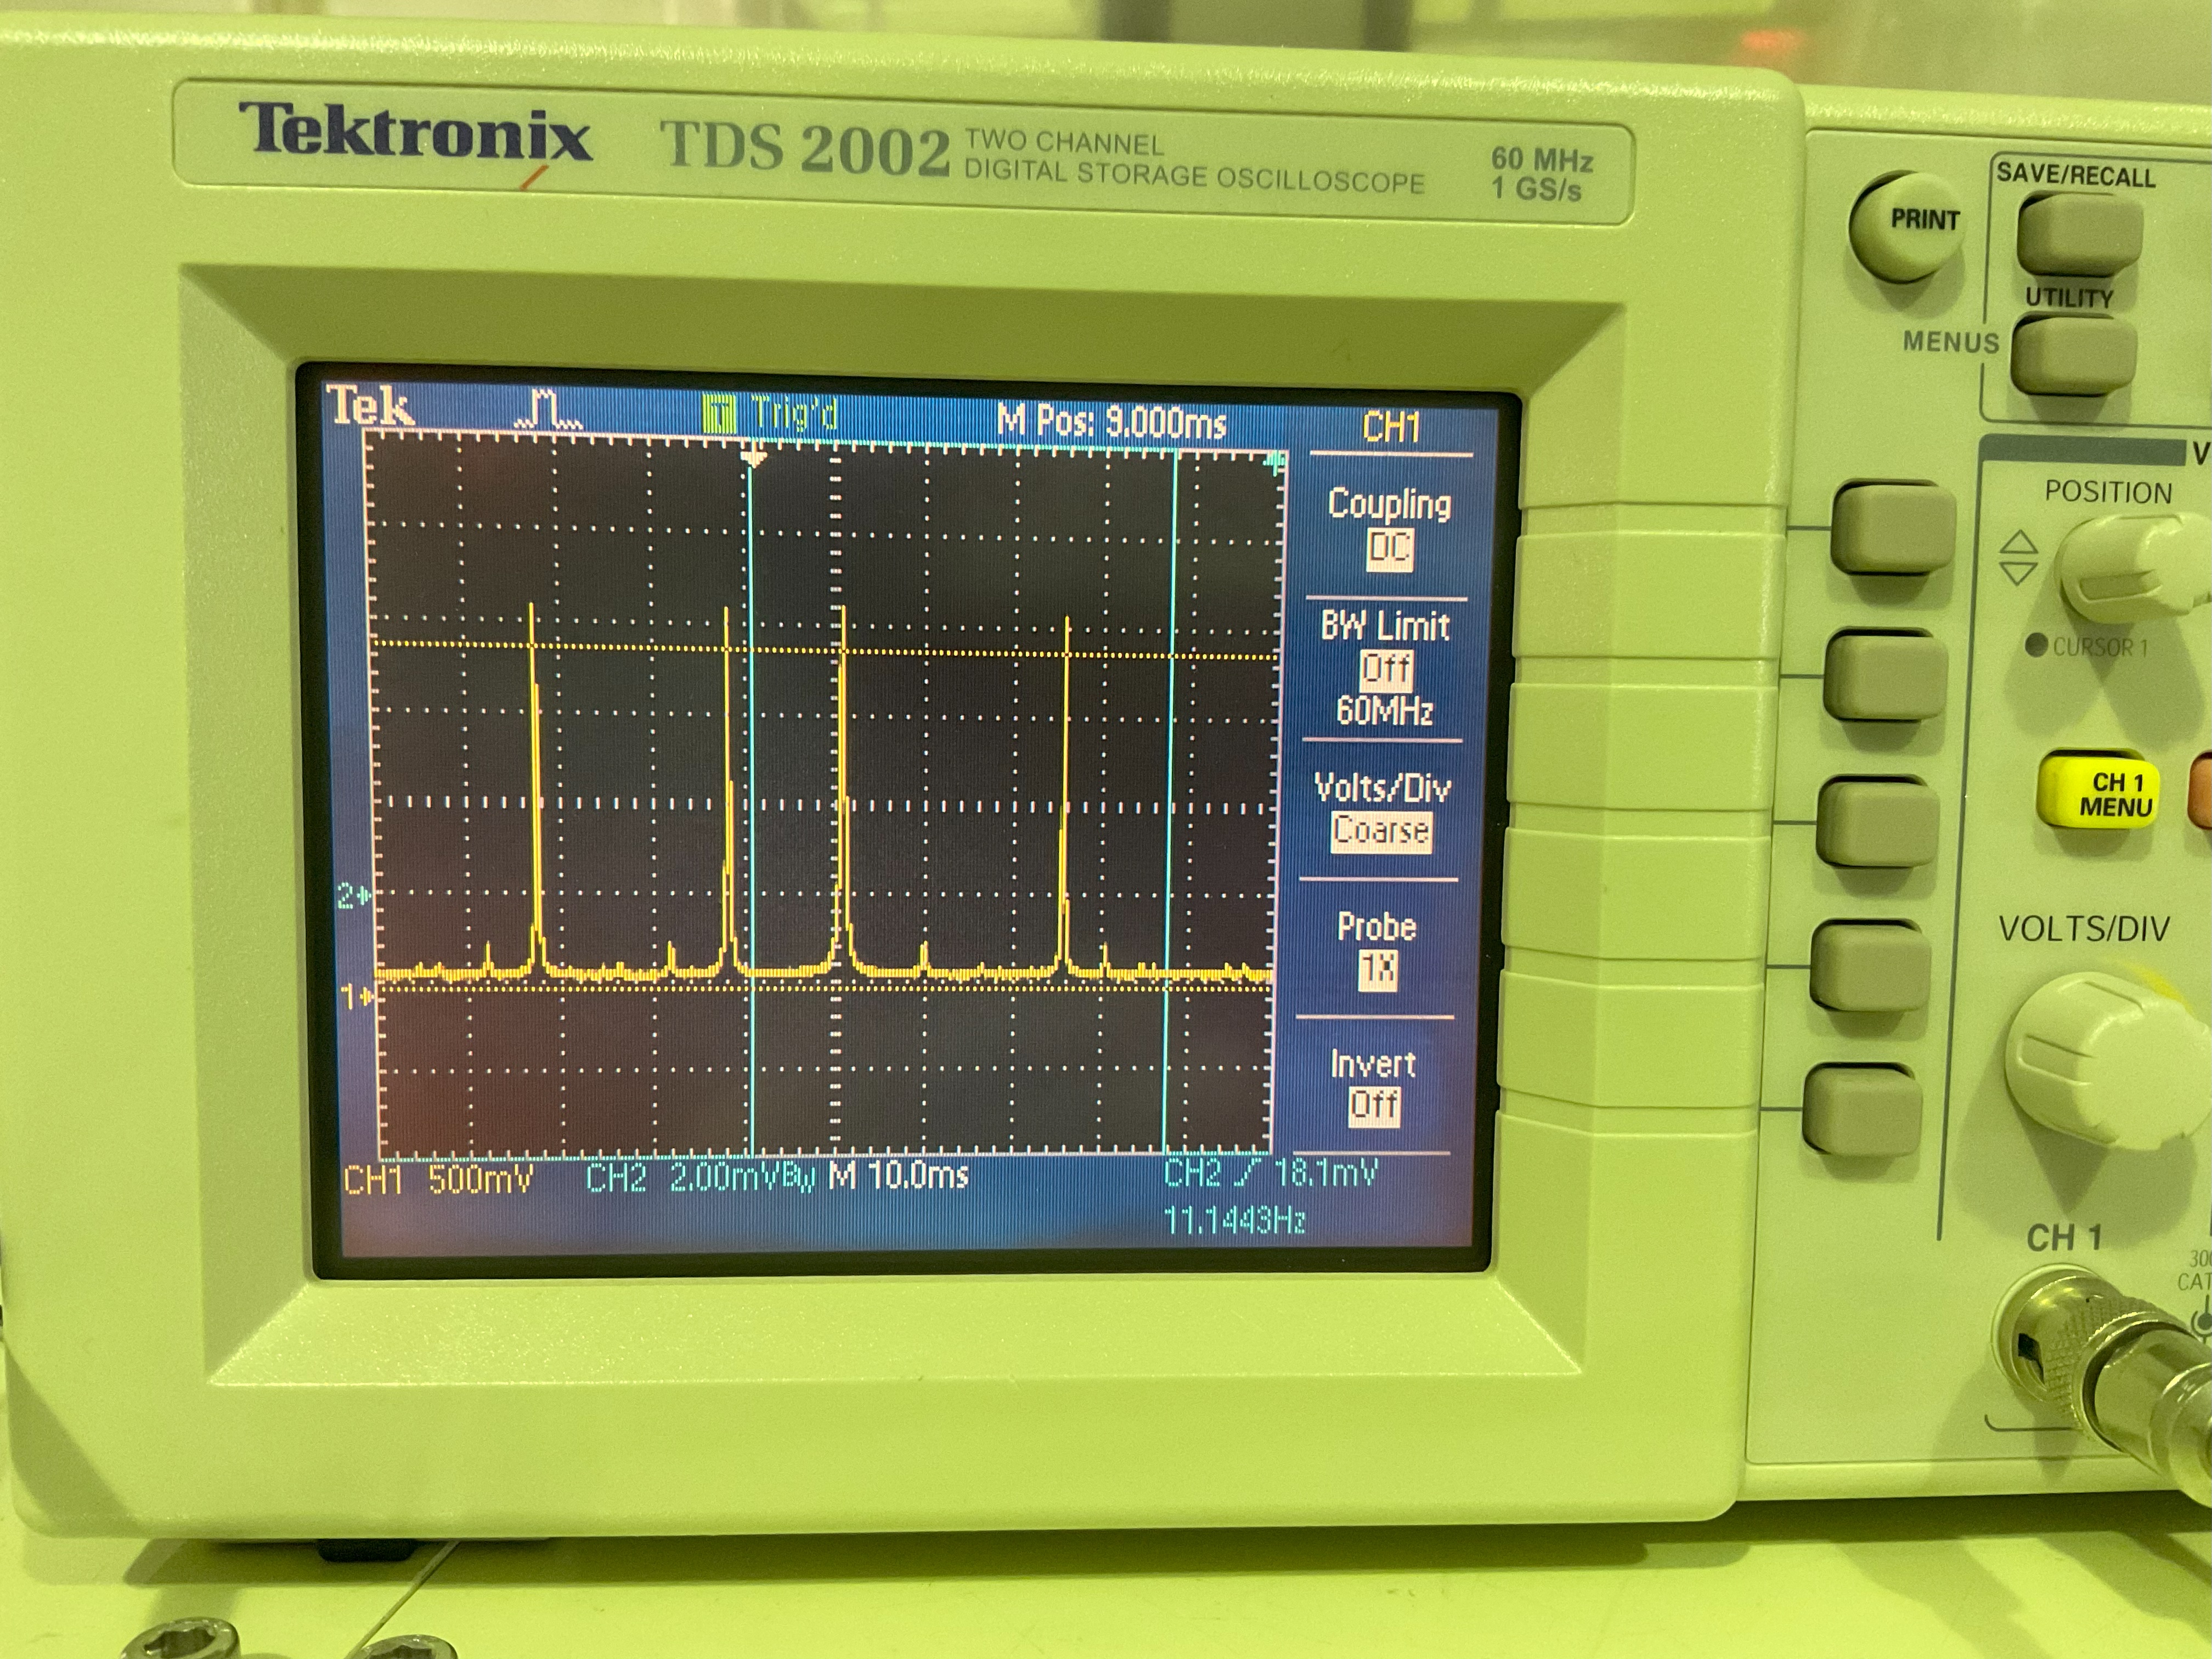
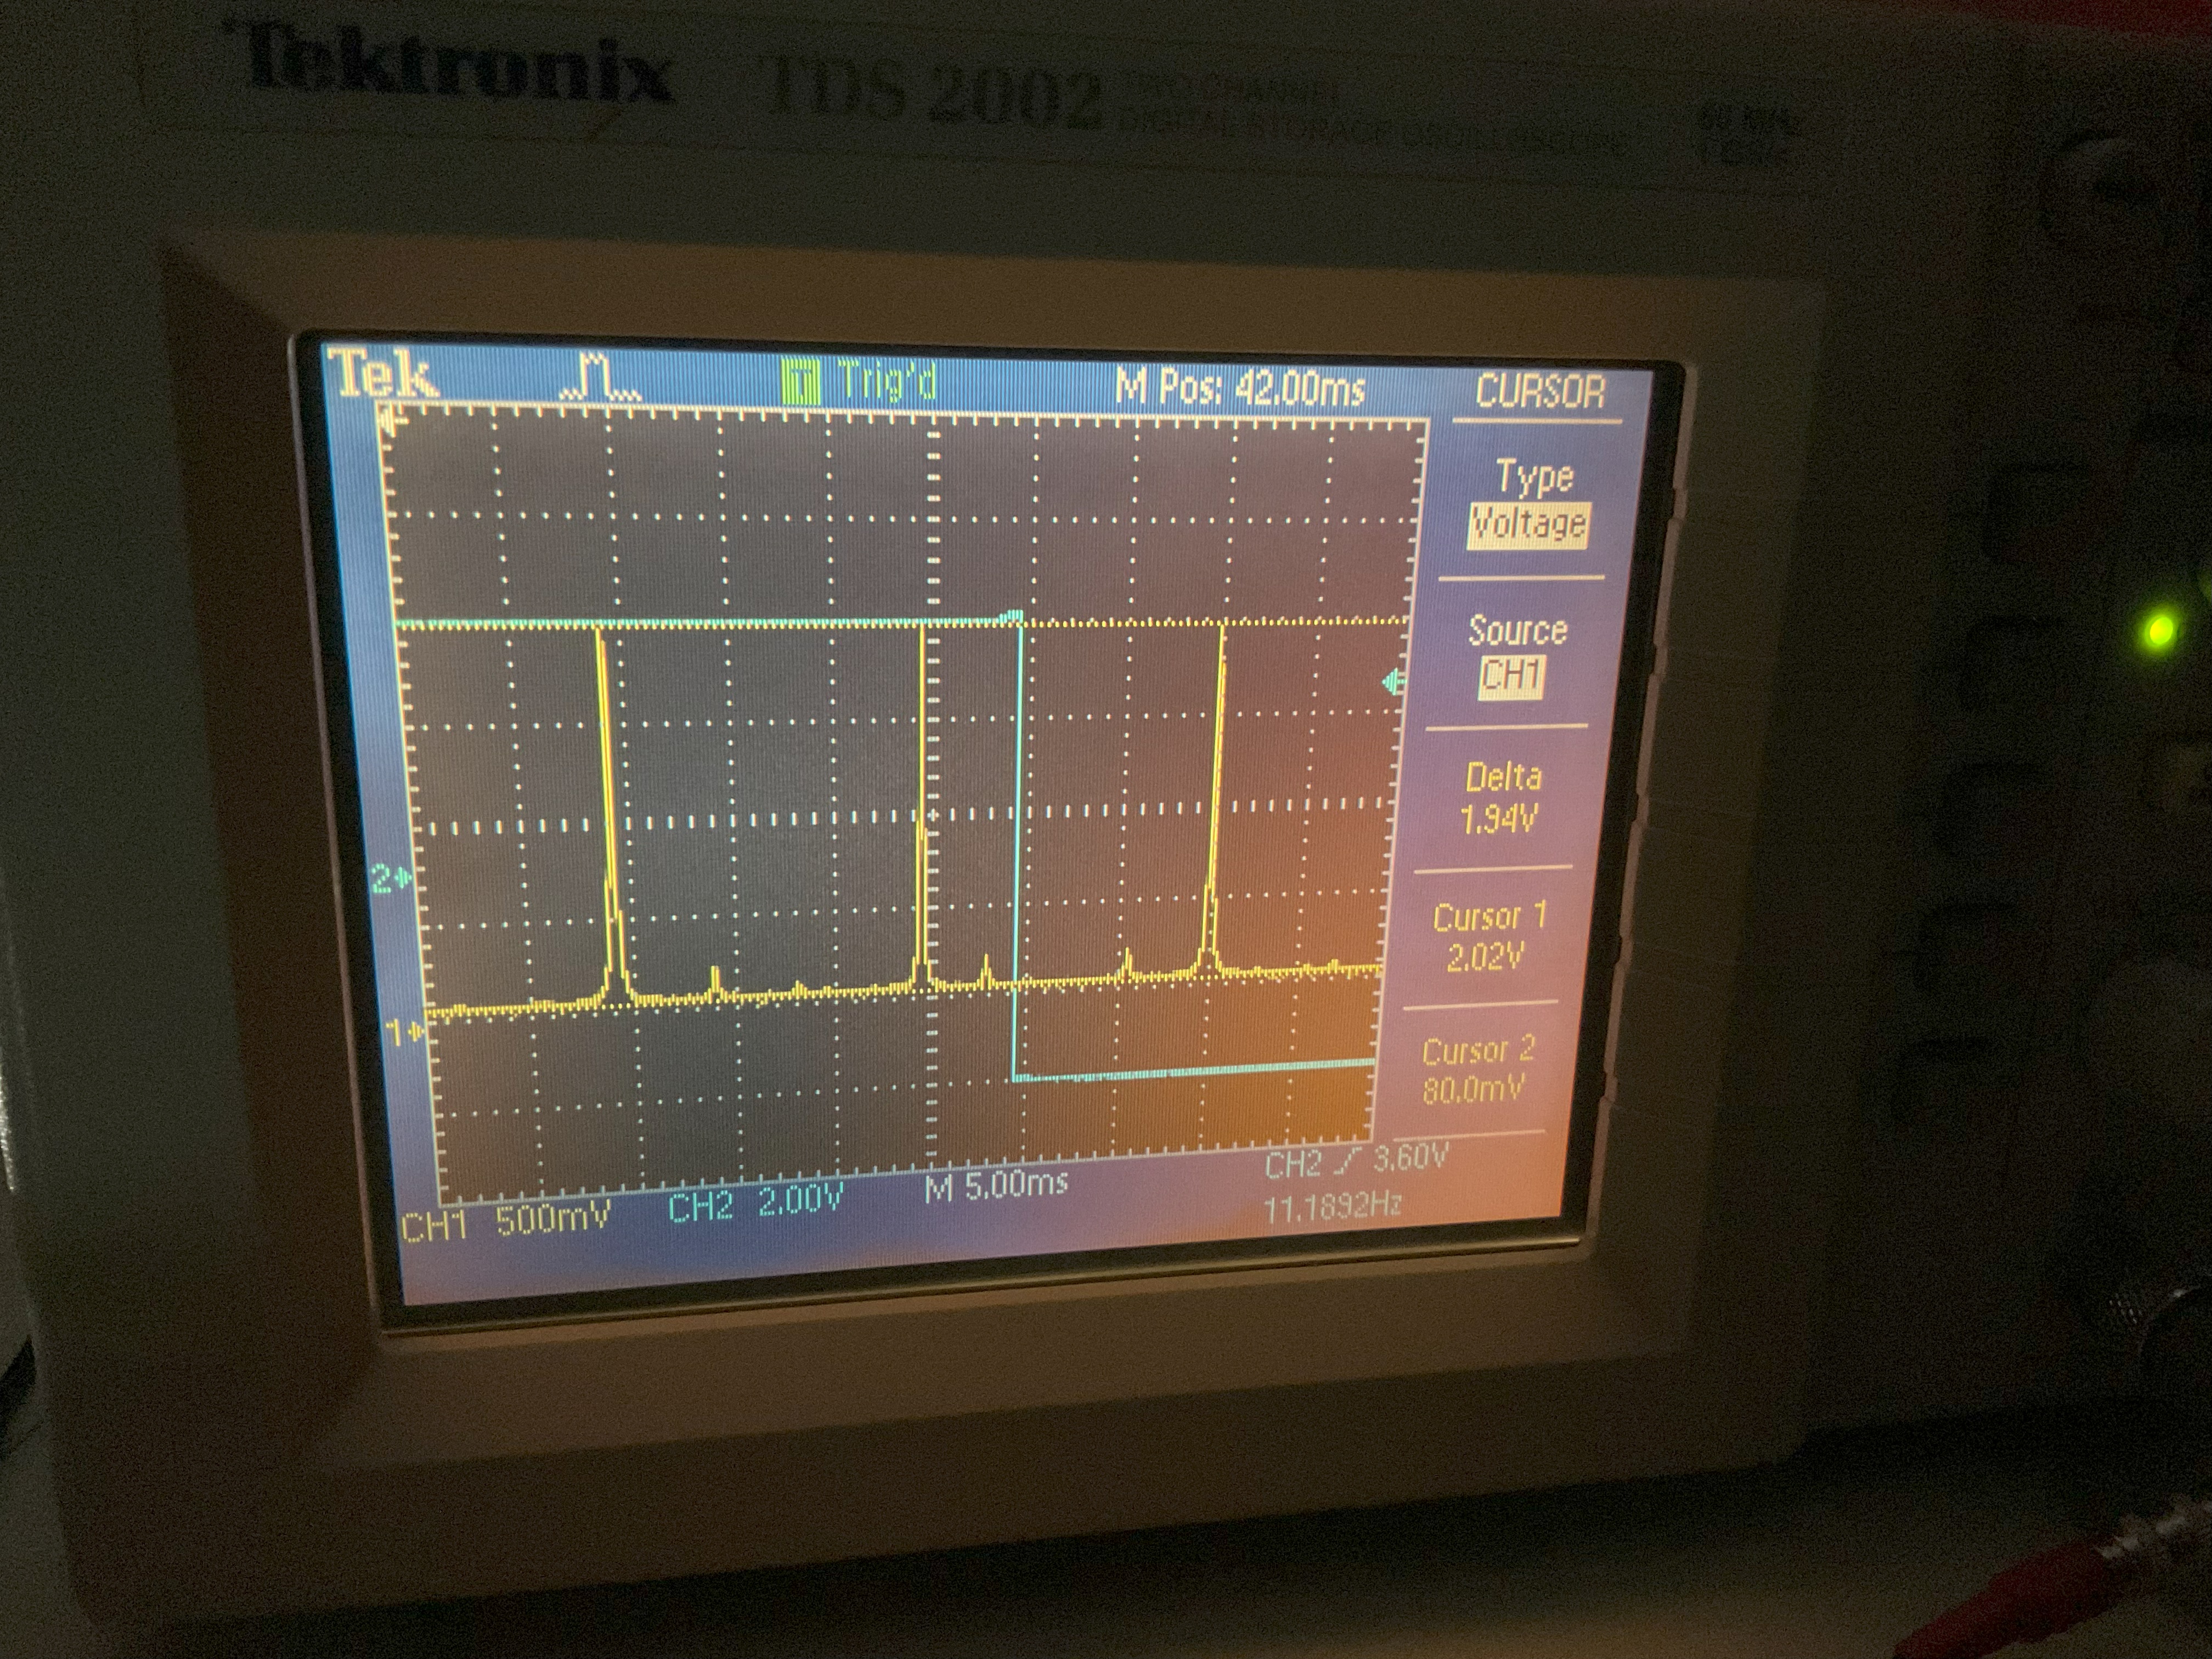
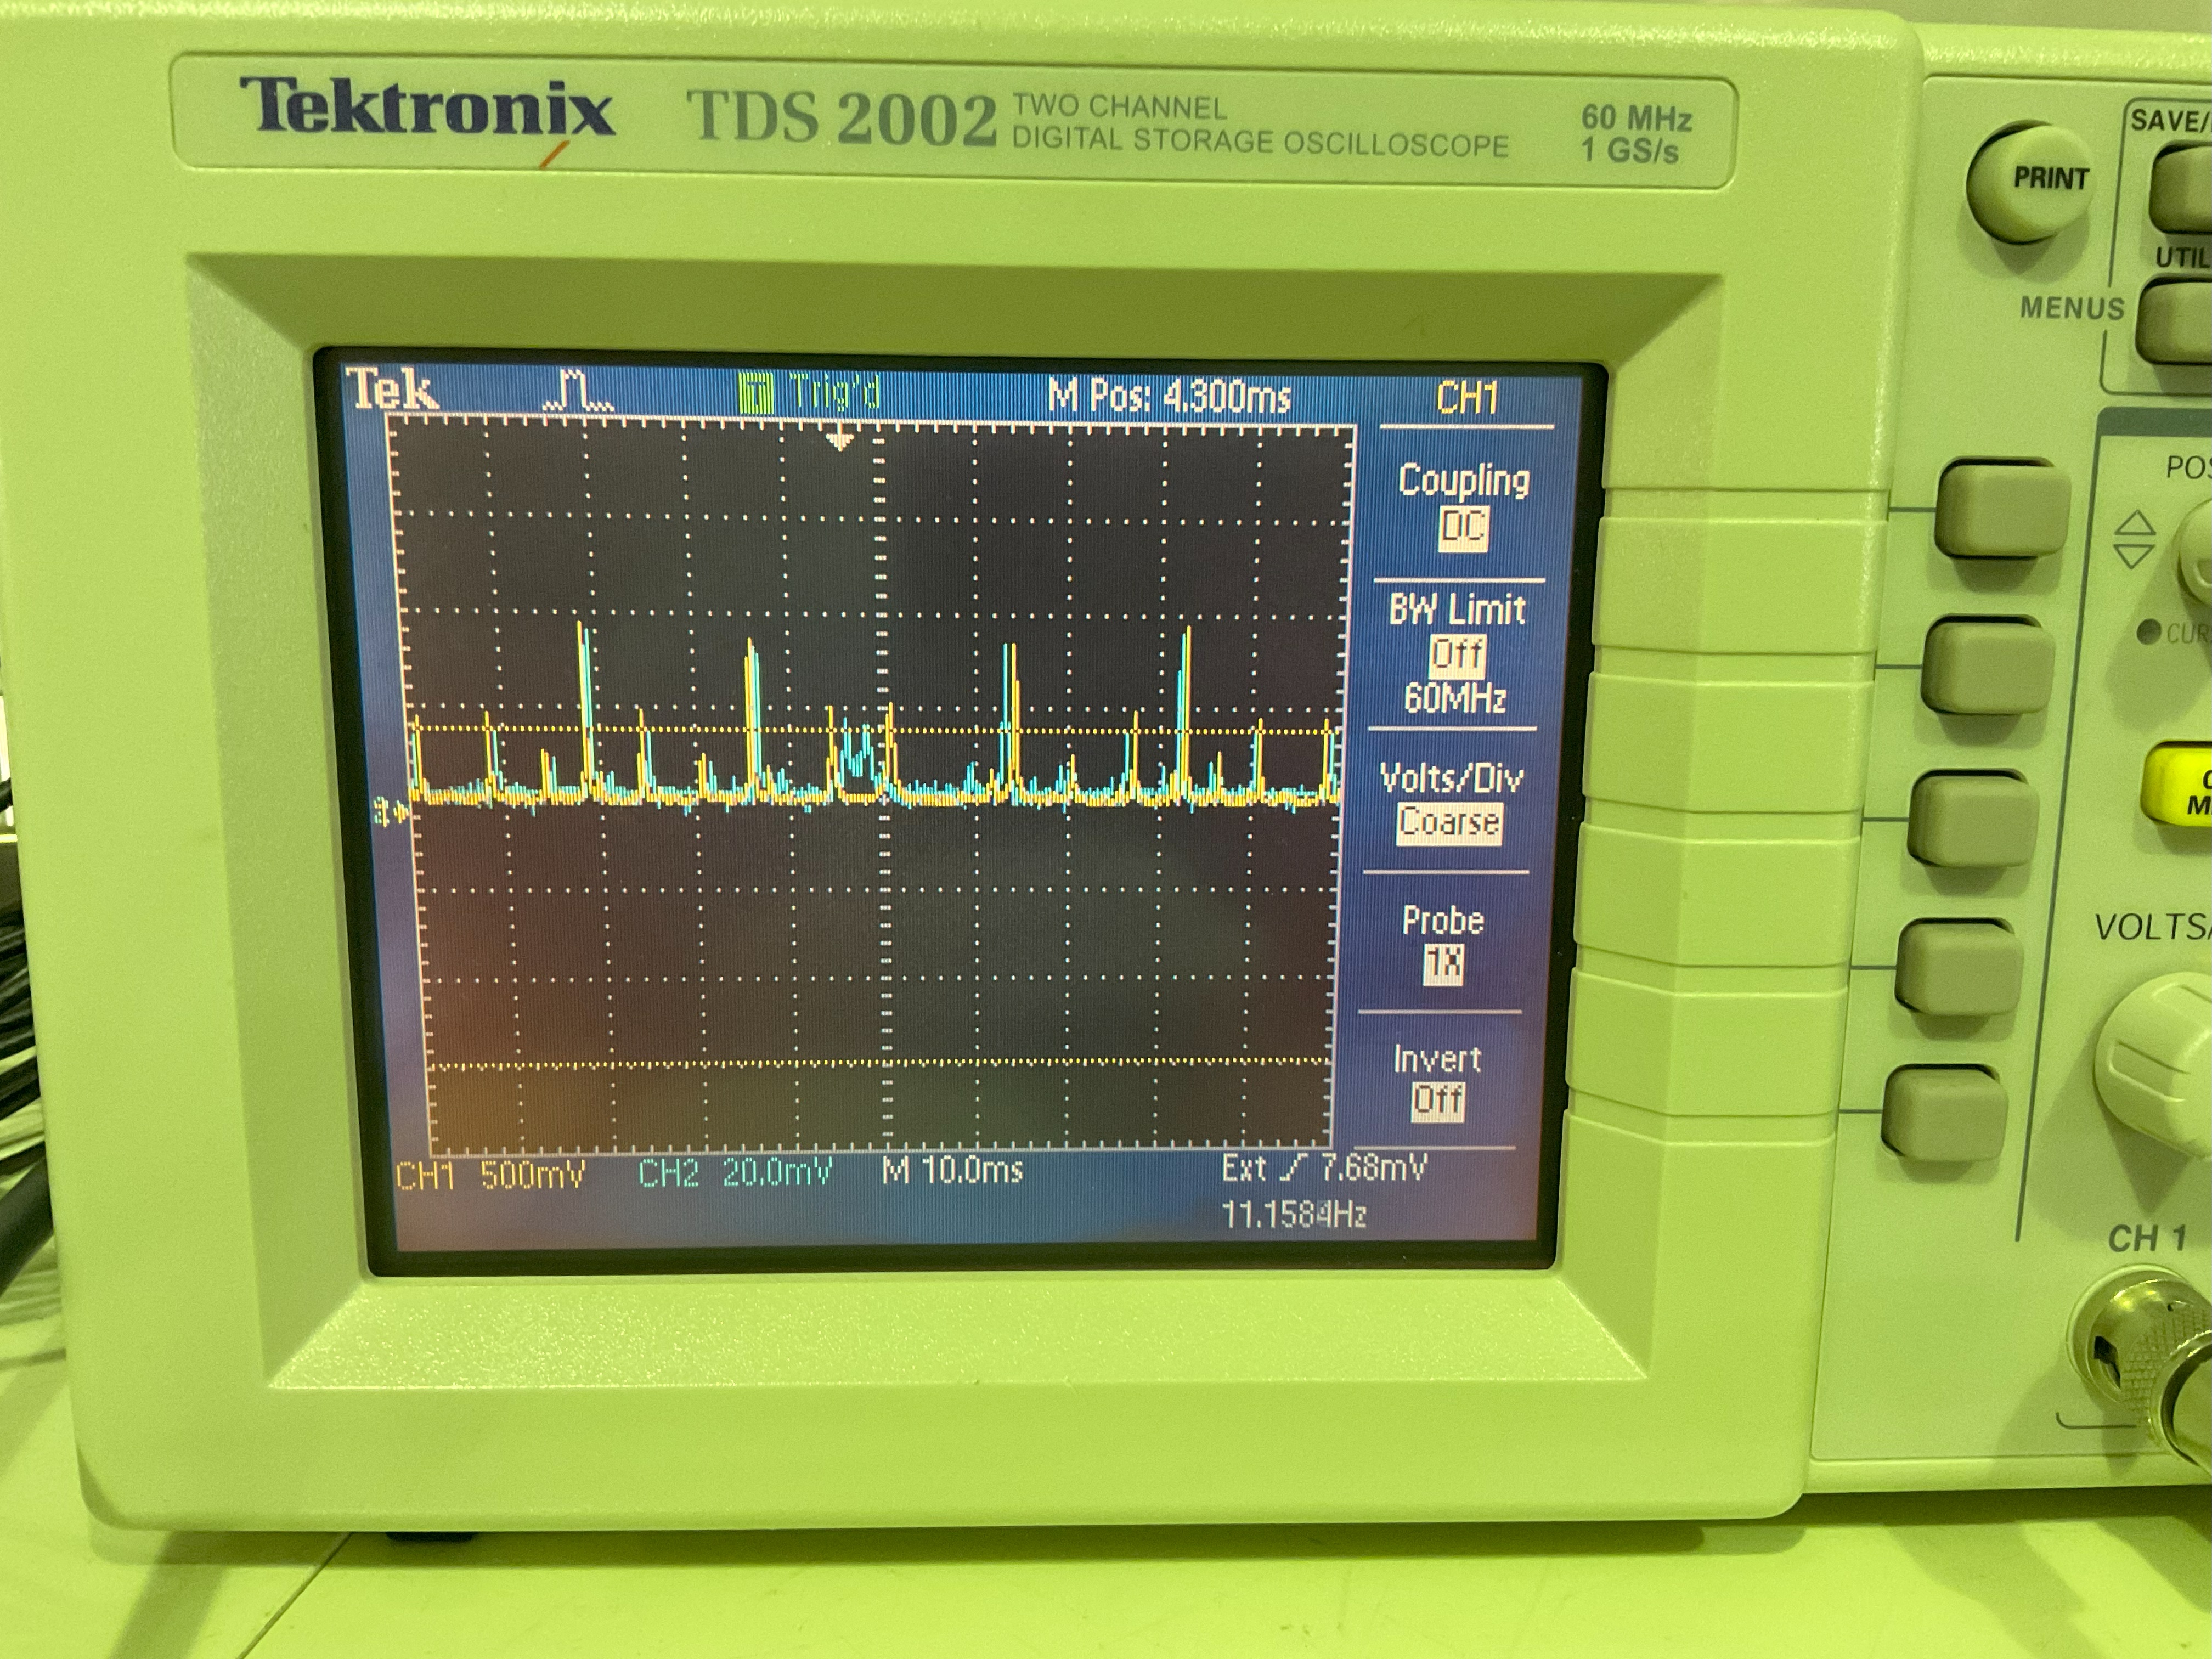
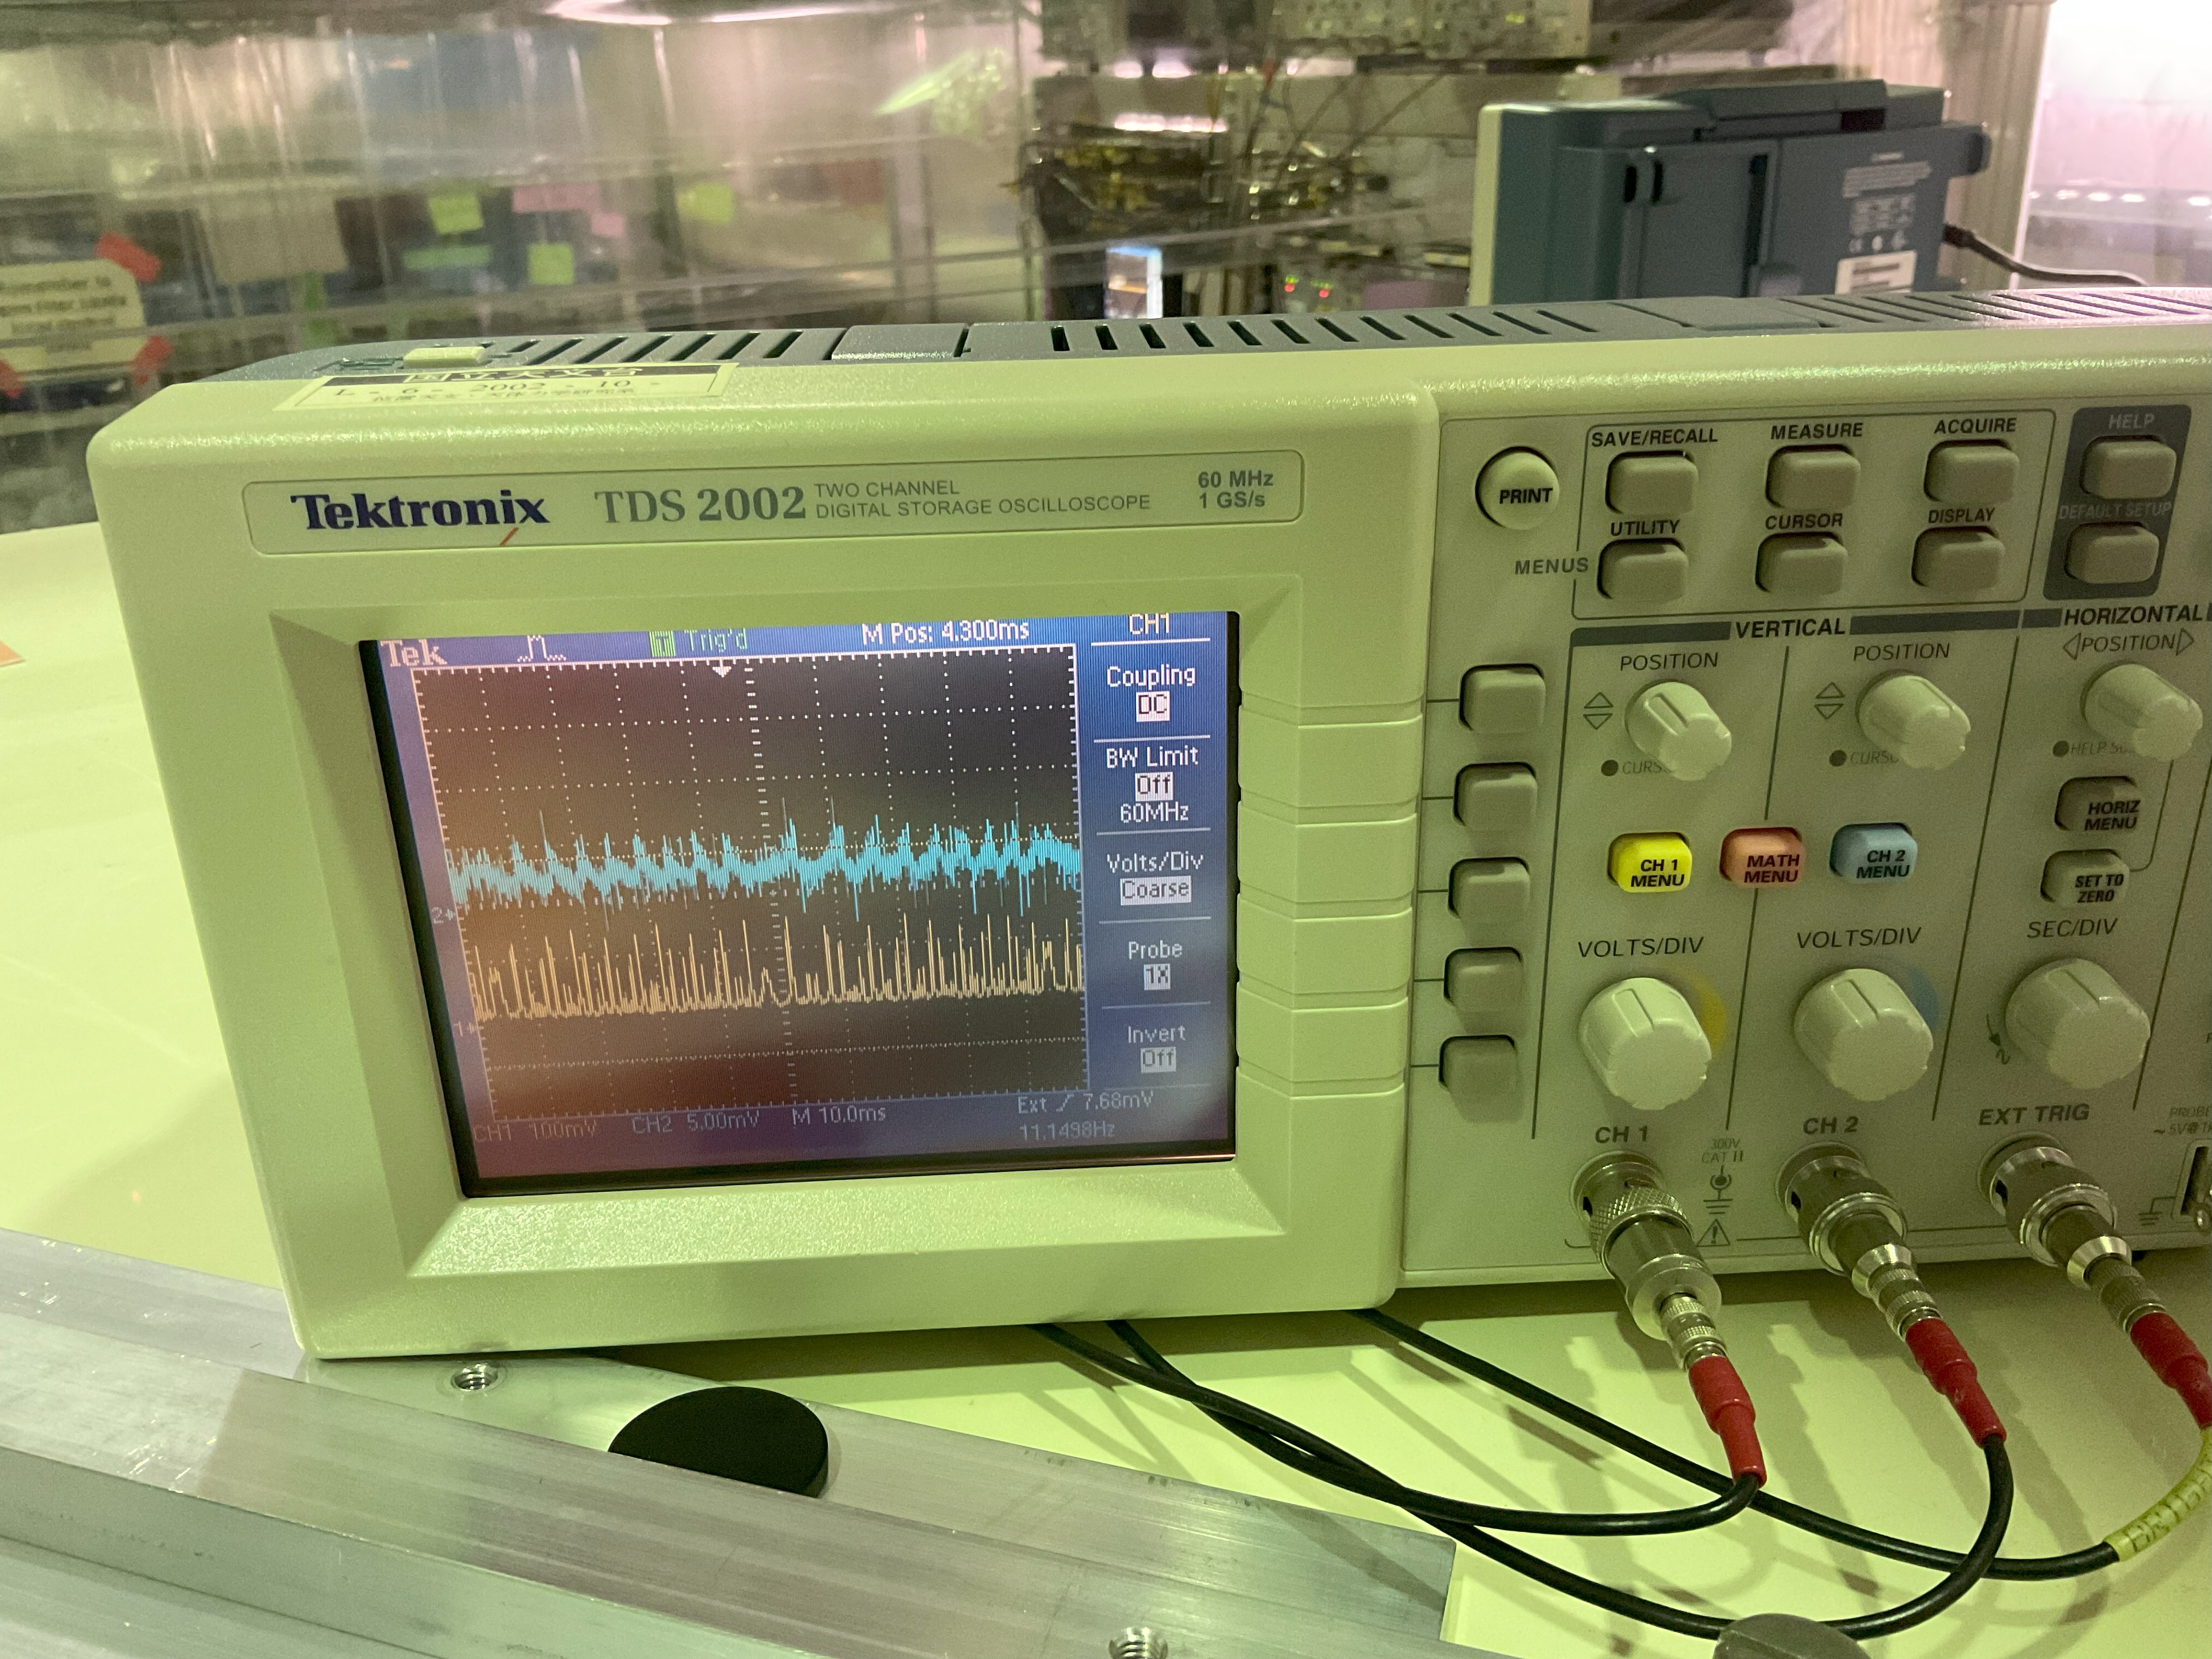
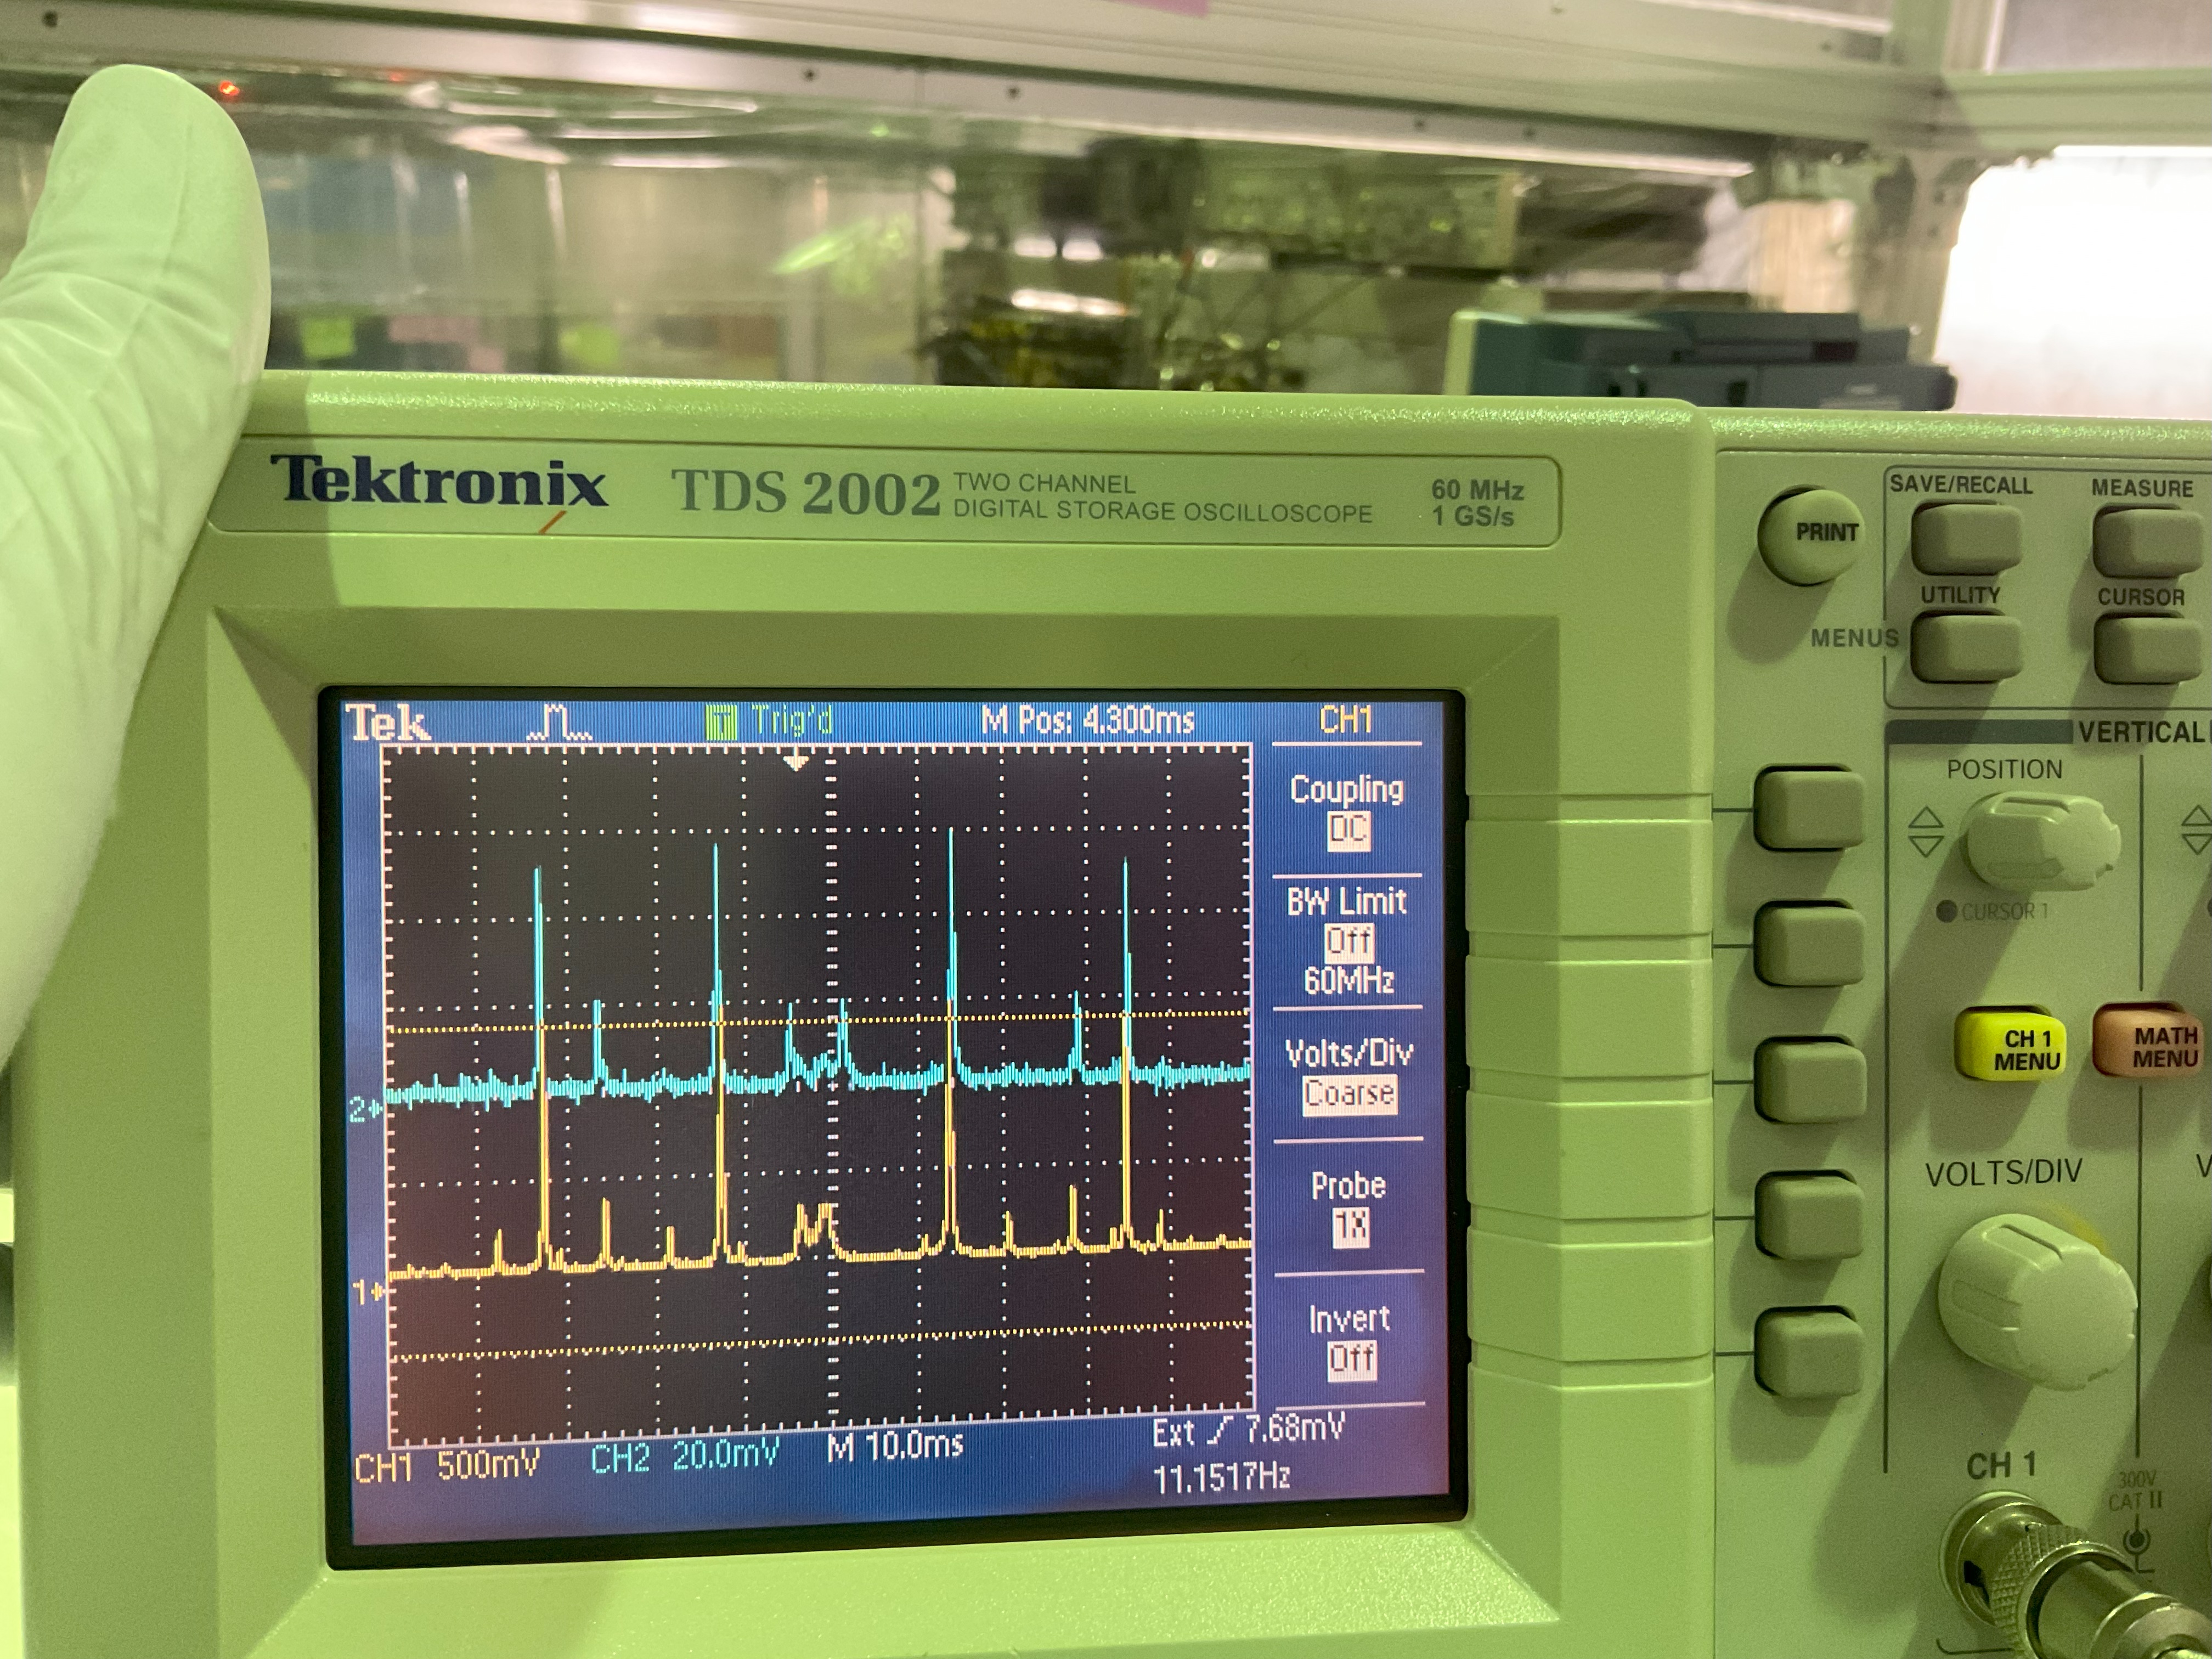
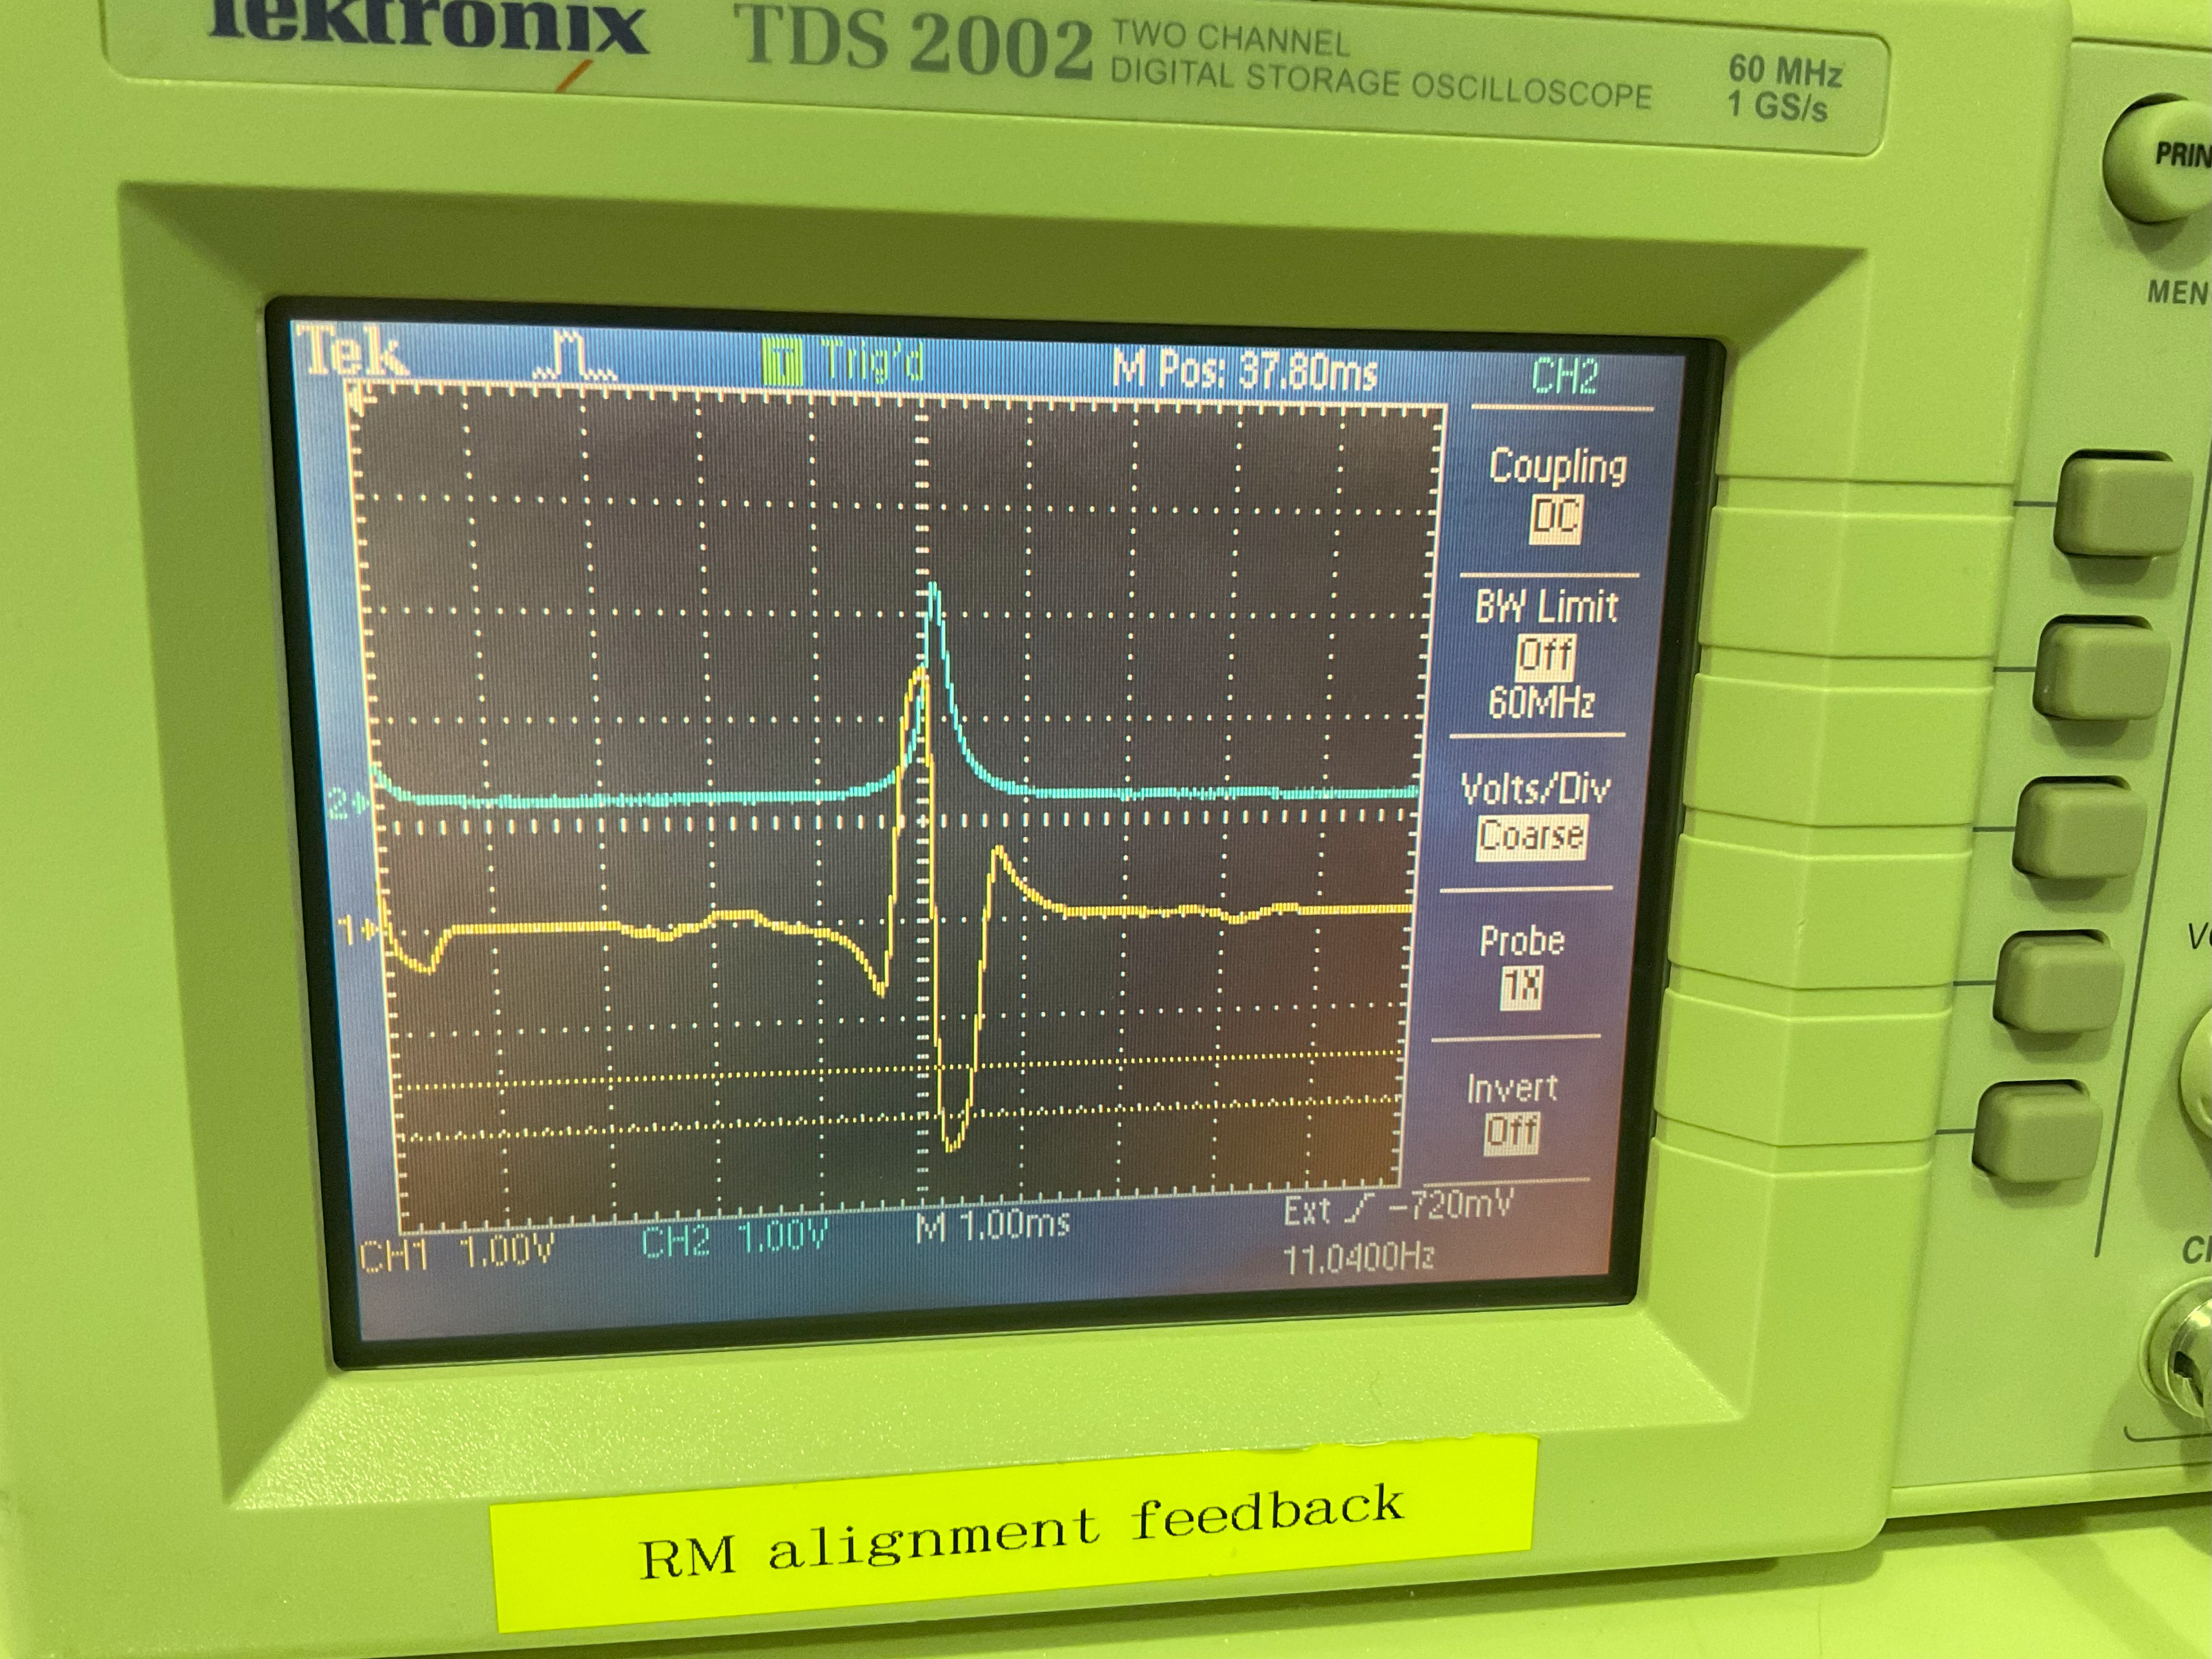
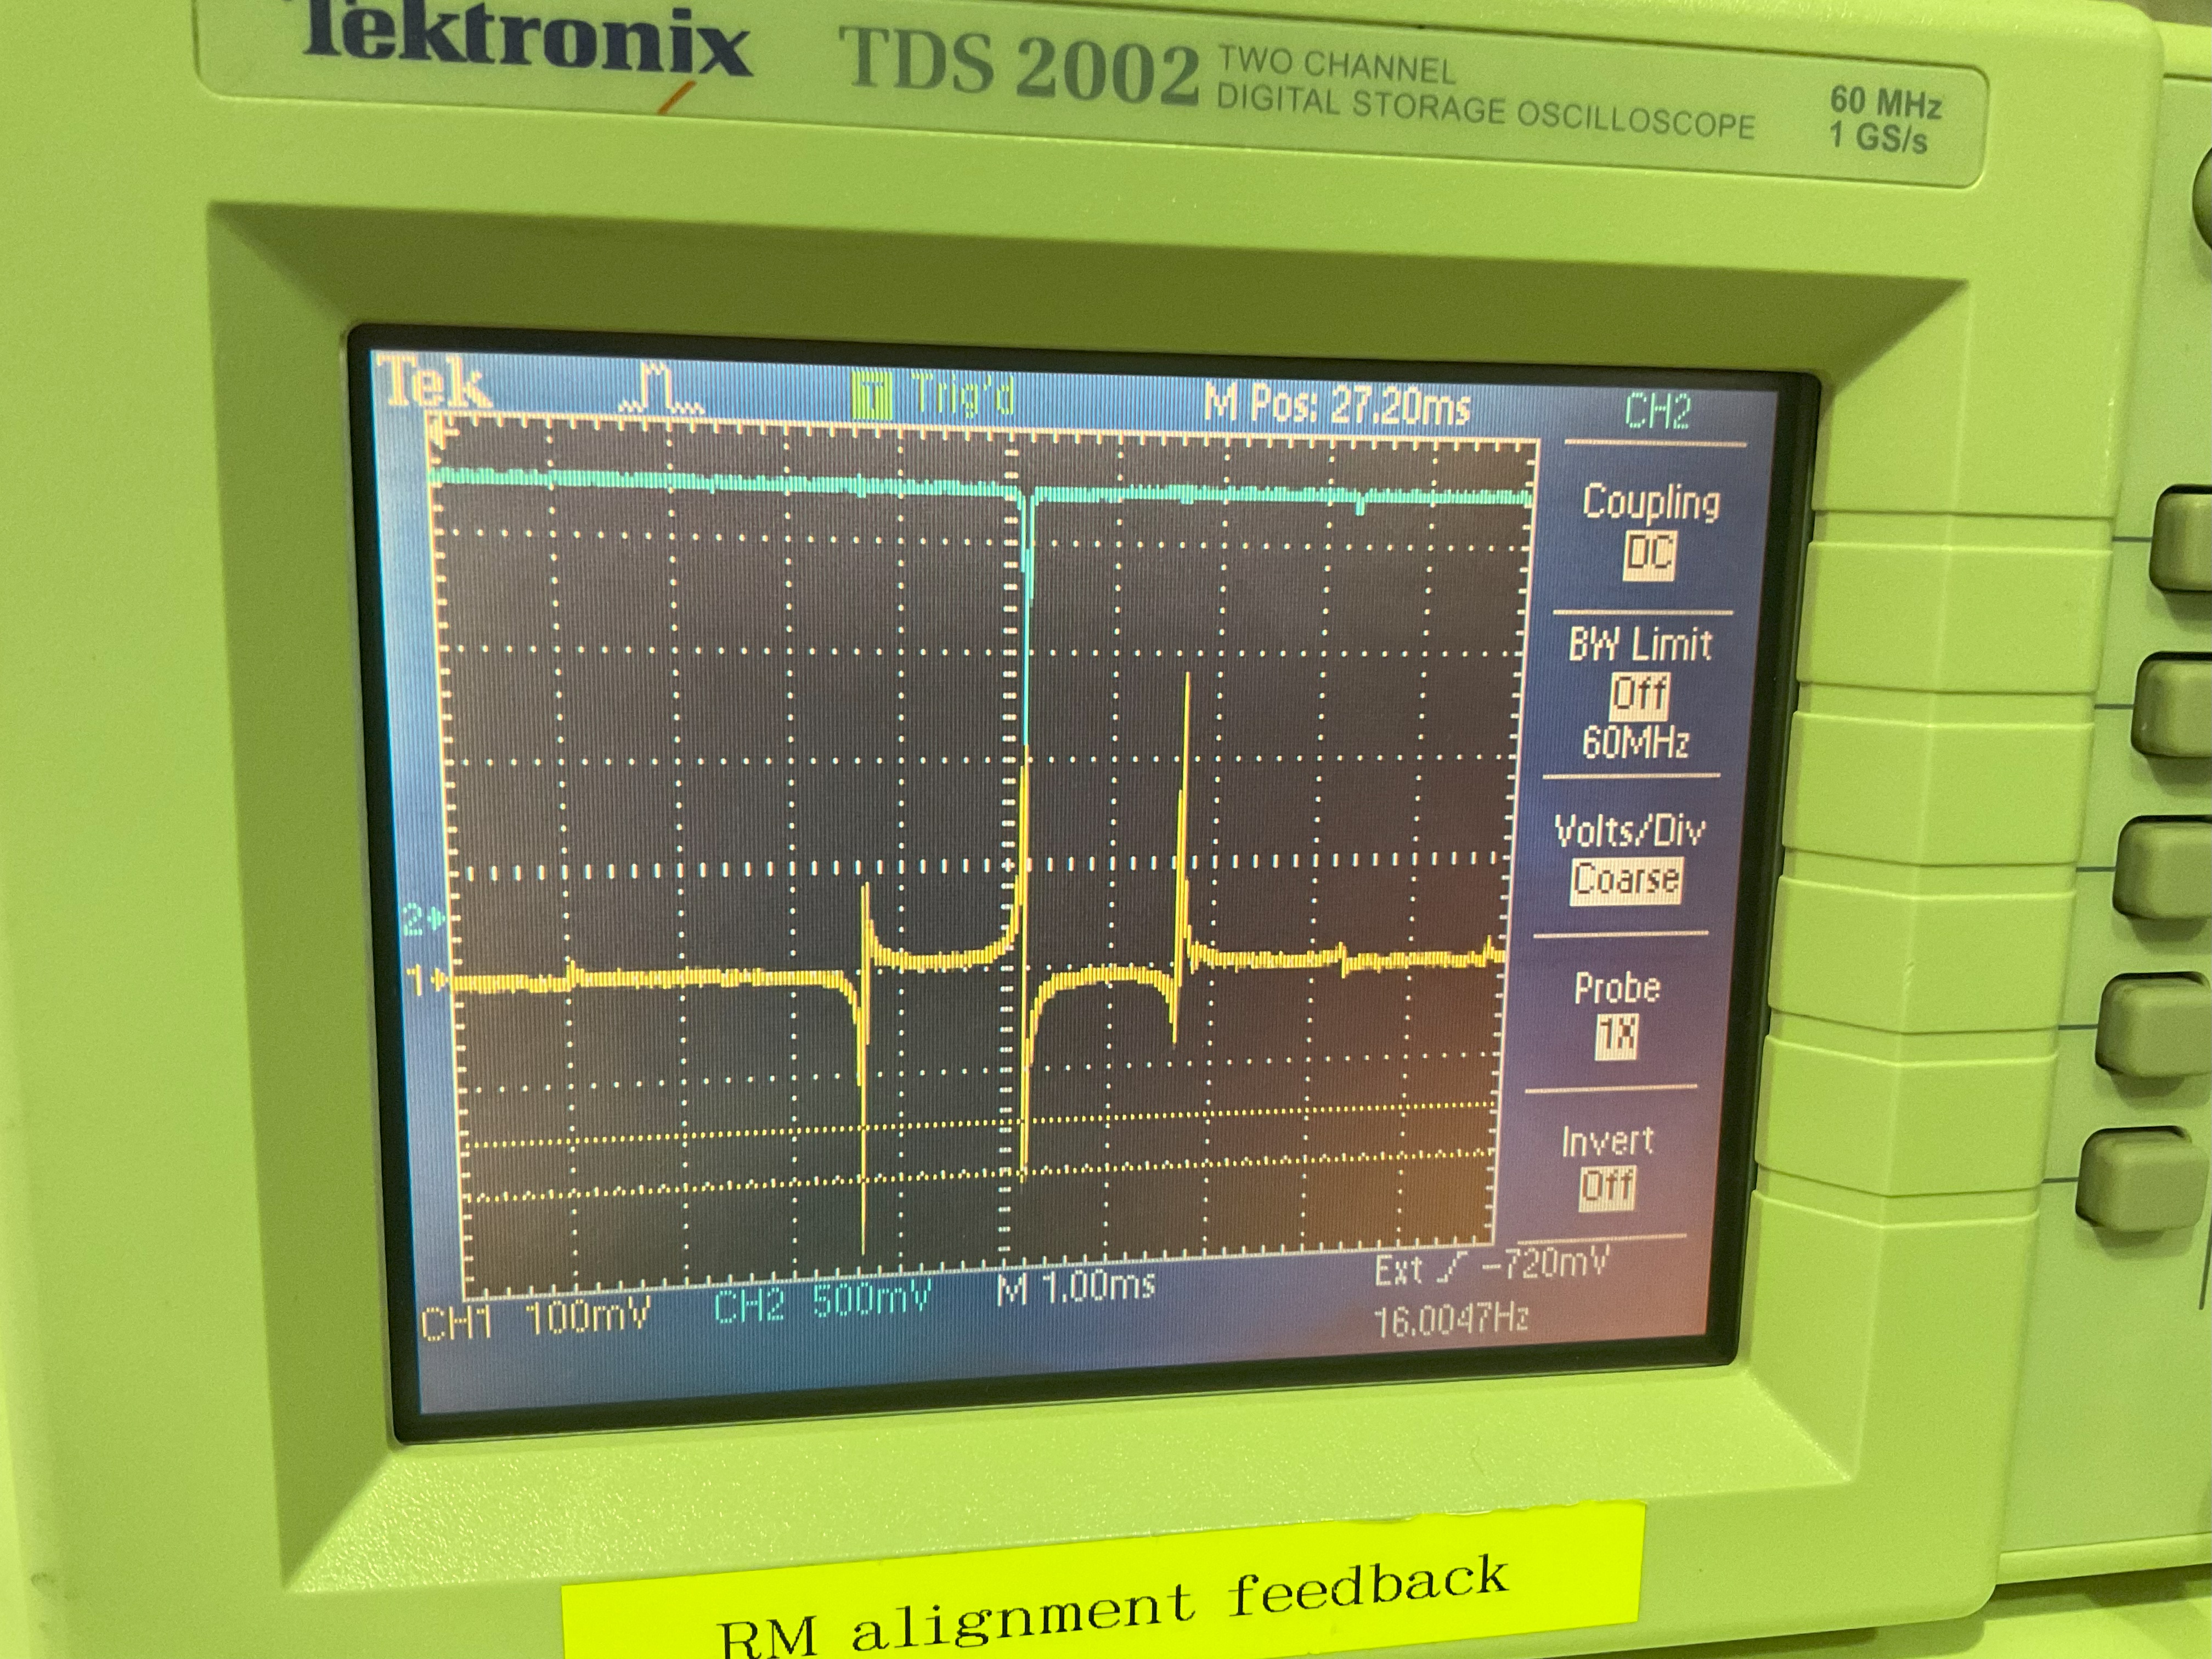
As detailed in elog 4013 the OPO became suddenly misaligned to both ppol and BAB. I still have no idea of the cause. At the time I was producing nonlinear gain with ppol locked, which I could see in the error signal of CC1 and 2, and then while I was preparing to measure squeezing suddenly the OPO had completely misaligned. This is very strange considering the ppol alignment is usually quite stable (fig 1 April 2025, fig 2 November 2024 ppol to OPO alignments for reference). Overlapping the ppol and BAB transmission spectra showed that they had the same misalignment (fig 3 - the difference in the middle of the oscilloscope screen is just due to the PZT scan range not covering the full width of that particular peak) and by tapping stuff I could see that the OPO input mirror plate was the most likely culprit.
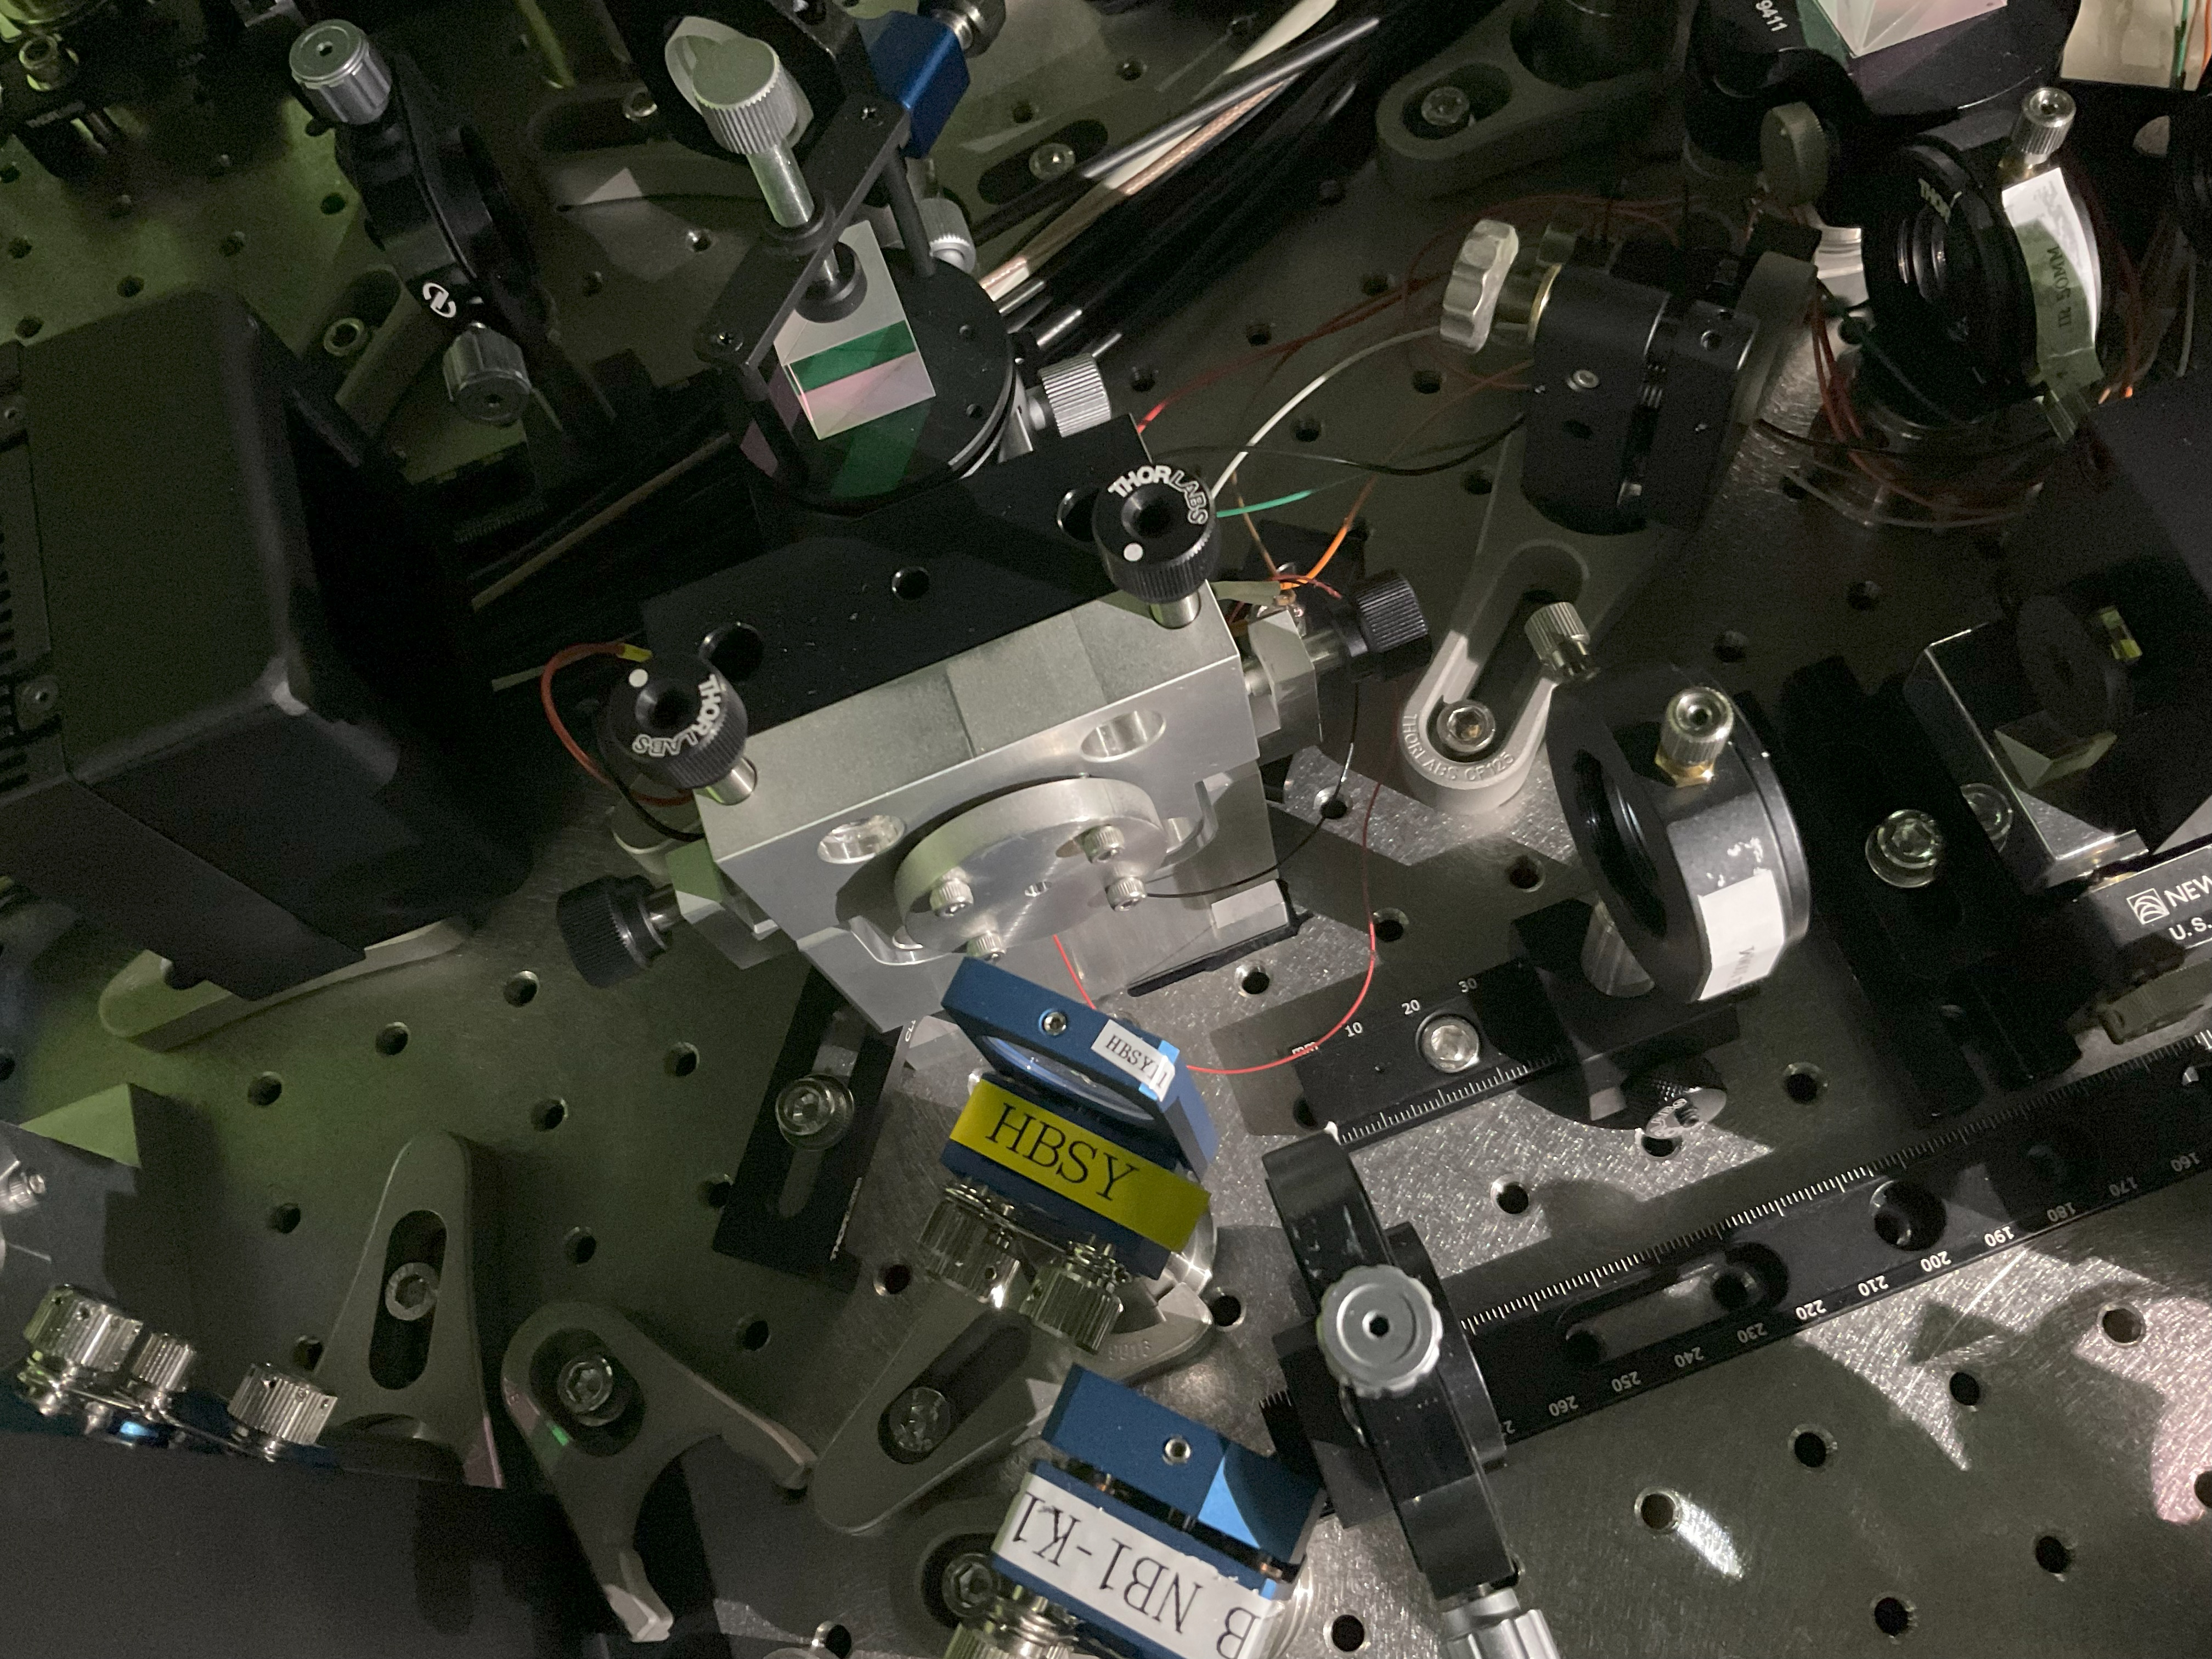
Between that post and now I had tried to adjust the screws on the input plate (fig 4) to see if that affects the alignment spectrum, but this had the effect of just moving the transmission mode peaks across the oscilloscope screen. Basically just scanning the cavity length. After that inconclusive endeavour I had to try more carefully, especially as the alignment was quite bad (fig 5)
Matteo's thesis gives an outline of the procedure to align a nonlinear cavity. First, the crystal must be internally aligned to a reference beam using targets, and then the input mirror (meniscus) must be moved perpendicular to the beam to find the place with the best transmission spectrum. Since I did not suspect the crystal to be misaligned, I tried just starting from the step of finding the good alignment of the input mirror. By loosening the screws holding the input plate and moving it I tried to find the good alignment (the input mirror is slightly loose under the input plate and can move very slightly in x and y). In doing this I could find a mirror position with very good mode matching, however, I found it to be hard to fasten the input plate while keeping the good mode matching. I could fasten the input plate to maybe 75% mode matching (fig 6). I could occasionally see the spectrum pass by the optimal condition (~ 90%) but I could not sufficiently fix the input mirror to this condition.
Eventually the transmission spectra for both beams disappeared. I was worried the PZT might have broken so I sent a few kHz signal to the PZT HVD. The PZT was whistling and the pitch changed when I changed the input frequency, so it's not broken. In the end I concluded that the beam to OPO crystal alignment may have messed up as well. The OPO case feels very tightly held to the table, yet I might have pressed something too hard anyway. It looks like I now have no choice but to do full realignment of either this OPO or the new one. I really hate that this had to happen when I felt like I was quite close to recovering stable FIS (> 30 min sqz) across all green pump powers (up to 60 mW), and the worst part is I still have no clue as to how the OPO suddenly misaligned in the first place.
In some other nonrelated events, it seems the SHG error signal disappeared at one point. However, this was because the cable connecting the power supply of the PDH PD was a bit loose (I had the same problem recently with one of the fiber PDs). I attached SHG, IRMC error signals (fig 7, 8) for 70 degrees phase in DDS1 DAC1 (IRMC/SHG DEMOD). I guess I have to find some short cables to change the IRMC electronic path length again.
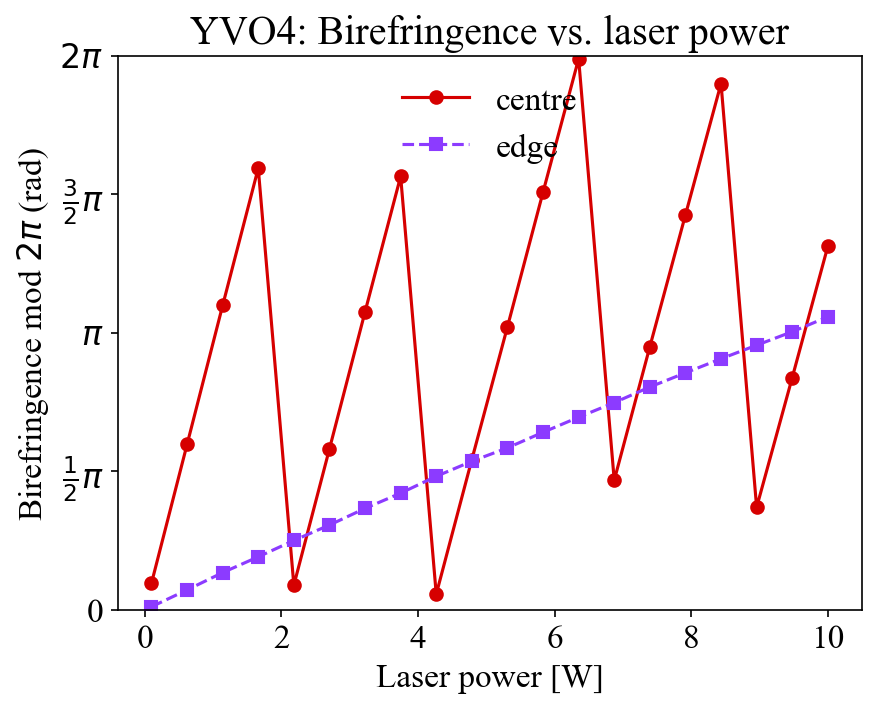
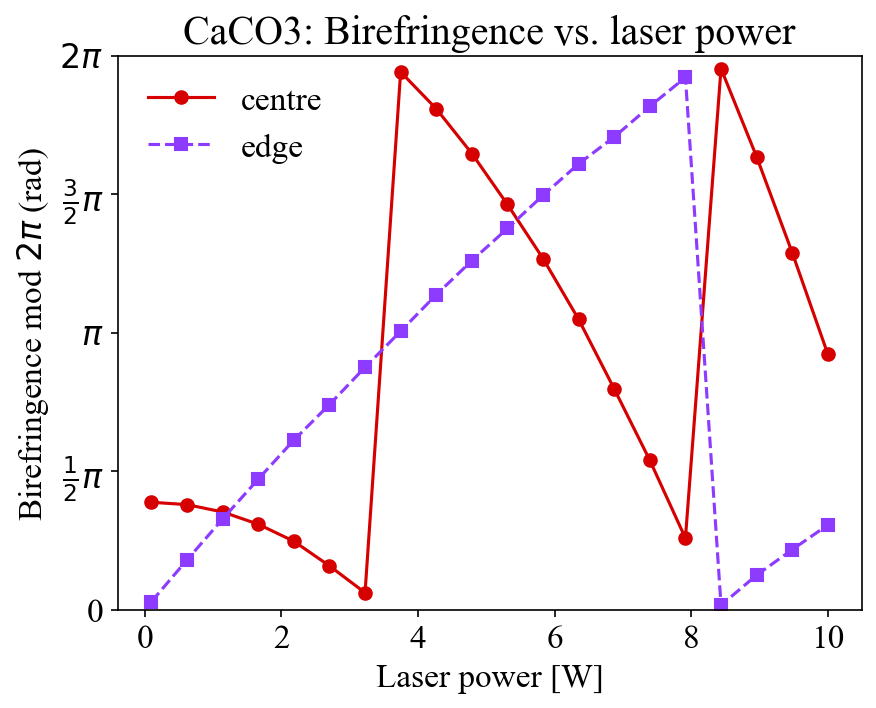
I did thermal simulation with different laser power for two materials to obtain thermal induced birefringence, for a 11 cm plate. The beam size was 5mm (radius) and the plate was heated for 2hrs, to reach thermal equiilibrium. You might see that the birefringence of entire plate increases with higher laser power, because the temperature rises consequently. I attach fig 1 and fig 2 corresponding to two different materials.
The plot has two data, one is birefringence at the center (where the laser is incident), second is at the edge of the plate. You can see that if we use too much CO2 power, we will be heating the plate so much that even if there is no laser, we will have a large retardation.
For now, I don't include the stress induced birefringence. The contribution is only from thermo-optic and expansion.
I switched the robocopy to NAS from PCI to BIGFOOT pc.
Let's see if it solves the issue.
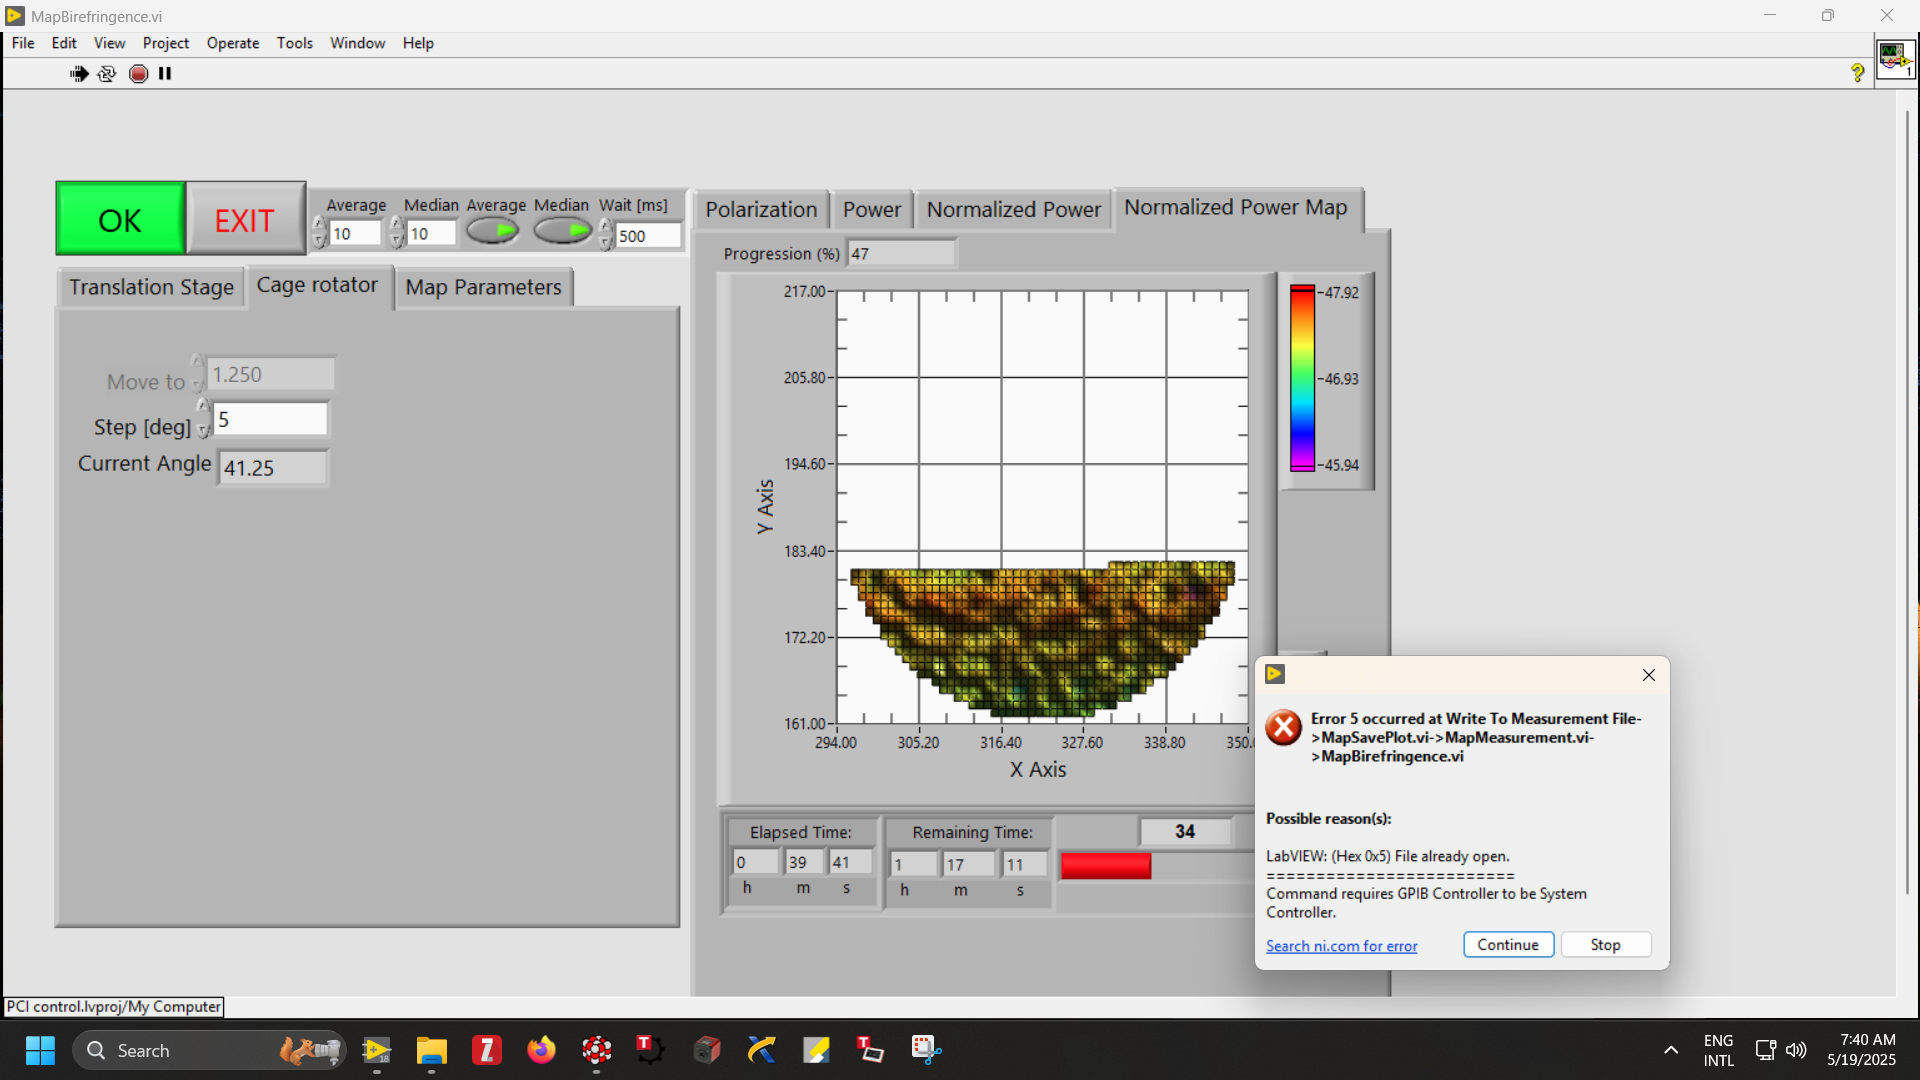
This measurement stopped by itself and labview threw error 5: same as elog 4026. The file was with rotation 26deg of rotator.
The error happened at the same time when the file gets updated to NAS. So, most likely it's happening because of the file being called somewhere else (NAS in this case). It will be better to stop NAS updating on PCI in this case.
I installed the software of camera ( provided under test period by company) on bigfoot pc. The camera is connected to voltage supply and via usb to PC.
I set up a cross polarizer setting with maximum power at output being 22uW and minimum being 2uW. I didn't check the minimum with a better power meter for now.
I insert a QWP in the middle, and then minimize the power on power meter. I then place the camera at the output, instead of the power meter.
The beam seen from the camera is shown in Pic 1. I used a calibration file XC-(11-12-2024)-HG-IWR-TrueNUC, provided by the company.
The file is saved in png format. I should check if other formats are possible.
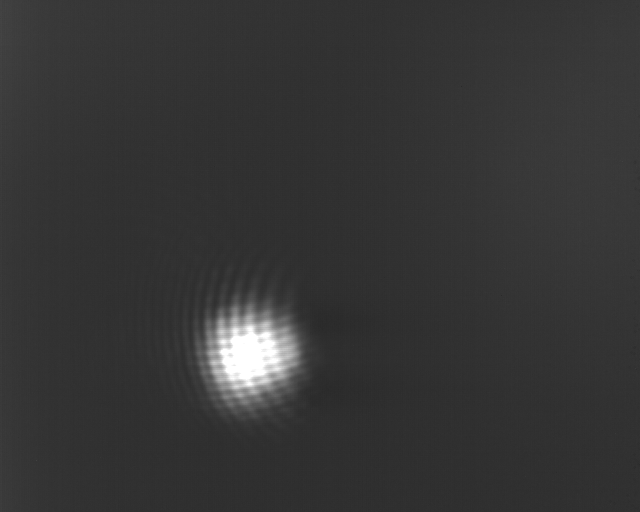
I rotated the sample. Pic 1 (before) and Pic 2(after). The measwurement was started with x,y = 322,189
folder D:\Dropbox\PCI\MapData\aztec_60_40_2_rotated\birefringence\
file ext: 20250521
This measurement stopped by itself and labview threw error 5: same as elog 4026. The file was with rotation 26deg of rotator.
The error happened at the same time when the file gets updated to NAS. So, most likely it's happening because of the file being called somewhere else (NAS in this case). It will be better to stop NAS updating on PCI in this case.
I switched the robocopy to NAS from PCI to BIGFOOT pc.
Let's see if it solves the issue.
I started a measurement of aztec60 40 2 rotated (same as previous one) yesterday afternoon that it is still on-going.
issue seems solved
First I eased a bit the Map BIrefringence vi.
Several tabs were present which was great for readability but some times made it hard to have all information at once.
I removed the aztec 60 40 1 from the translation stage. Note that some arrow marking were present from delivery. The sample was aligned so that the arrow is at the top facing the laser source.
After waiting about 1h for laser to stabilize, I've started measurement of aztec 60 40 2 with same parameters as aztec 60 40 1.
No marking were present so I made a white dot at the top towards the laser source.
Actually the reason to install the metallic mirrors was to remove the polarizer to avoid possible power discrepancy at different rotation angle.
The HWP is mounted inside the motorized rotator and provides good azimuth coverage with only minimal ellipticity (~<1 deg)
The 'load_measurement' function does it automatically.
Otherwise, you can indeed load the filenames by hand as we did up to writing the 'load_measurement' function.
The safety light in tama has been turned off for safety patrol.
I understand the filenames are different. My question was not related to the file name. But, rather to the folder in which we save. Now, we are saving all files in same folder. When we specify in the birefringence script that use all the files in the folder, we will end up using data from different times. So, at the end we will have to write the names of the files with hand?
'Also, if all the files are being saved wth old data, how do we differentiate them?' : all files have different names, I'm nto sure to see the issue
turned off laser for safety visit.
Might be worth to understand issue before restarting measurement
For now, I restared measurement with polarizer position, 41.25 and map count as 9
Measurement has error and has stopped. See pic for error.
This error is unusual, because it seems there is some issue with the code during writing the data.
Should I restart measurement?
Also, if all the files are being saved wth old data, how do we differentiate them?
Some measurement where on-going but the input polarization check was with a quite small area (2*2mm), the power a bit large(? at 6.5mW) but more importantly after 17h it was only at 20% of the measurement duration.
I reduced the laser current to 1A, increased the input polarization area to 5*5mm, changed the sample measurement to circular area at the sample center (x=322,y=189) and reduced measurement radius to 28mm.
the y position for input polarisation check was changed from 90 to 140 to reduce travel time.
Also, the data are now saved in the correct folder (aztec_60_40_1/birefringence)
Measurement has error and has stopped. See pic for error.
This error is unusual, because it seems there is some issue with the code during writing the data.
Should I restart measurement?
Also, if all the files are being saved wth old data, how do we differentiate them?
For now, I restared measurement with polarizer position, 41.25 and map count as 9
turned off laser for safety visit.
Might be worth to understand issue before restarting measurement
'Also, if all the files are being saved wth old data, how do we differentiate them?' : all files have different names, I'm nto sure to see the issue
I understand the filenames are different. My question was not related to the file name. But, rather to the folder in which we save. Now, we are saving all files in same folder. When we specify in the birefringence script that use all the files in the folder, we will end up using data from different times. So, at the end we will have to write the names of the files with hand?
The 'load_measurement' function does it automatically.
Otherwise, you can indeed load the filenames by hand as we did up to writing the 'load_measurement' function.
After moving the mirrors, I had to realign the beam. The alignment was tuned to obtain horizontal and vertical to be within 0.027deg and -0.016deg. See the plot 1 and 2 showing the horizontal and vertical alignment.
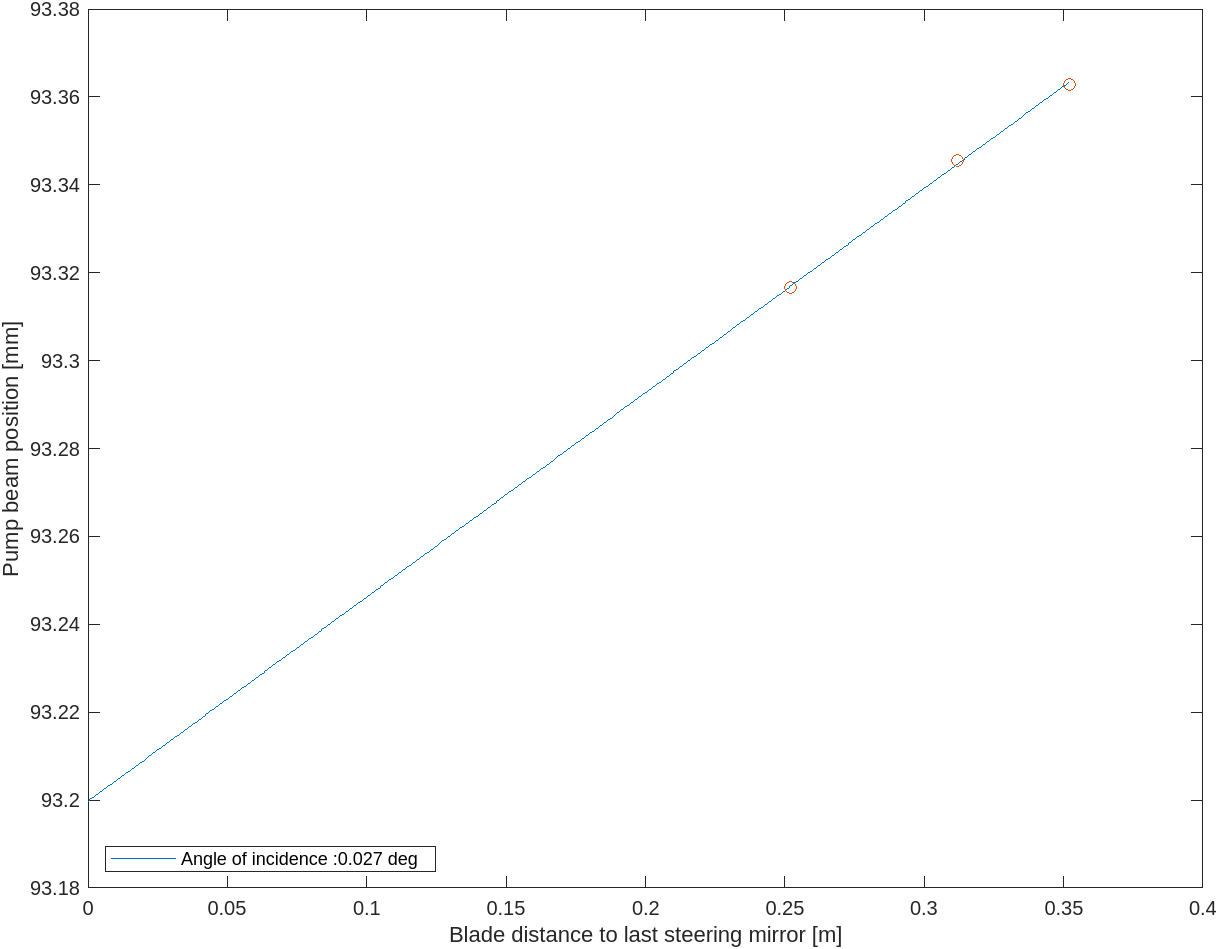
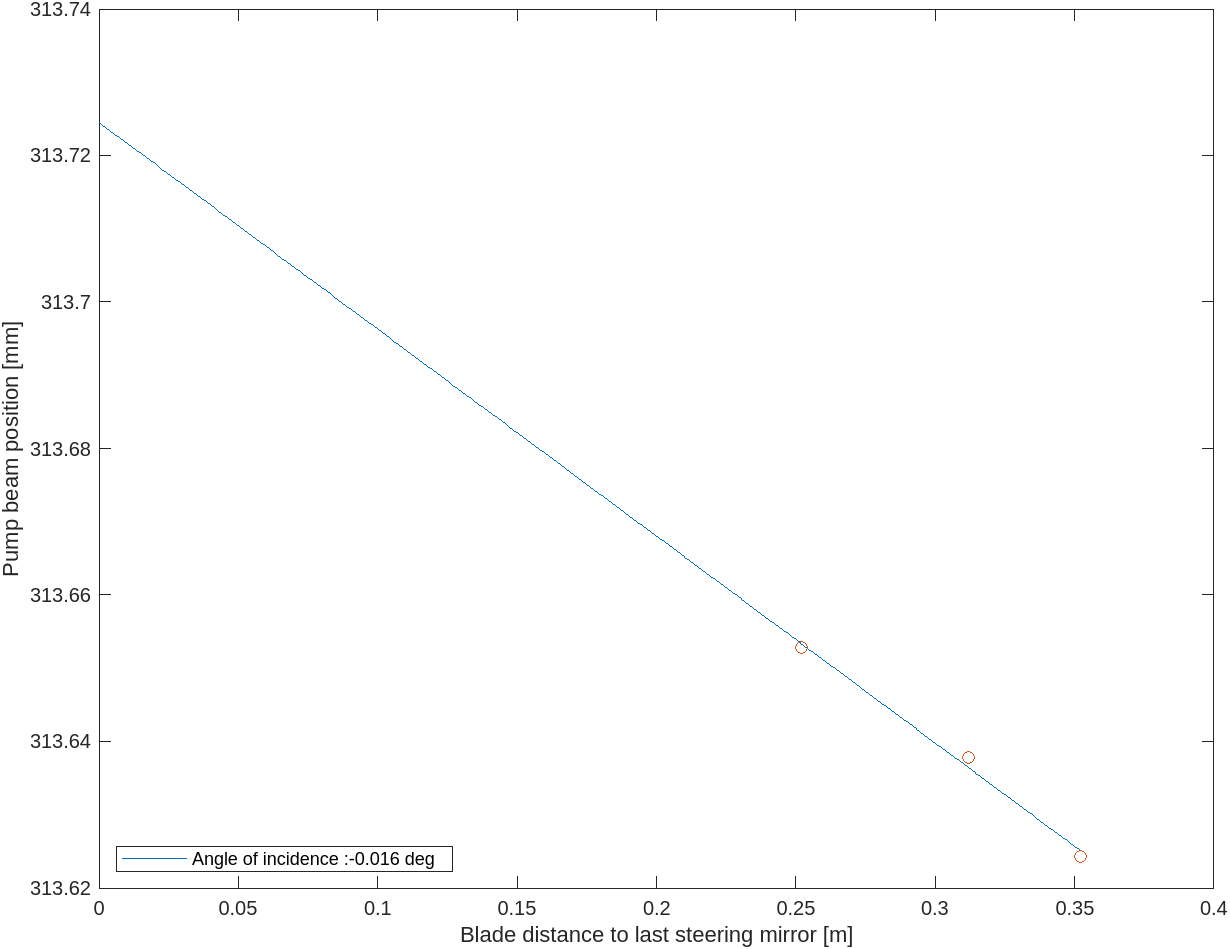
A certain discontinuity is visible, which most likely is a feature from the setup and not the sample. The current changes 4022 are attempt to get rid of them, by having more polarization generated, and hence more measurements can be taken.
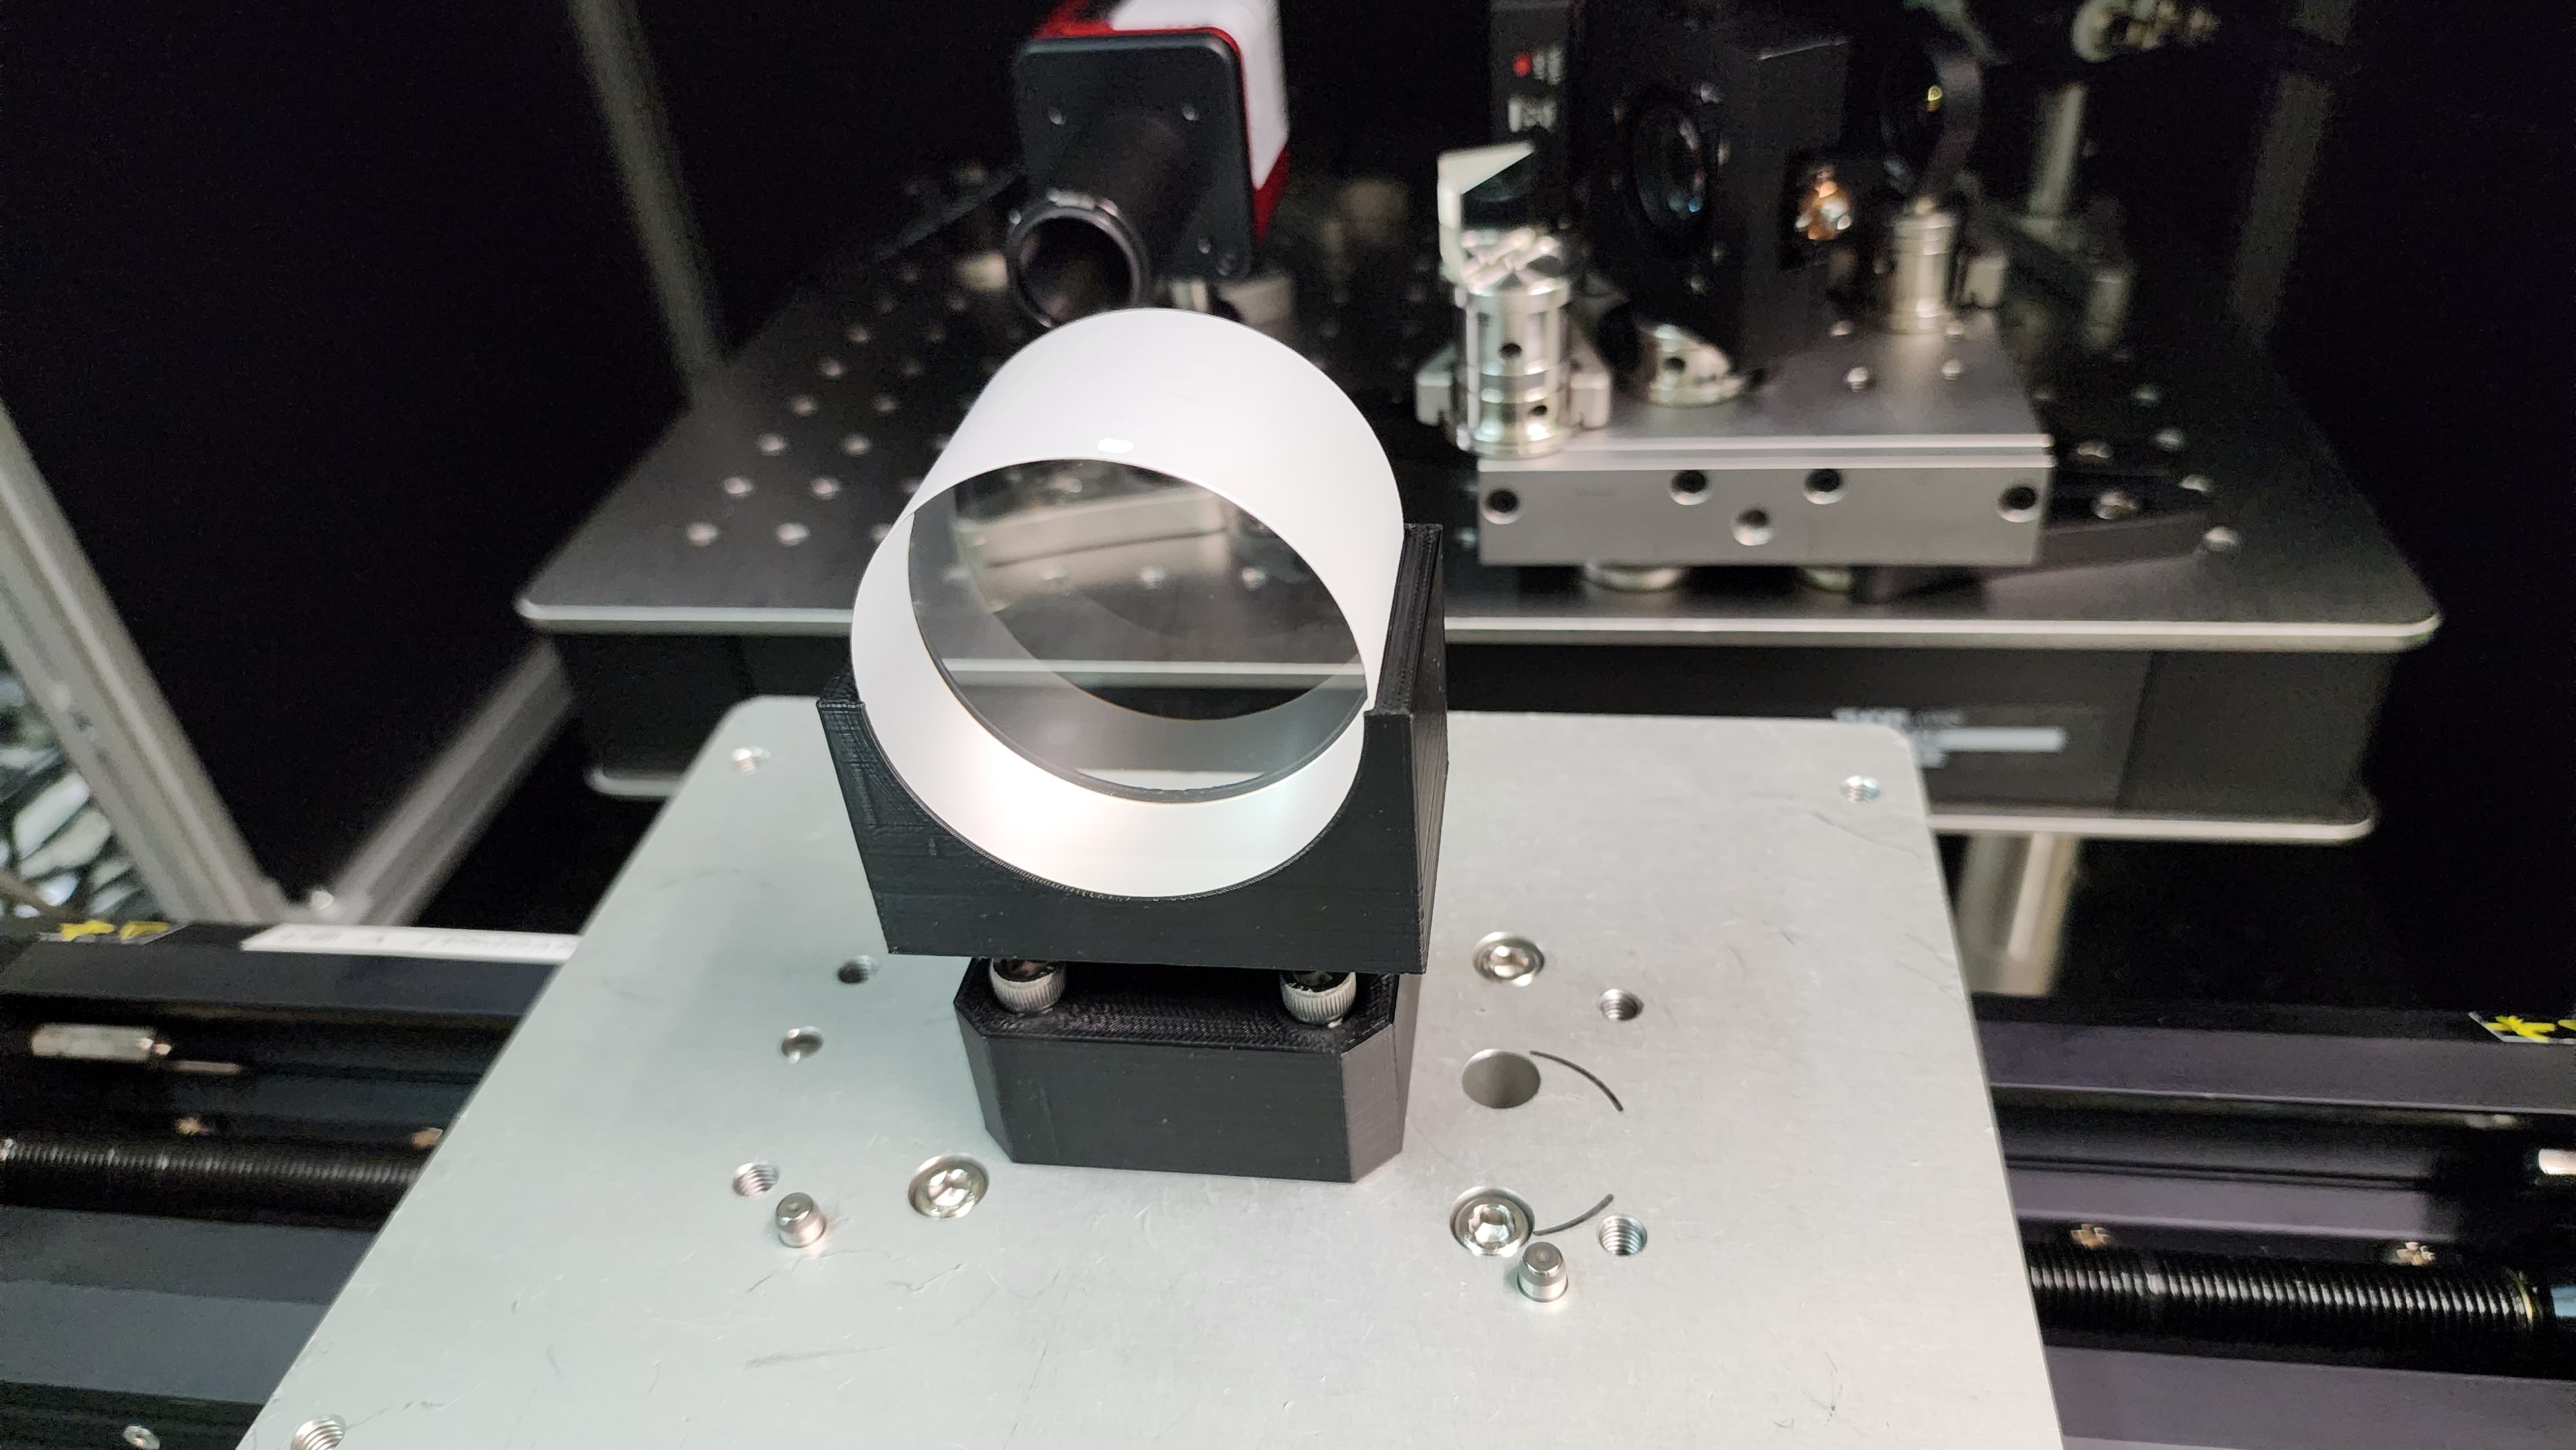
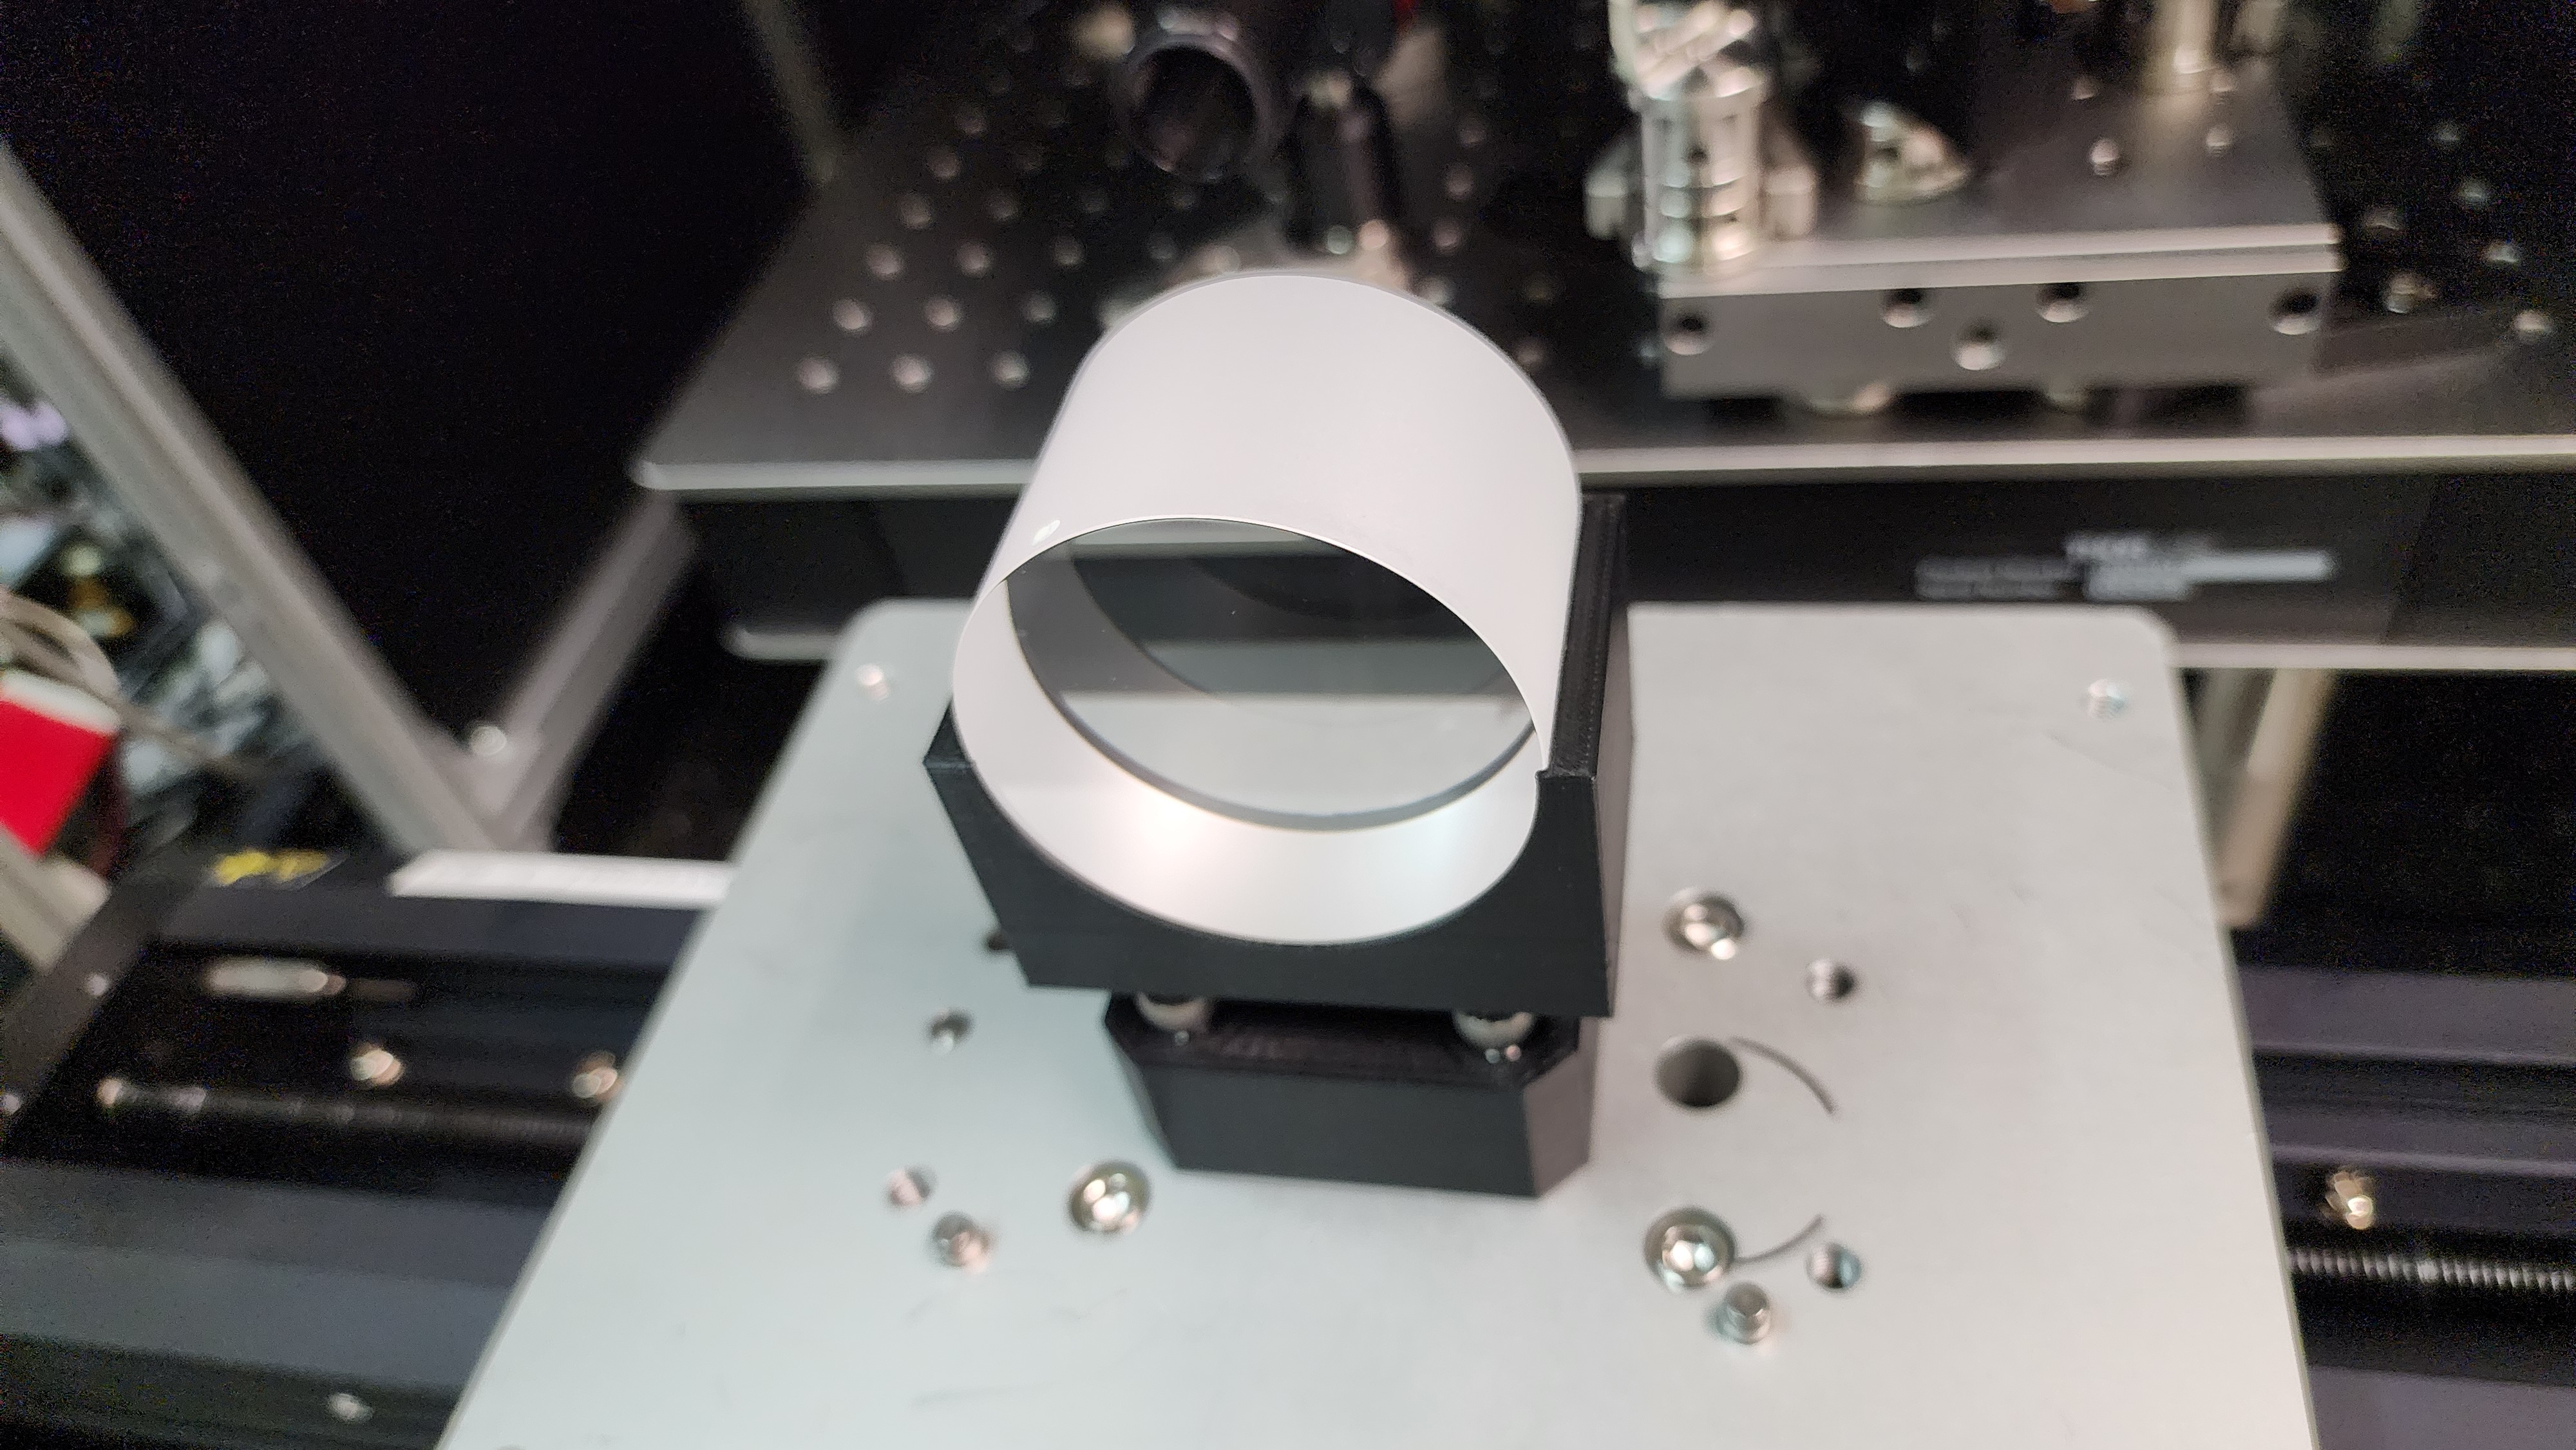
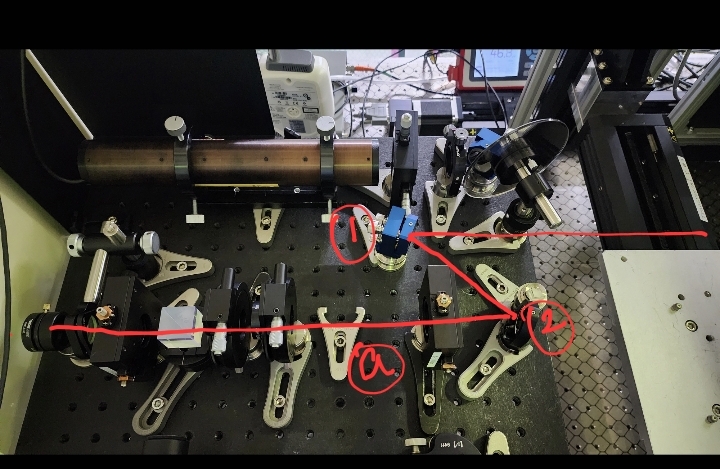
The optics (marked in pic 1) as 1 and 2 were changed. Previously we had some mirrors(perhaps 5104), and they were causing the polarization to change too much. So, they were replaced with Silver mirror PF10-03_P01-10. Then the polarizer was installed in rotation mount at place (a) shown in pic.
I have taken the Thorlabs cube polarizer from LC table. The previously used one in PCI was newport one, and it was not properly installed in the thorlabs cage rotator.
The polarizer alignment has to be tuned slightly more, but for now the polarization at the camera goes from azimuth (-90,90), and ellitpcity (0-2) degrees.
After moving the mirrors, I had to realign the beam. The alignment was tuned to obtain horizontal and vertical to be within 0.027deg and -0.016deg. See the plot 1 and 2 showing the horizontal and vertical alignment.
Actually the reason to install the metallic mirrors was to remove the polarizer to avoid possible power discrepancy at different rotation angle.
The HWP is mounted inside the motorized rotator and provides good azimuth coverage with only minimal ellipticity (~<1 deg)