NAOJ GW Elog Logbook 3.2

Nishino,
This is a result on 2024/10/11.
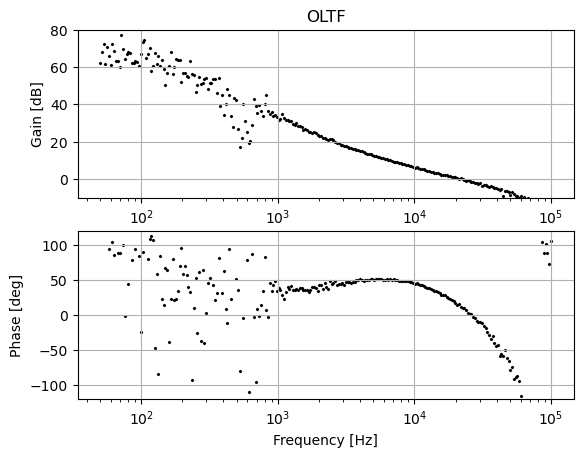
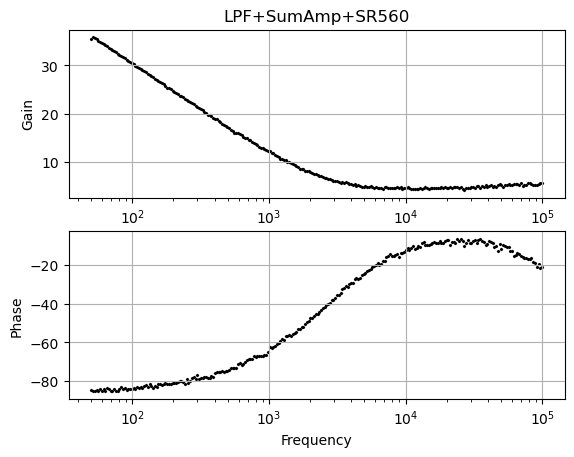
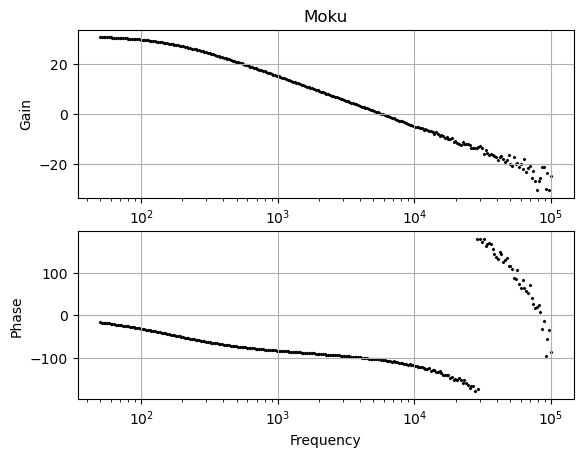
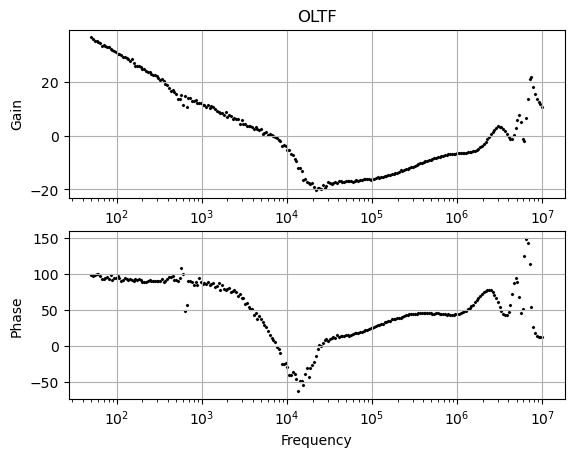
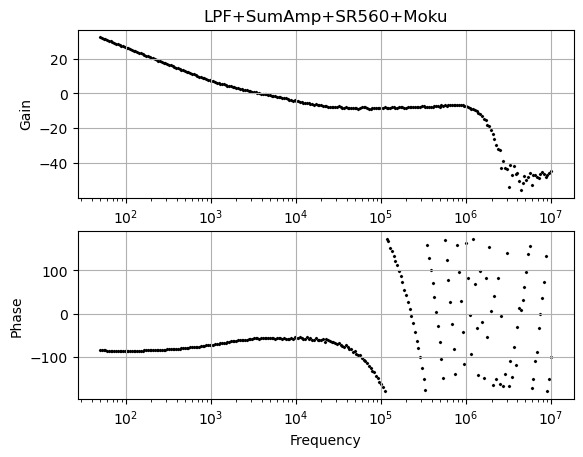
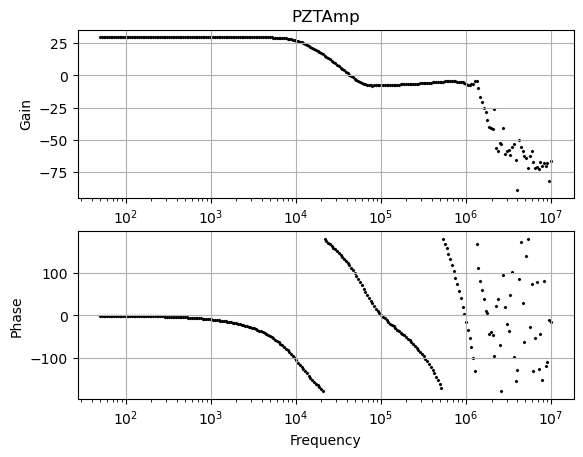
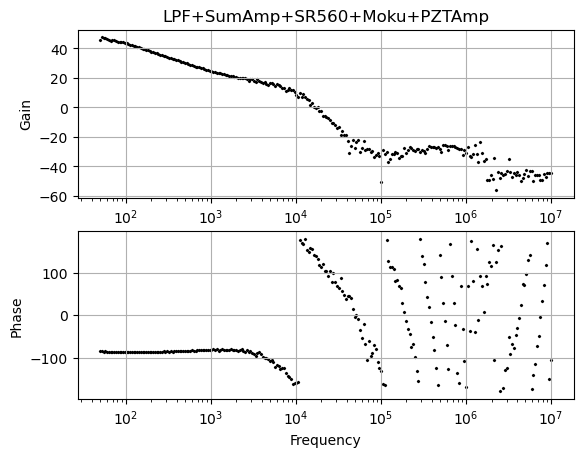
I measured the open loop transfer function (OLTF, Fig.1) of the GR lock loop. The filter funtions are measured independently (Fig. 2 and 3).
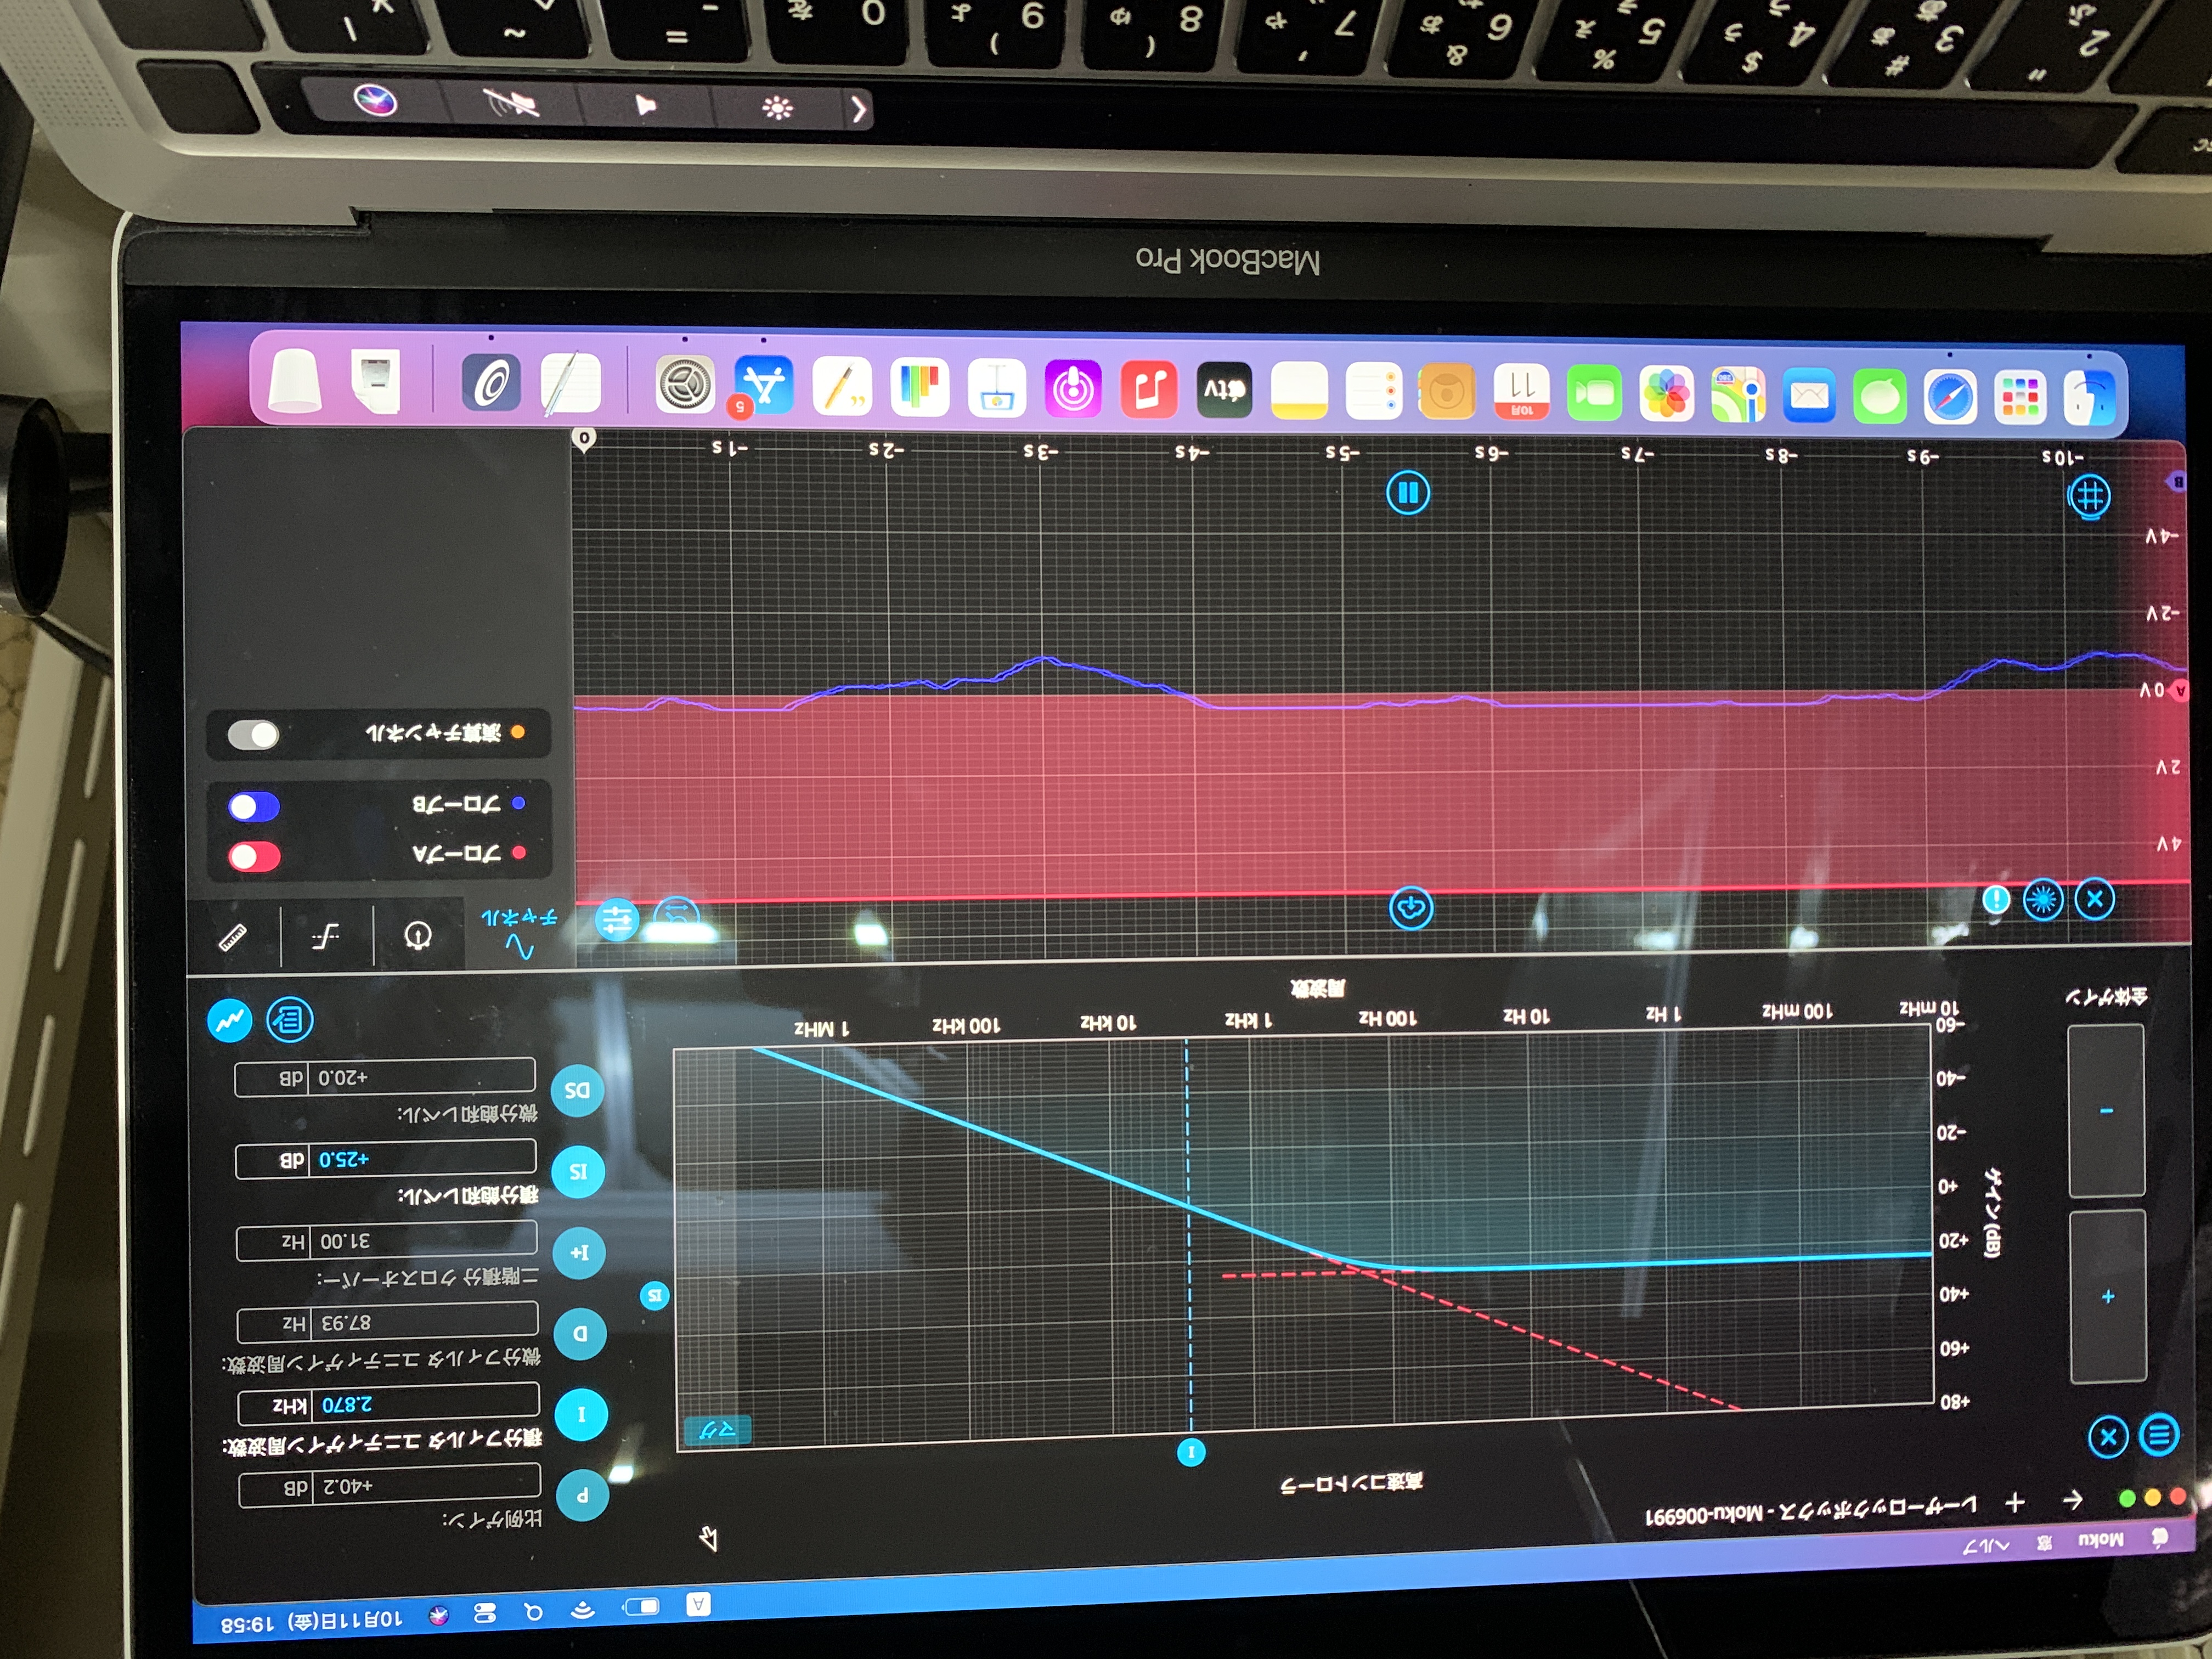
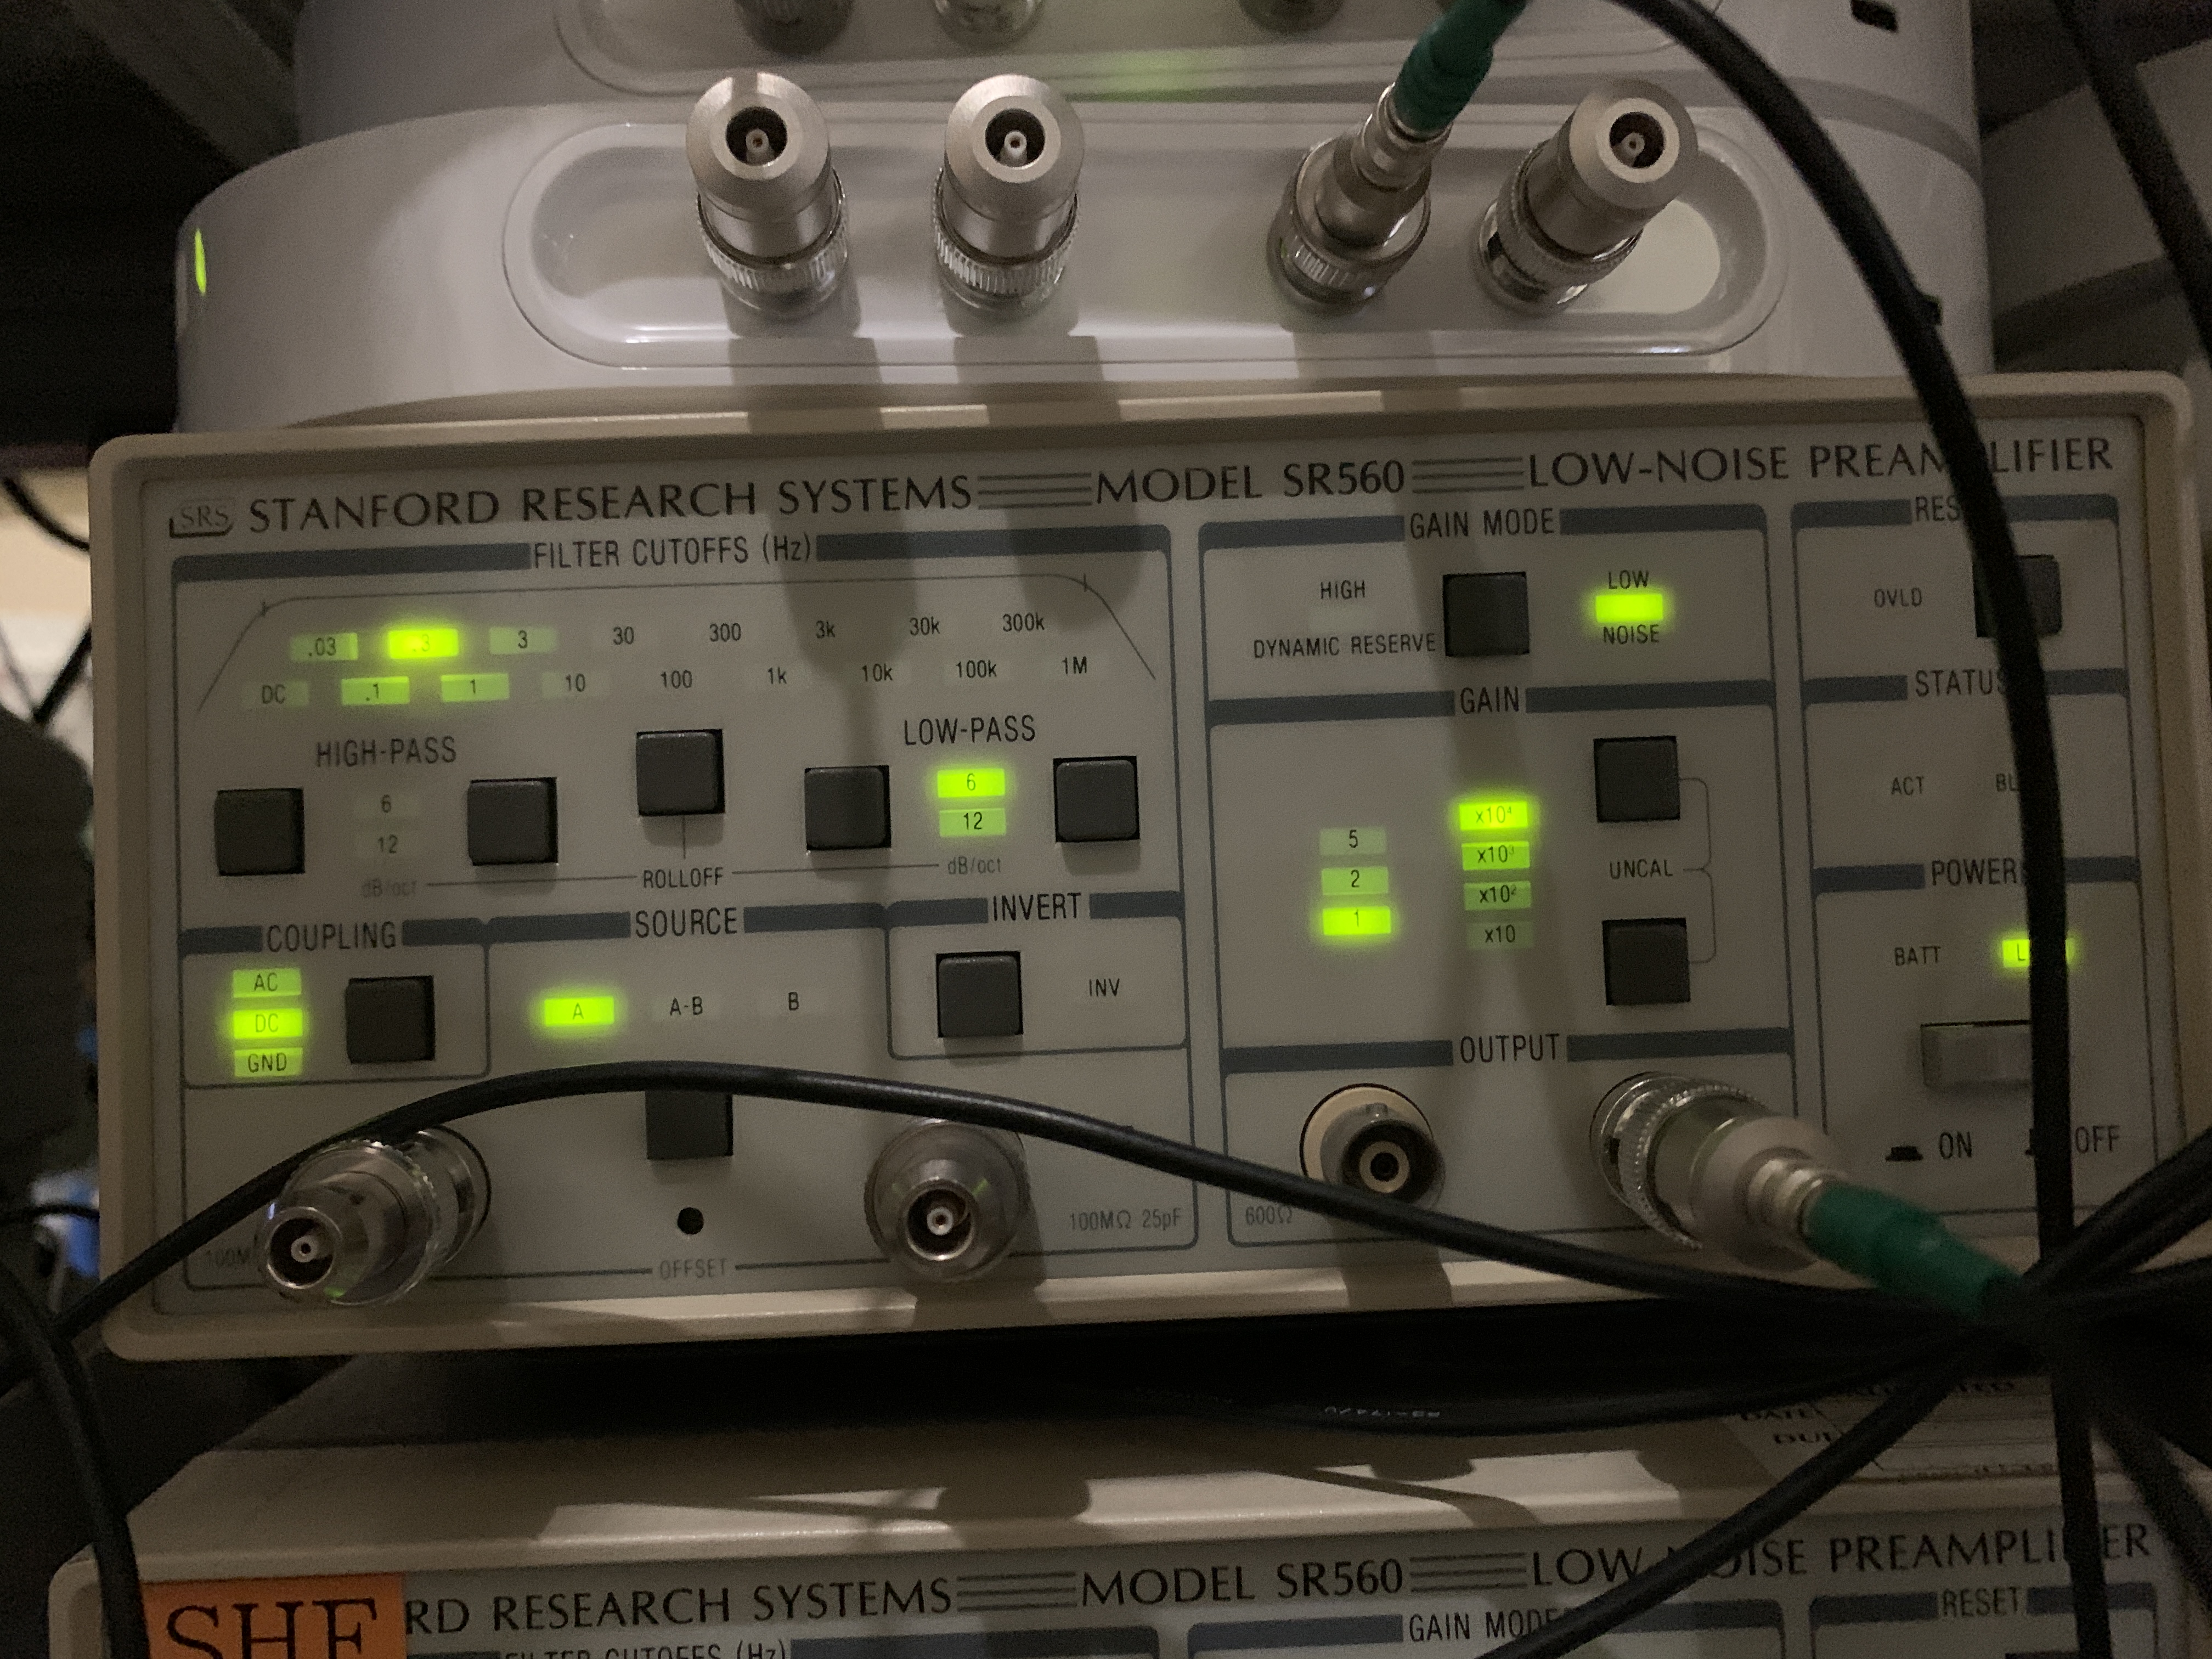
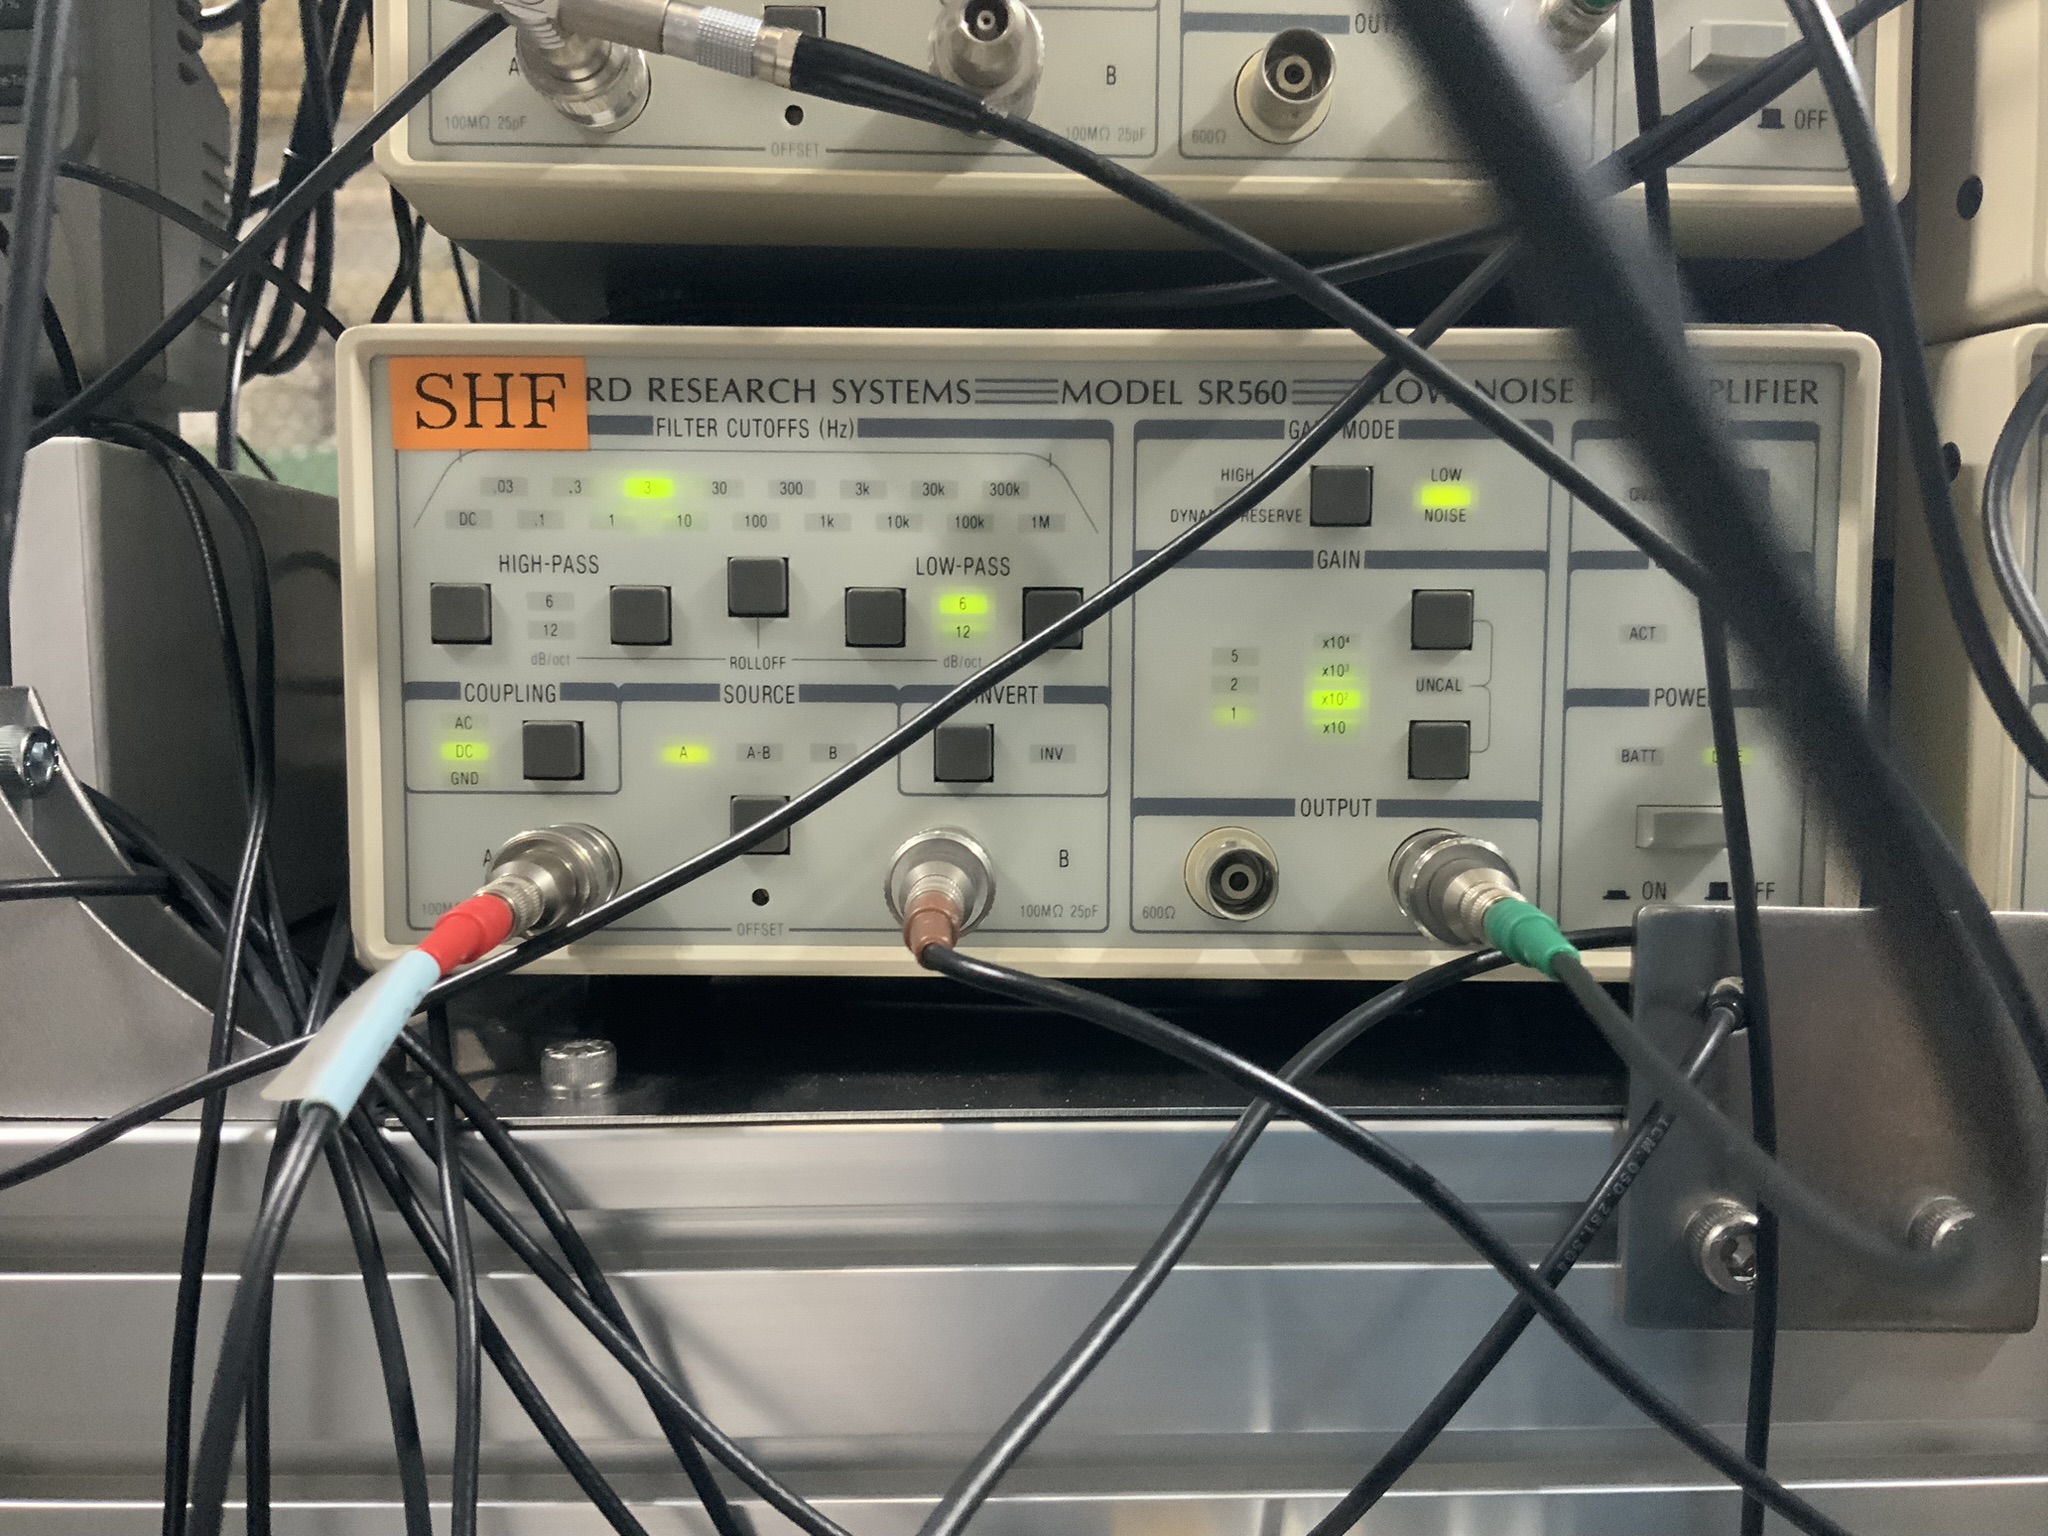
Setting of SR560 (Fig. 5) and Moku (Fig. 6):
SR560: 0.3 Hz, first order low pass, gain=10000
Moku PID: I=2.87 kHz, DS=25.0 dB
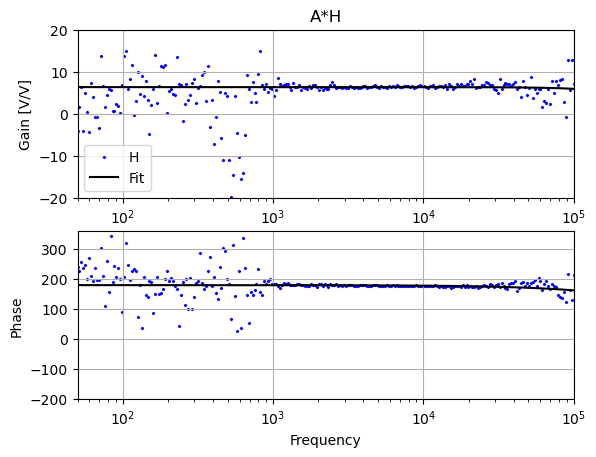
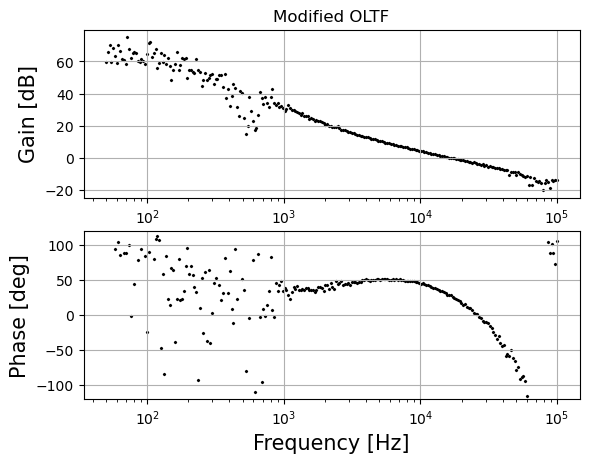
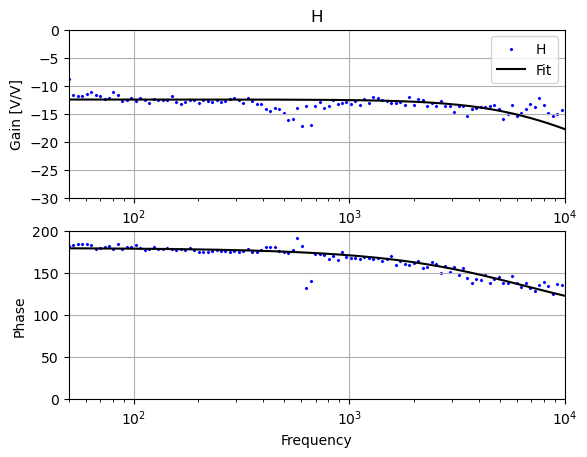
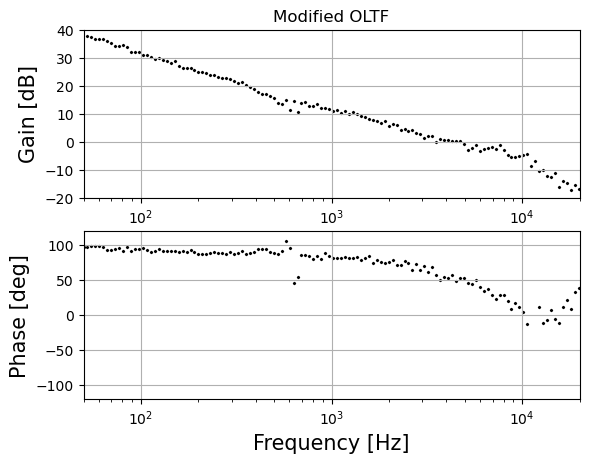
The inferred optical gain (not optical gain itself but A*H) is plotted in Fig. 4. From this result, I reduced the overall gain just by -2 dB, then the modified OLTF looks like Fig. 7, with UGF=2 kHz and phase margin=20 degrees.
Nishino,
This is a result on 2024/10/10.
I measured the open loop transfer function (OLTF, Fig.1) of the GR lock loop. The filter funtion and actuator efficiency is measured independently (Fig. 2 and 3, Fig. 4 is their sum).
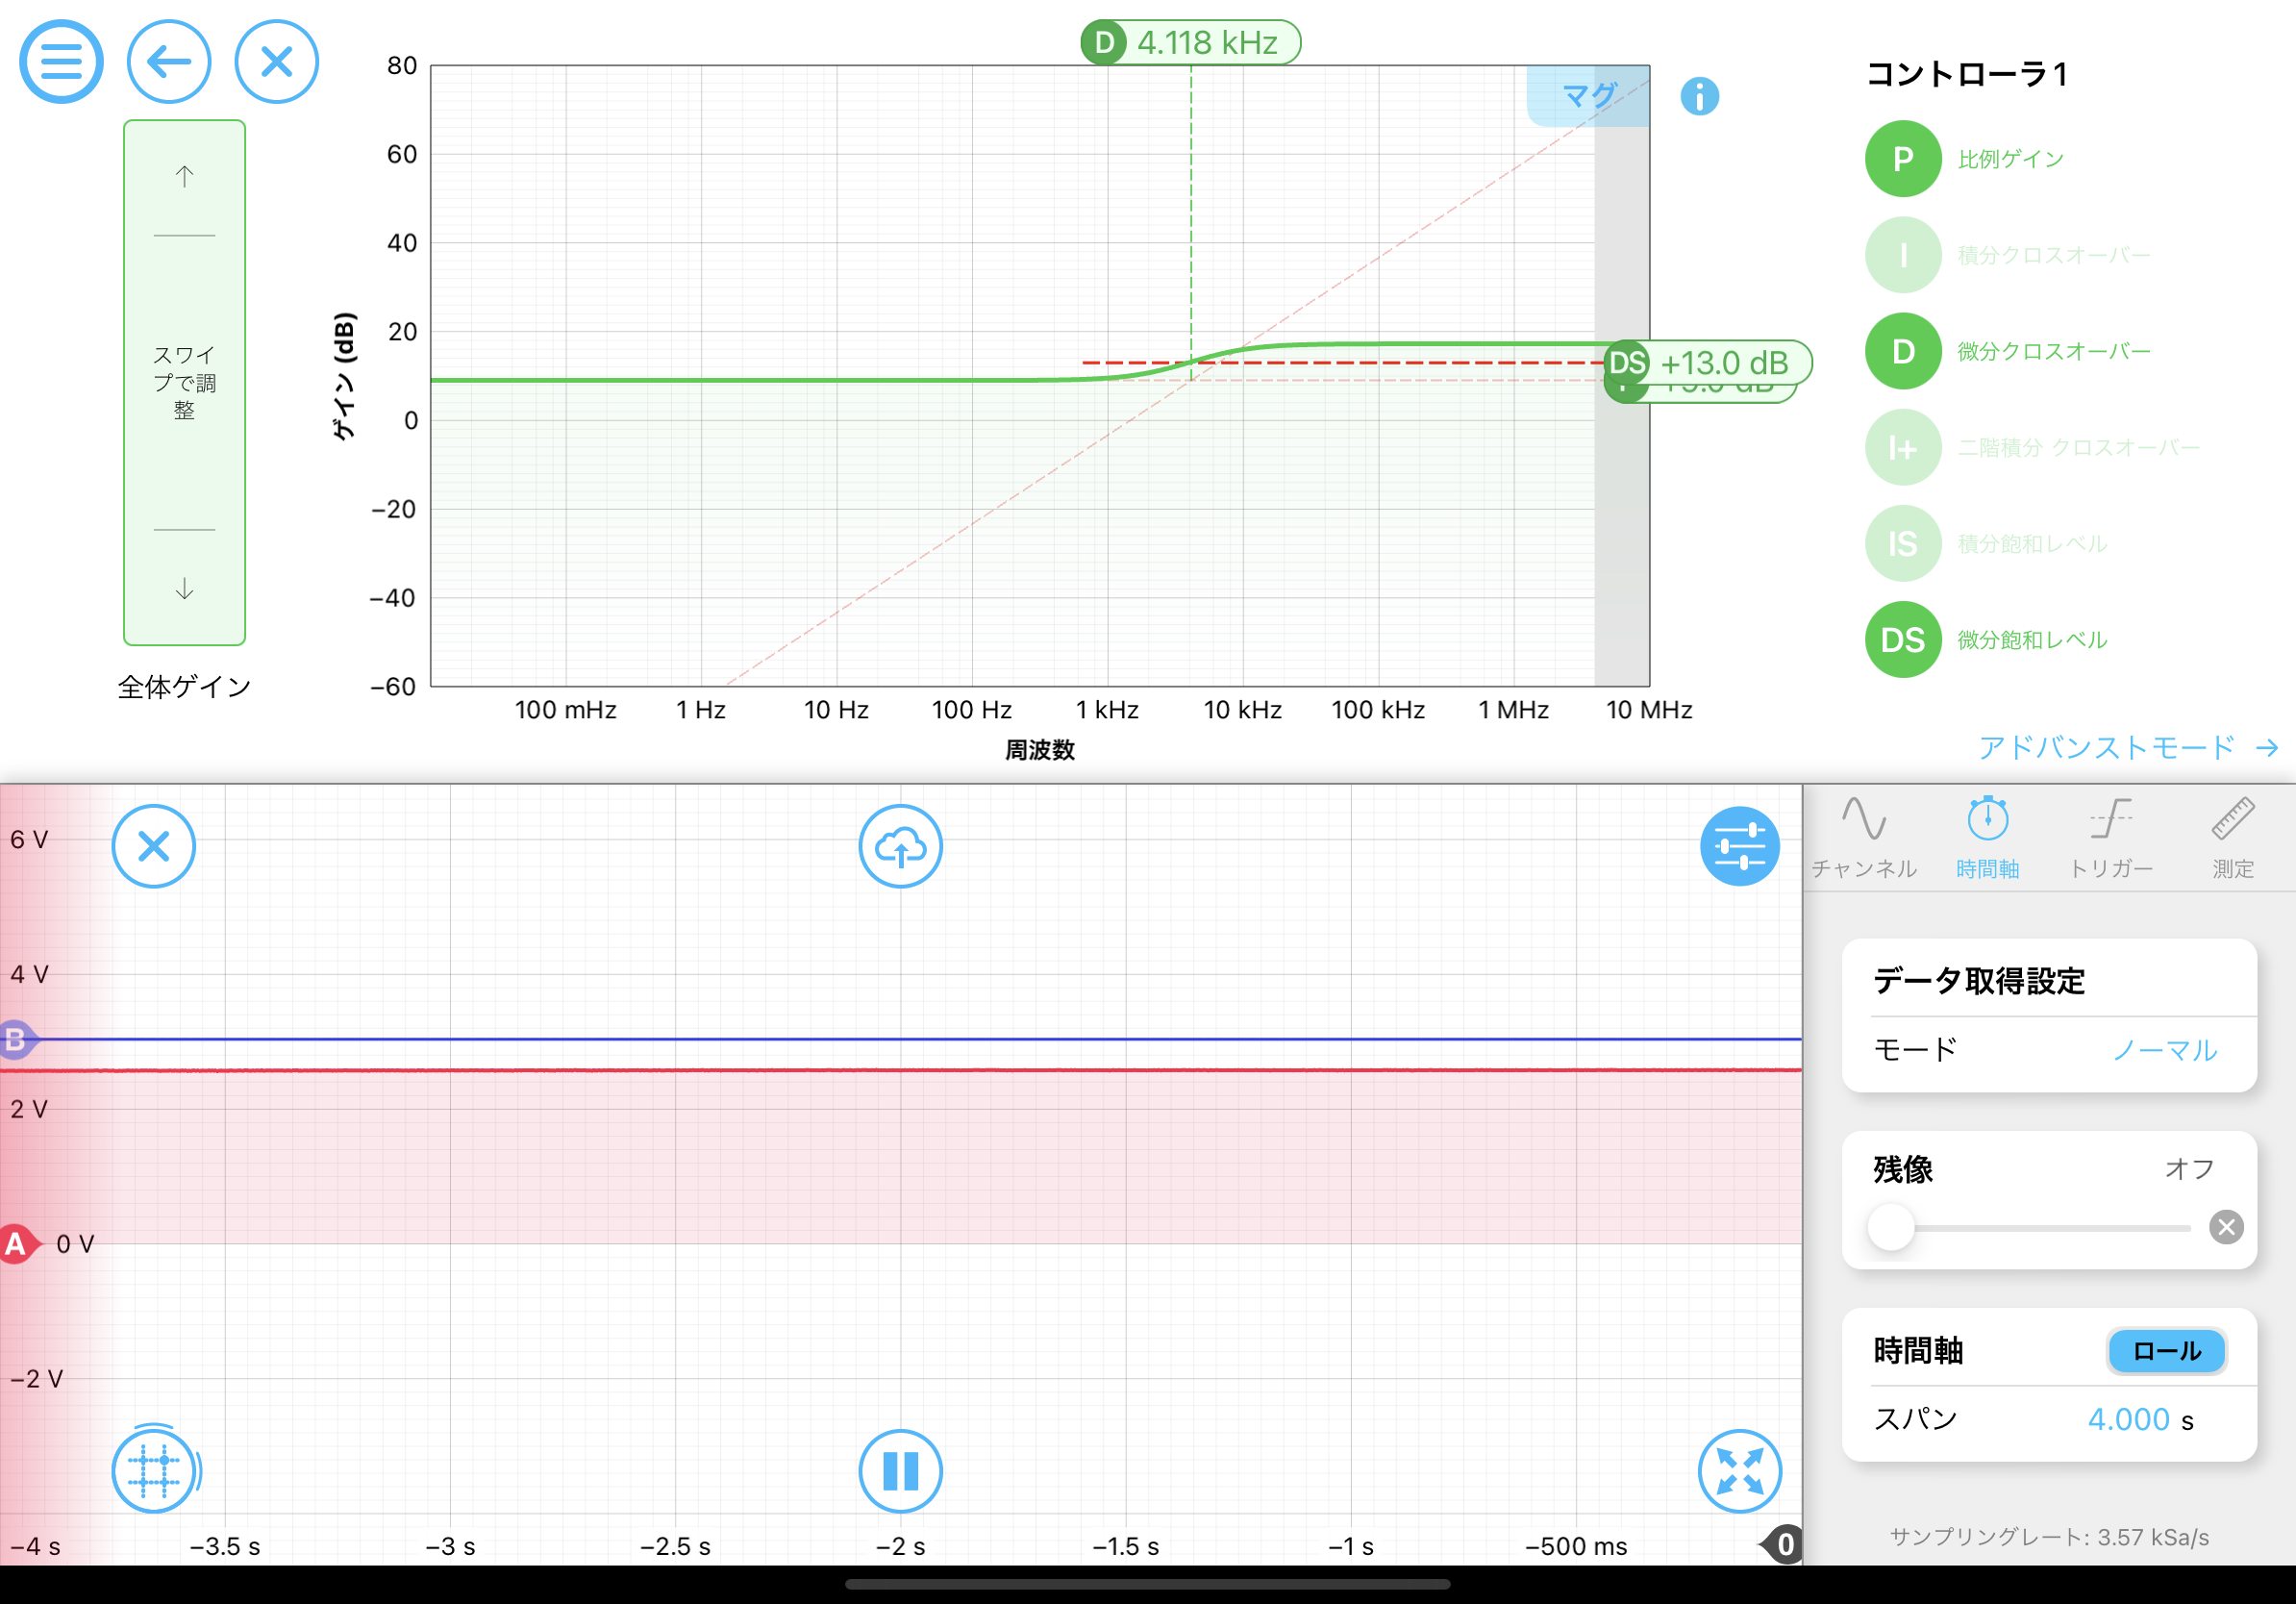
Setting of SR560 (Fig. 7) and Moku (Fig. 8):
SR560: 3 Hz, first order low pass, gain=100
Moku PID: P=10 dB, D=4.118 kHz, DS=13.0 dB
The inferred optical gain is plotted in Fig. 5. From this result, I modified the shape of filter by Moku PID controller as:
P = 10 dB, D = 20 dB, DS = 8 kHz.
Then the modified OLTF is plotted in Fig. 6 with UGF=4 kHz and phase margin=50 degrees.
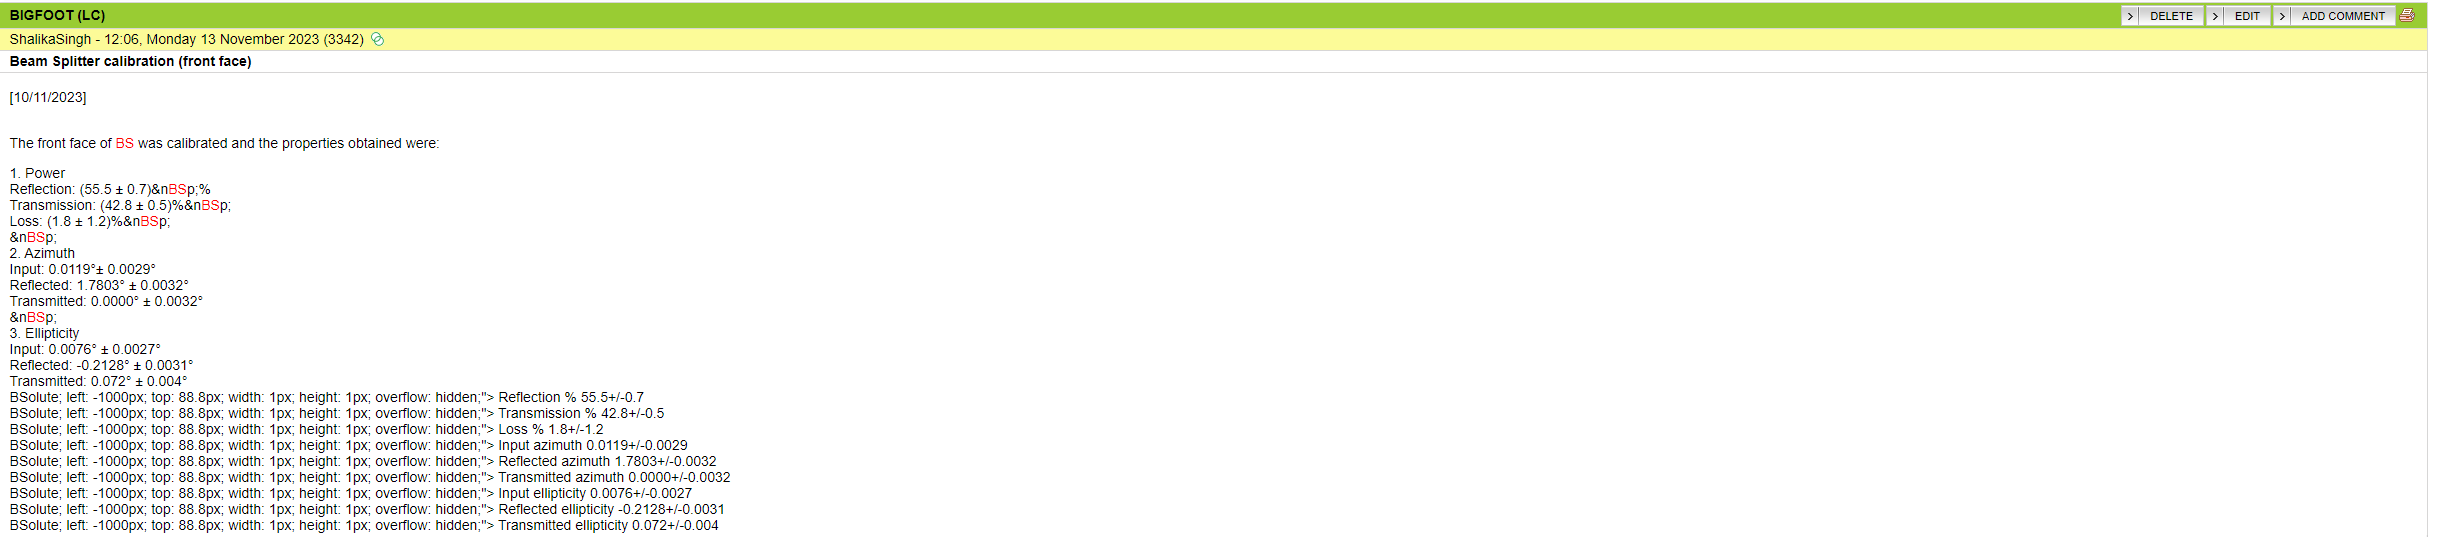
It seems there is some issue with all elogs made before the server change. They are looking weird. For instance https://gw-elog.mtk.nao.ac.jp/osl/index.php?r=3342
Due to this issue, sometimes the search filter fails, because it is unable to find the word(since it looks strange). The issue happens only if I search and go to the elog. Perhaps not if I go directly without searching through keyword option.
I made a mistake in measuring the BS. I rotated only 90deg. It was supposed to be rotated by 180 deg.
I designed some adapters between force gauge and hydrogel holders.
They're 3D printed with help of Kanzawa-san and models are saved in the dropbox/mount and holder folder.
The birefringence obtained is Fig 1. Since there were too few points (112/6050) after filtering. I will re take measurements.
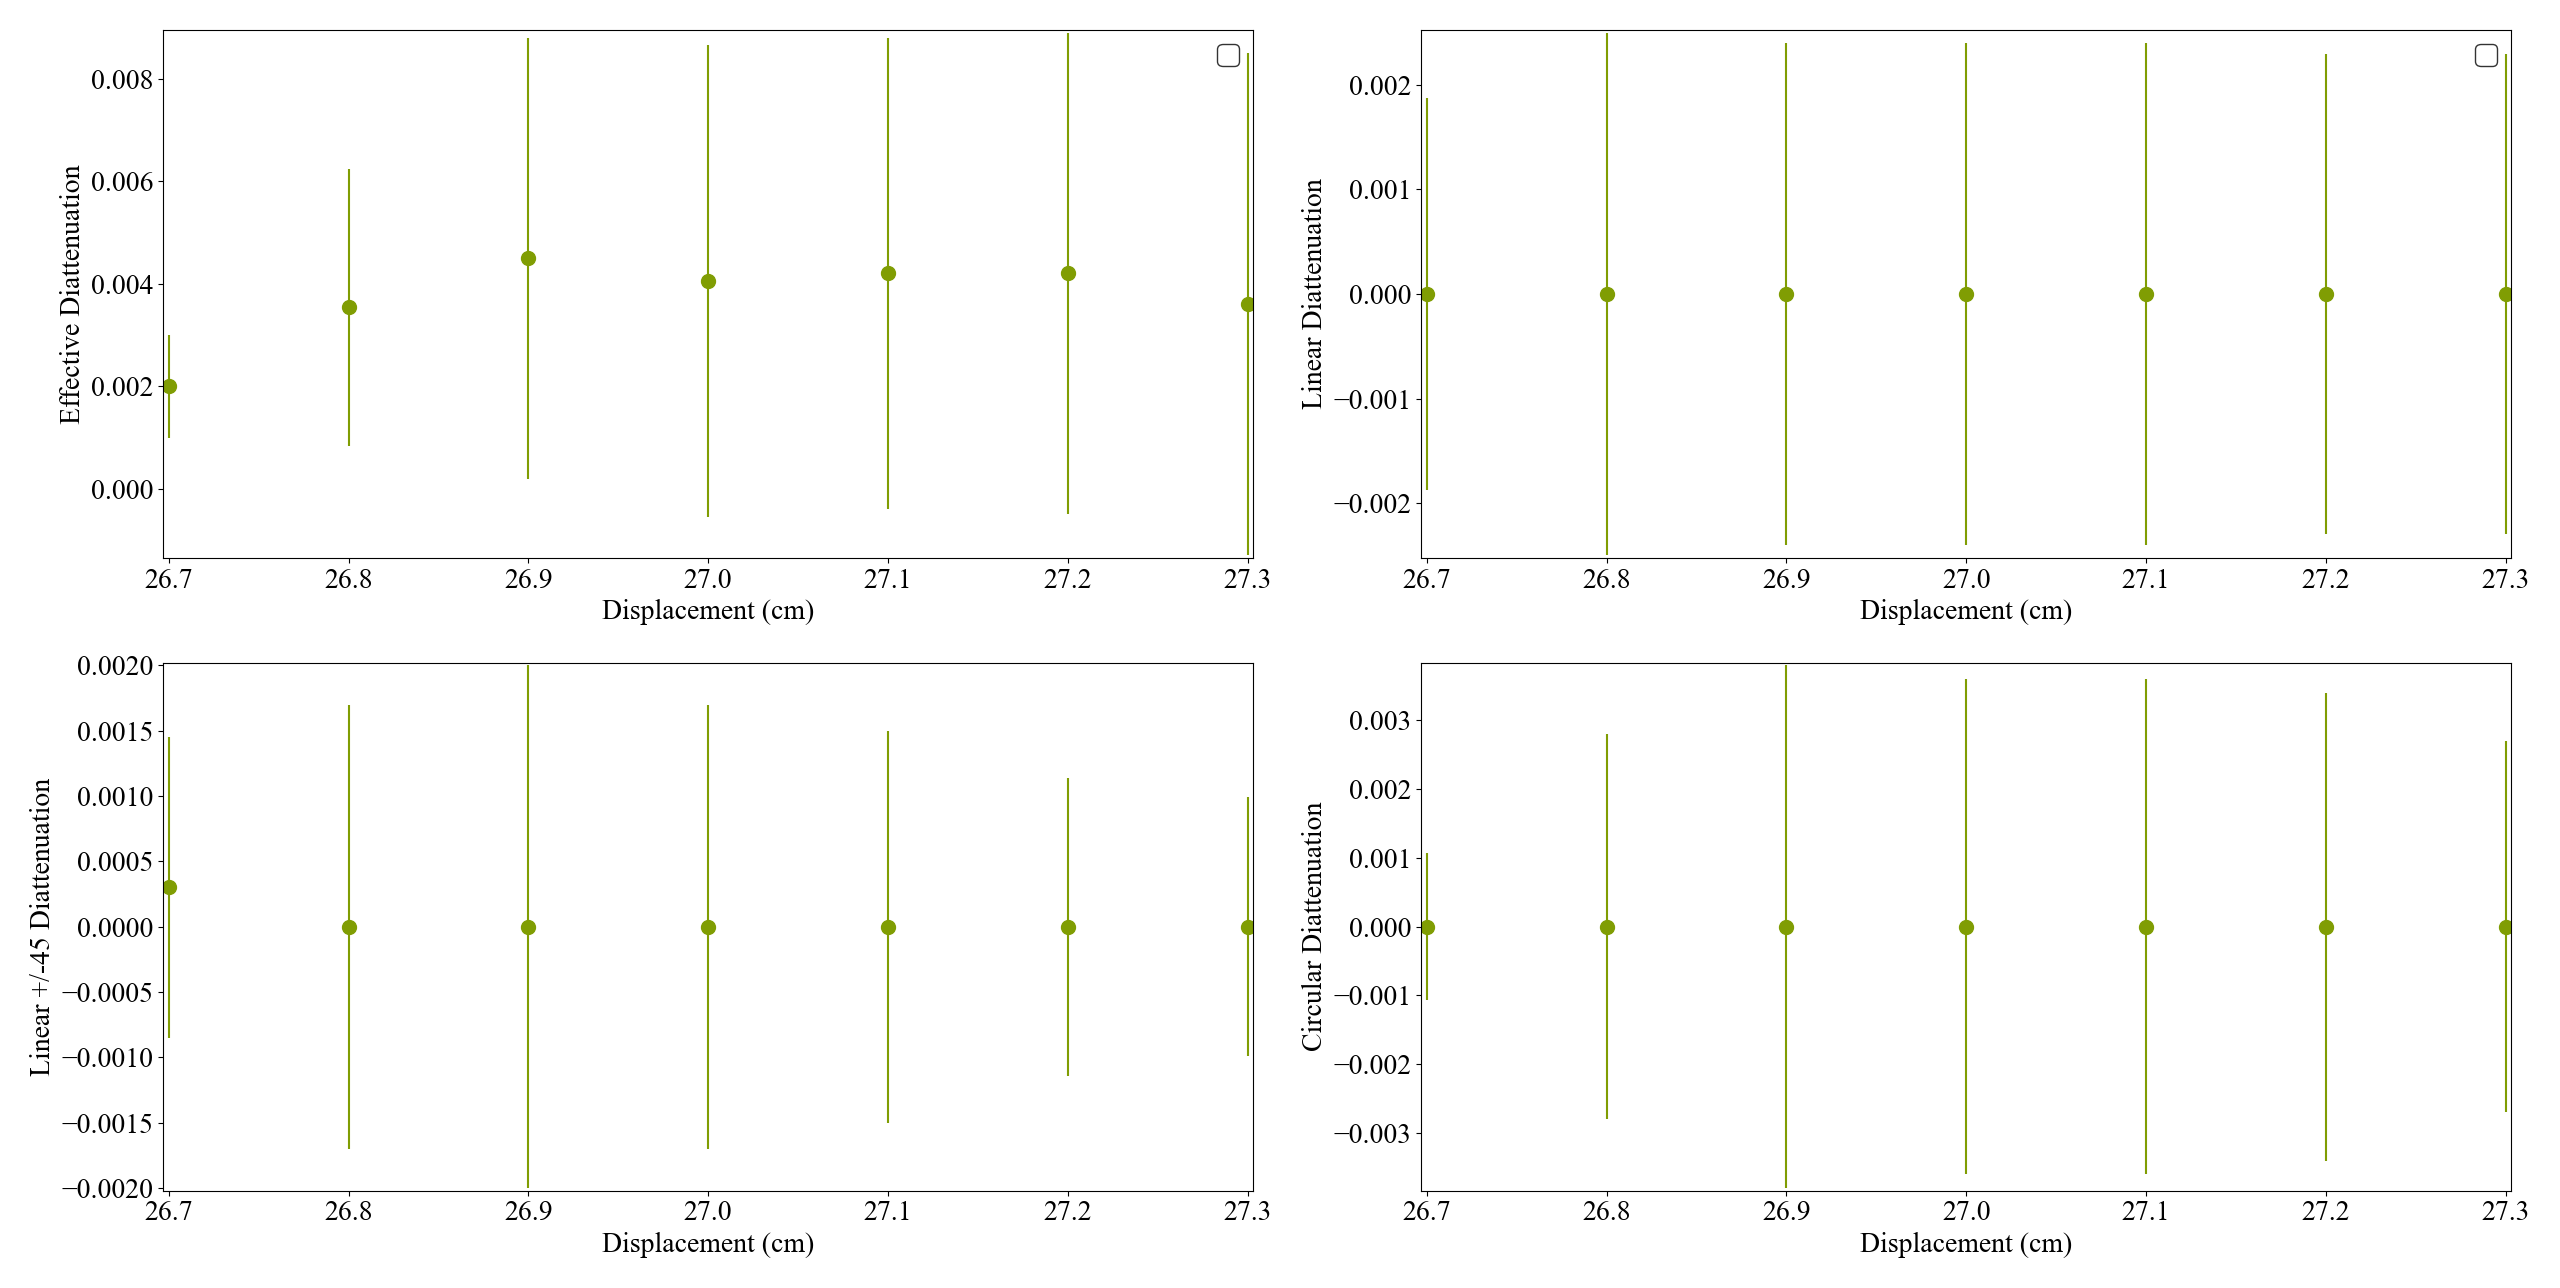
The diattenuation vs. Displacement is as in Fig 1. Doesn't change with increasing displacement.
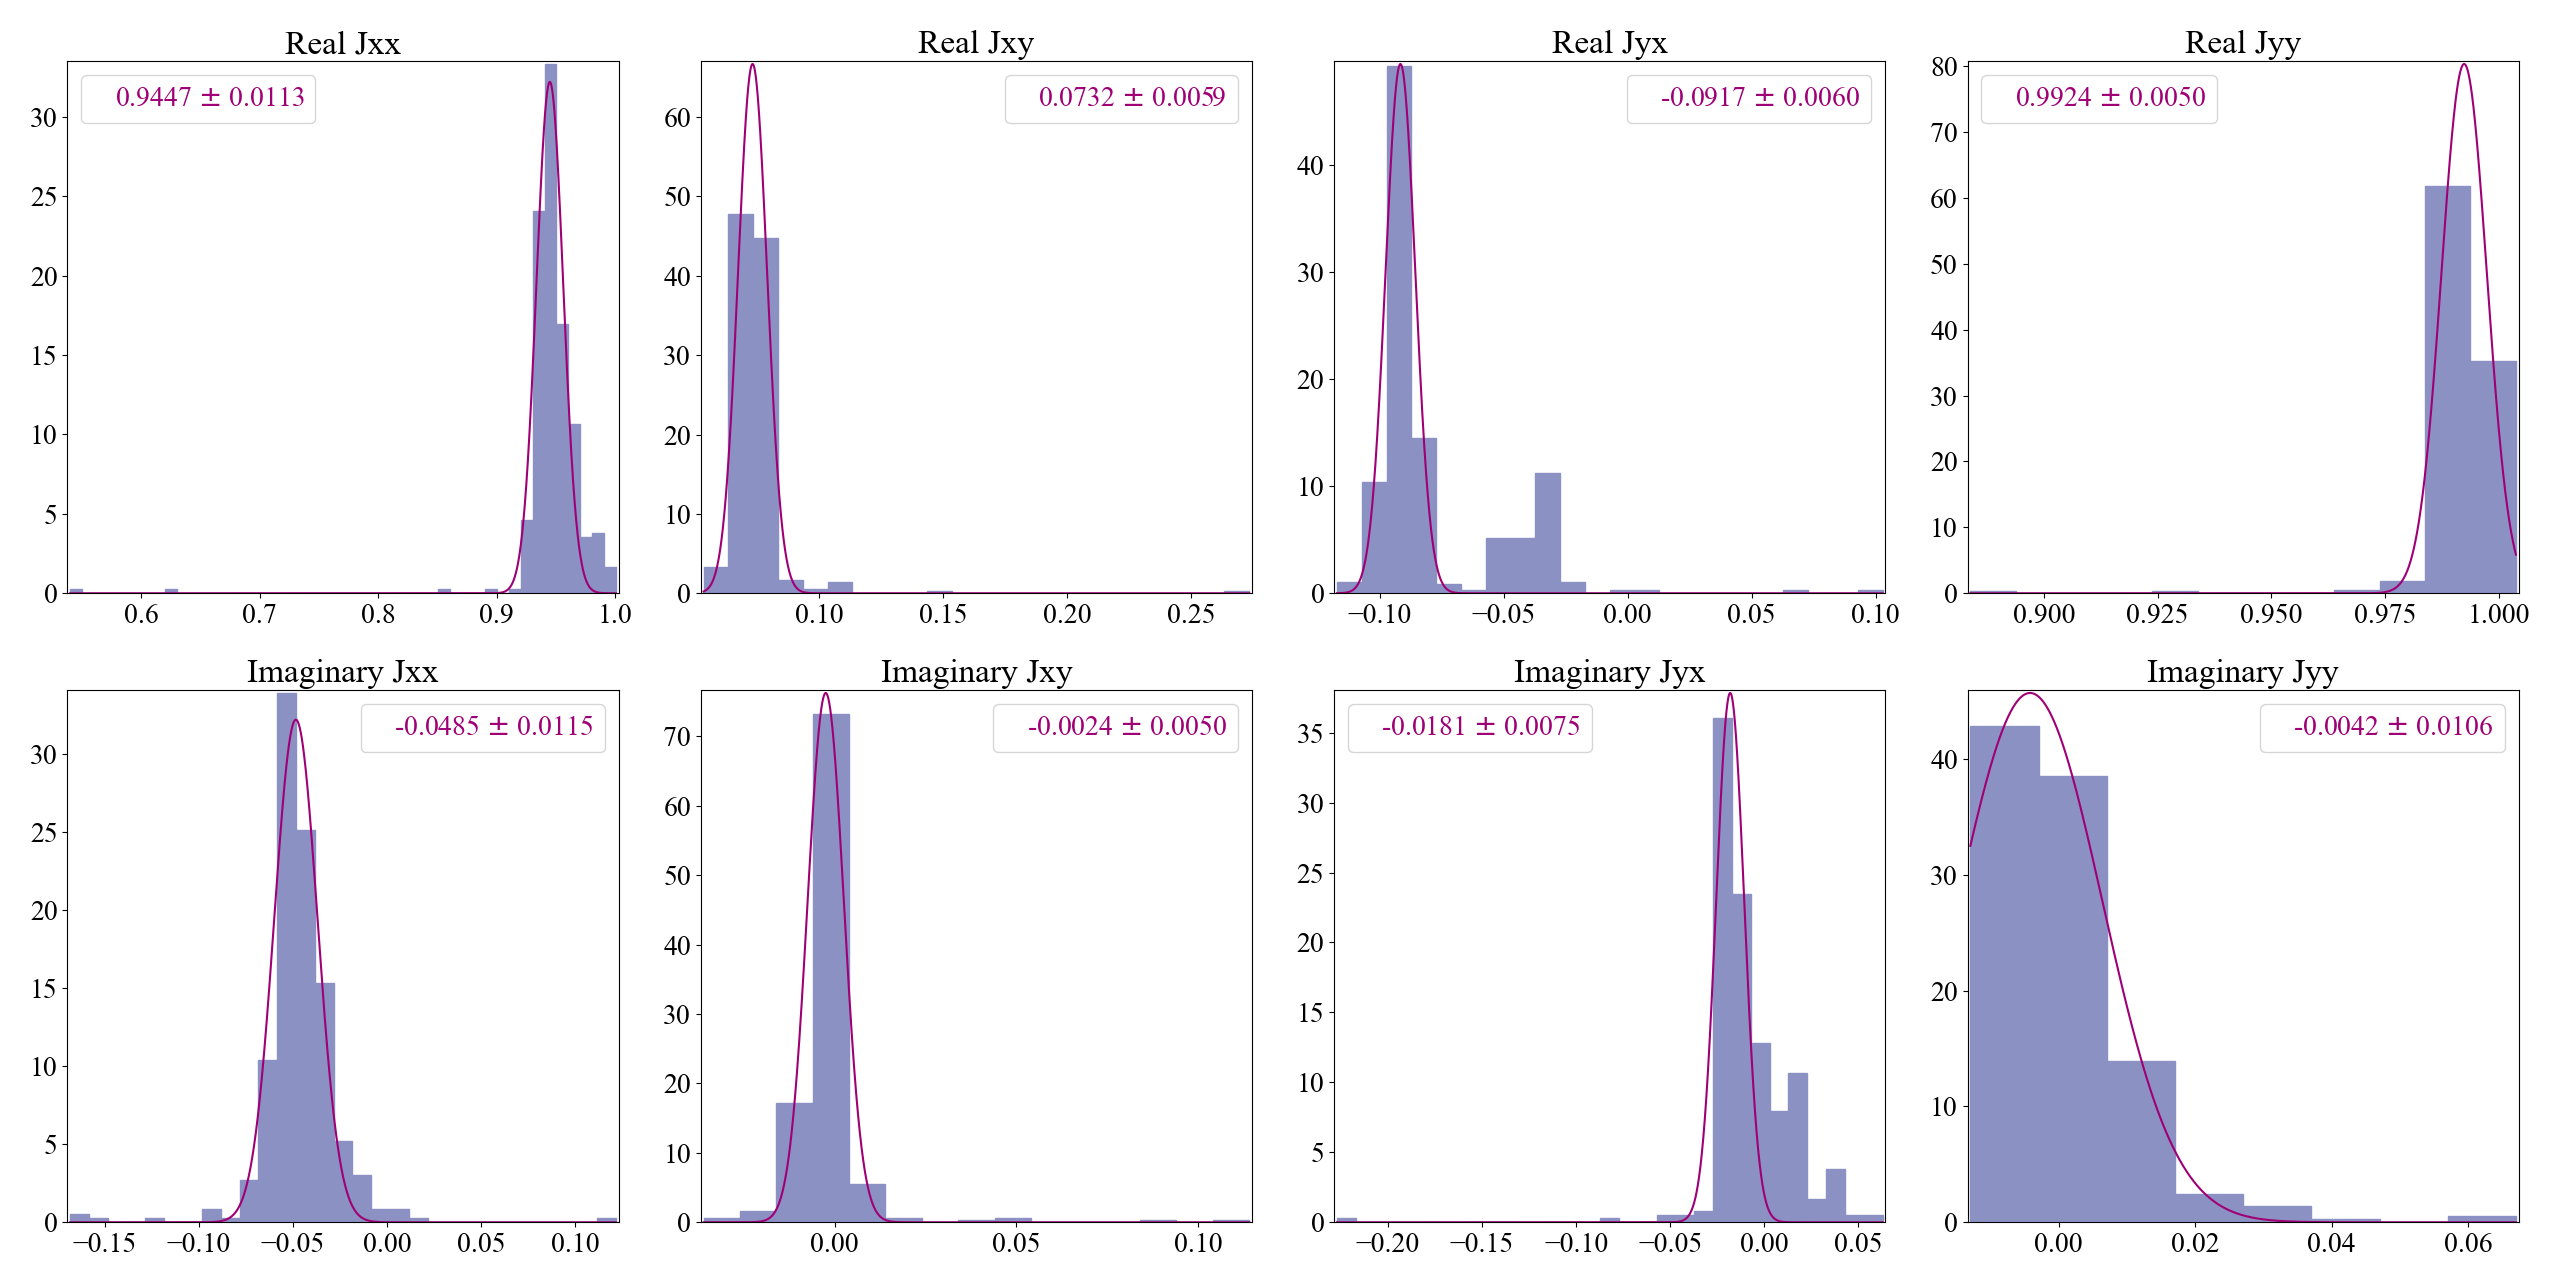
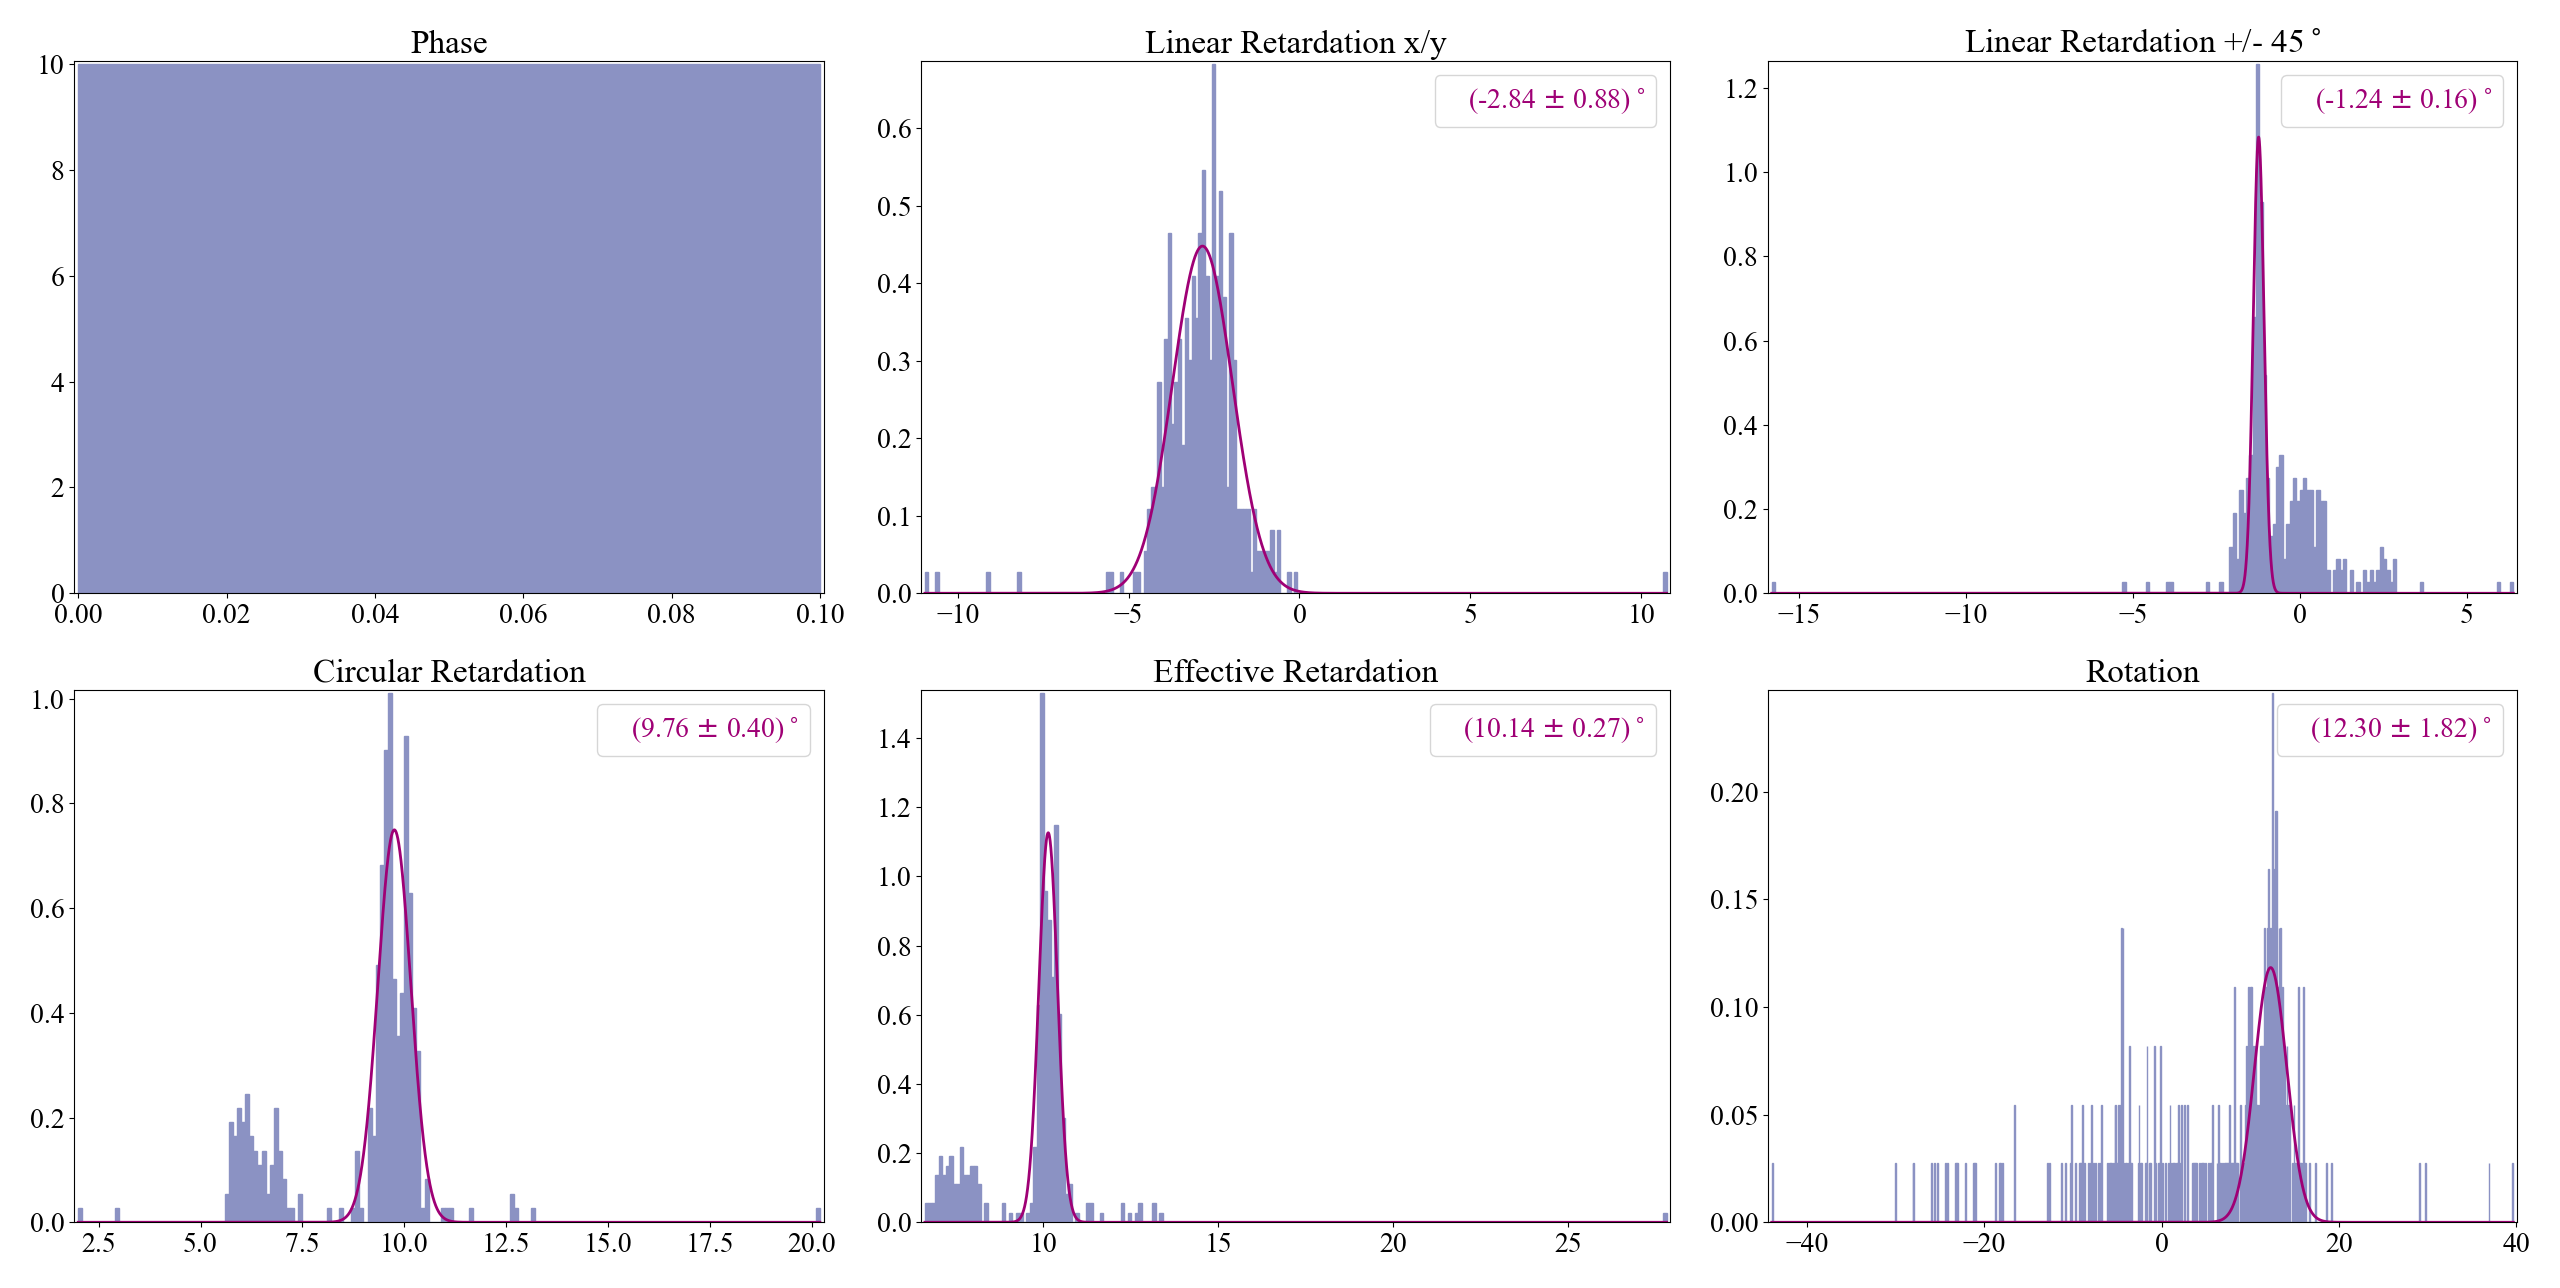
The birefringence of BS changed from 17deg to 10 deg after alignment tuning. See the picture for its Jones matrix (Fig1) and birefringence (Fig2). As you can see the JM doesn't have -ve sign any more in the real parts, and is closer to identiy matrix.
The condition on physical realizablity had error bar of 1E-4 (to lower two peaks on BS birefringence).
Polarization ray tracing to correct coordinate systems seems correct. Perhaps can tune BS alignment a bit more.
Owing to the spurious 17deg of circular retardation observed in BS birefringence characterisitics after correction using Polarization ray tracing, I redid calibration.
1. First it seems the alignment was off by 0.2 cm before the BS. I corrected this using the last steering mirror before the LC path. The beam height is now 7.5cm all along. The alignment was also checked with BS and was slightly(0.1cm) tuned to obtain good alignment in its reflection.
2. The BS is removed. LC voltage changes from 0-3.5V with 0.1V step and 100 avg.
Polarization states without BS:
C:\Users\atama\Dropbox\LC-Experiment\Measurement Data\Polarization states\20241004\Fri, Oct 4, 2024 6-35-14 PM.txt
3. The BS is rotated by 180 degrees to measure its back face.
Polarization states after relfection from back side of BS:
C:\Users\atama\Dropbox\LC-Experiment\Measurement Data\Birefringence Measurements\Beam Splitter Calibration\20241006\back_refl\Sun, Oct 6, 2024 5-32-19 PM.txt
The birefringence of BS changed from 17deg to 10 deg after alignment tuning. See the picture for its Jones matrix (Fig1) and birefringence (Fig2). As you can see the JM doesn't have -ve sign any more in the real parts, and is closer to identiy matrix.
The condition on physical realizablity had error bar of 1E-4 (to lower two peaks on BS birefringence).
Polarization ray tracing to correct coordinate systems seems correct. Perhaps can tune BS alignment a bit more.
I made a mistake in measuring the BS. I rotated only 90deg. It was supposed to be rotated by 180 deg.
I also added a voltage regulator 7815 (for +15V) and 79 (for -15V) to supply voltage for opamp. A 0.33uF ceramic capacitor is added on the input side of these regulators. Another 0.1uF ceramic capacitor is added on the output side of these capacitors.
I can use a feedback resistance of 1.1k instead of 1.07k, since 1.1k is readily available. Also, the inductors measure about 6.4mH(using multimeter), instead of 6.8mH. In series they will be 12.8mH instead of 13.6m in the deisgn. This shifts the resonant frequency by 18kHz, but doesn't change the gain or the current properties of the circuit too much. So, even if the components will not be perfect we will not overshoot the 20mA limit of the opAmp current at the output.
The OpAmp in elec shop is Op27G / OP27 whose max current is 20mA.
There is a discrepancy in the reported output current for OP27. Texas instruments says 30mA in their datasheet. On the other hand Digikey reports 20mA.
From last Friday
I previously attempted to lock the SHG by switching around the DDS1 DAC channels - in the normal configuration DAC0 outputs -9 dBm to +14 dB -> 5 dBm to main laser EOM, while DAC1 outputs 9 dBm to splitter for SHG/IRMC demod. I switched them around but this just makes the SHG oscillate even at 0 gain. So I put them back to normal. The rationale for switching is that the wiki shows an 88 MHz Qubig EOM datasheet which specifies that we need about 12-15 dBm RF power to achieve 0.2 modulation index. However, this is for the OPO EOM "EO-88K3-NIR", while the ML EOM is "PM8-NIR-88". I cannot find the datasheet for this particular EOM but other PM8 EOM datasheets indicate that 5 dBm is sufficient to generate 0.2 modulation index.
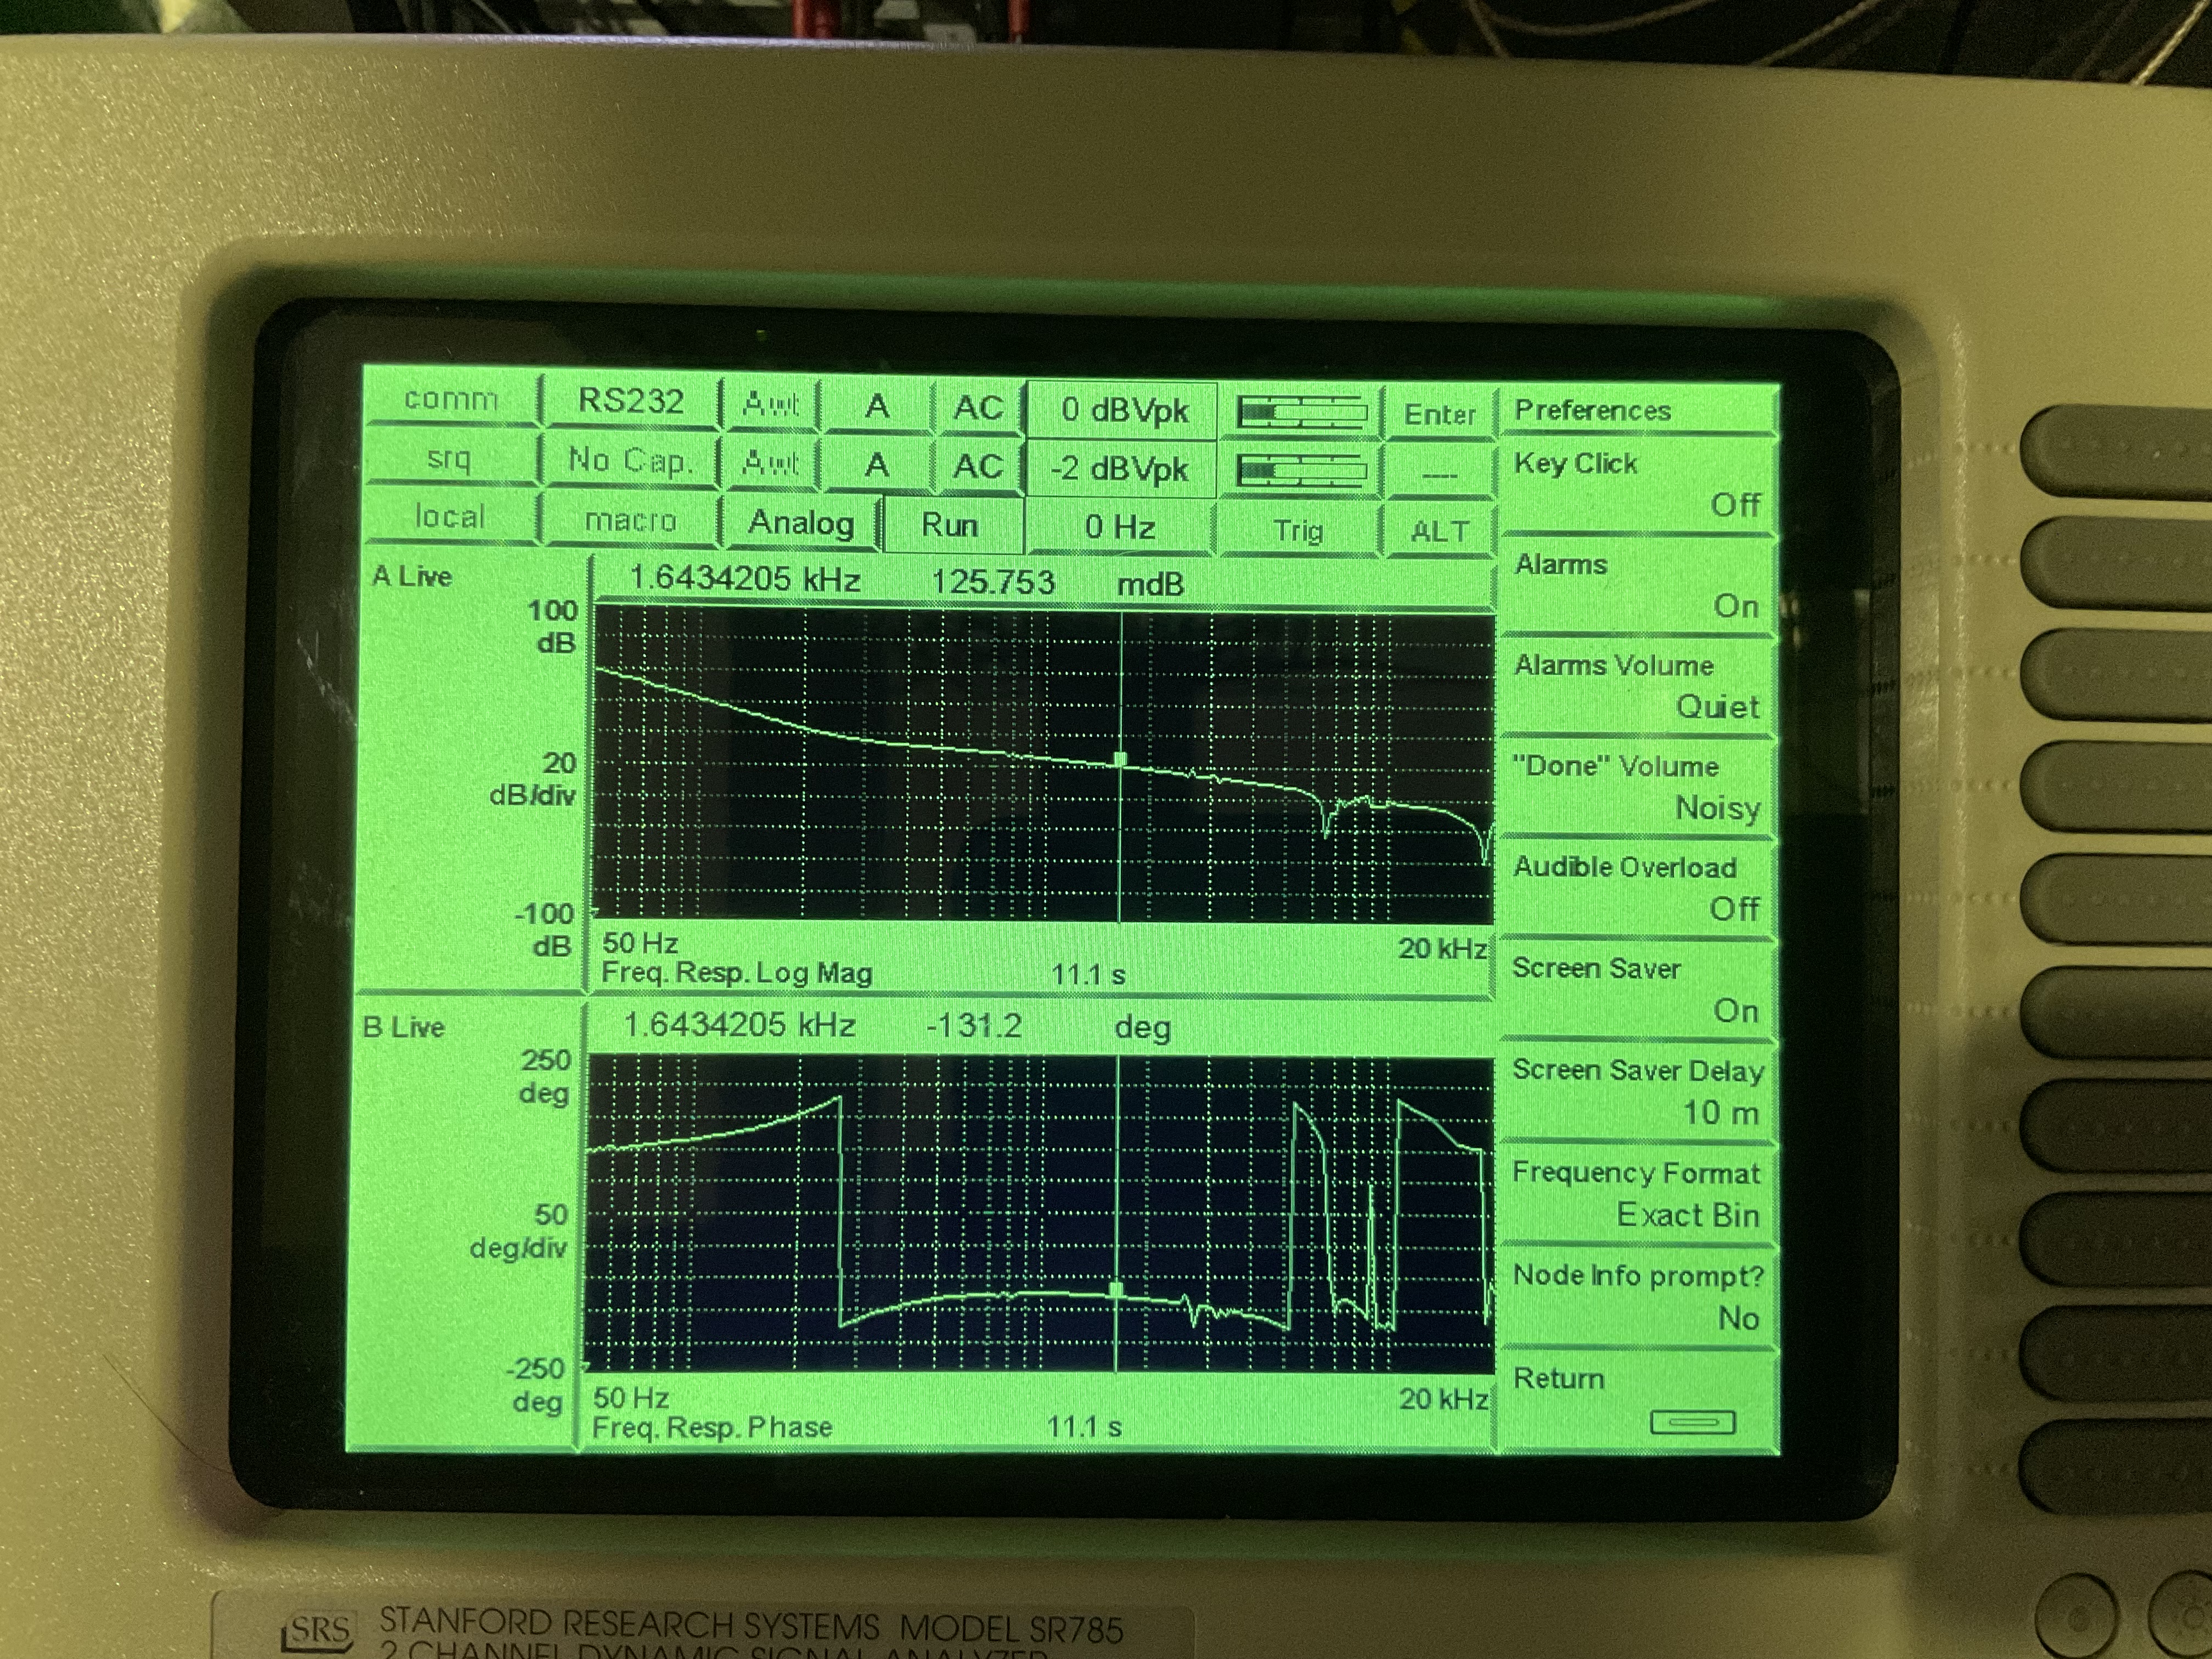
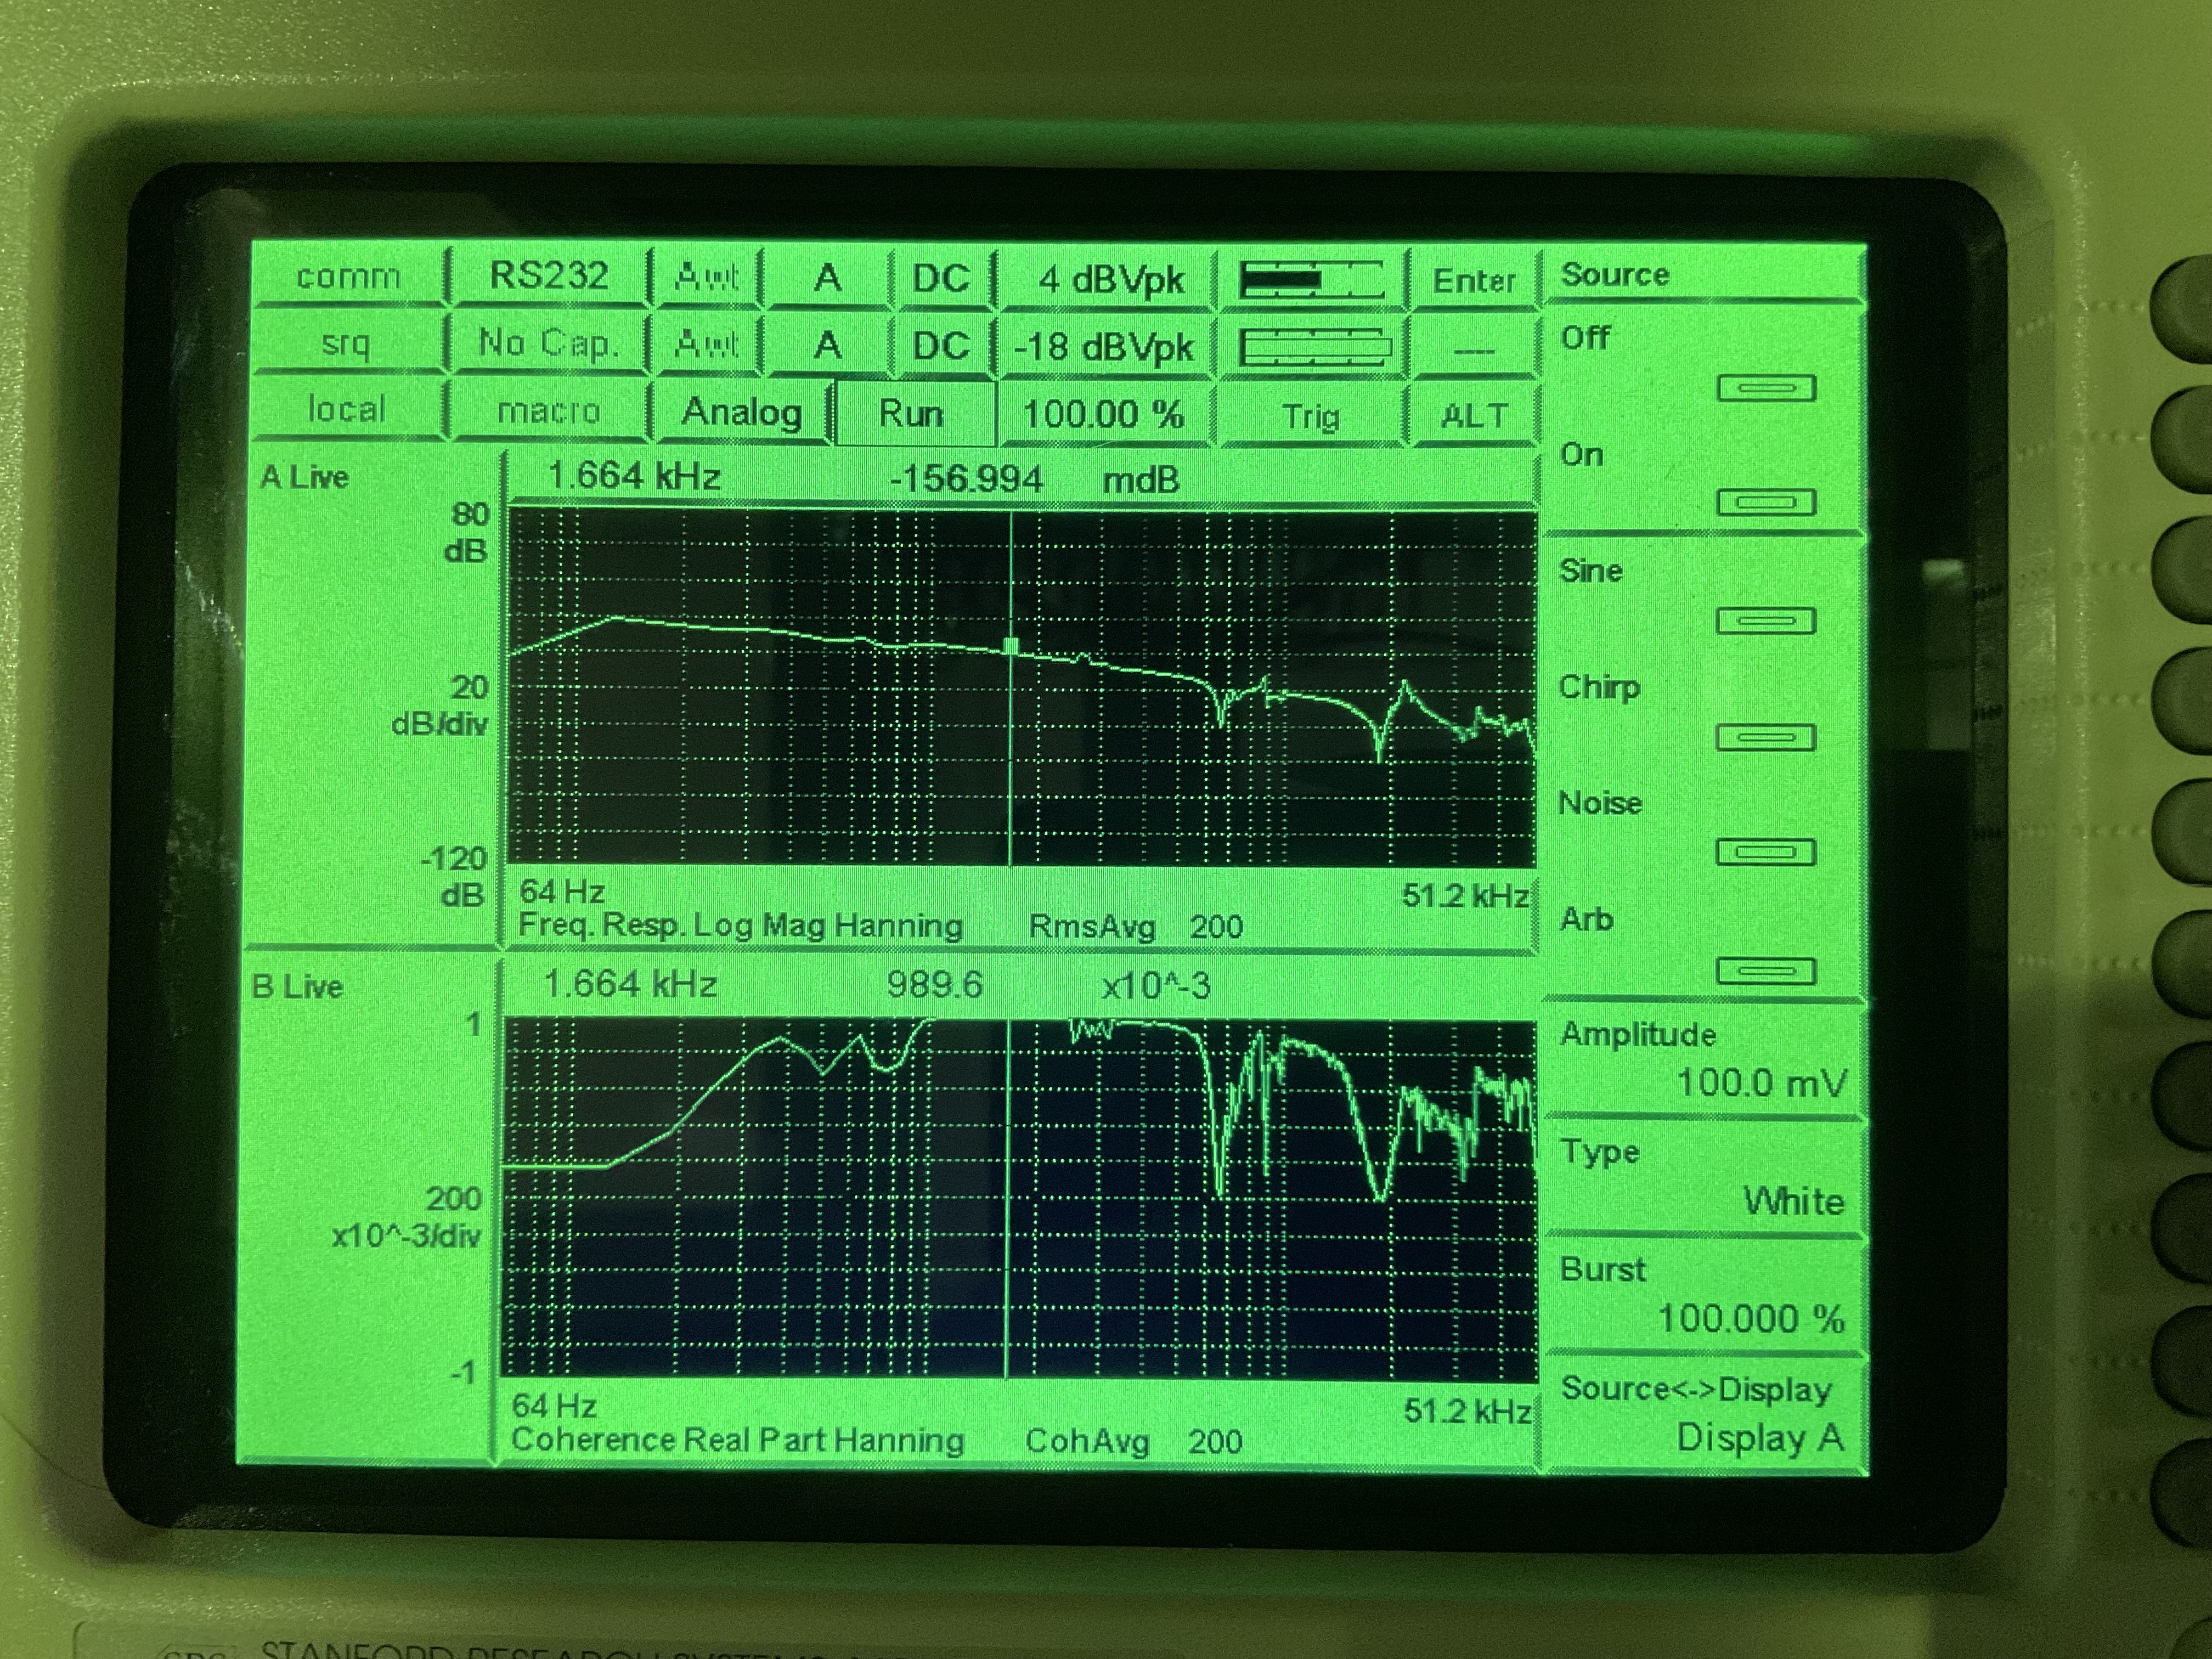
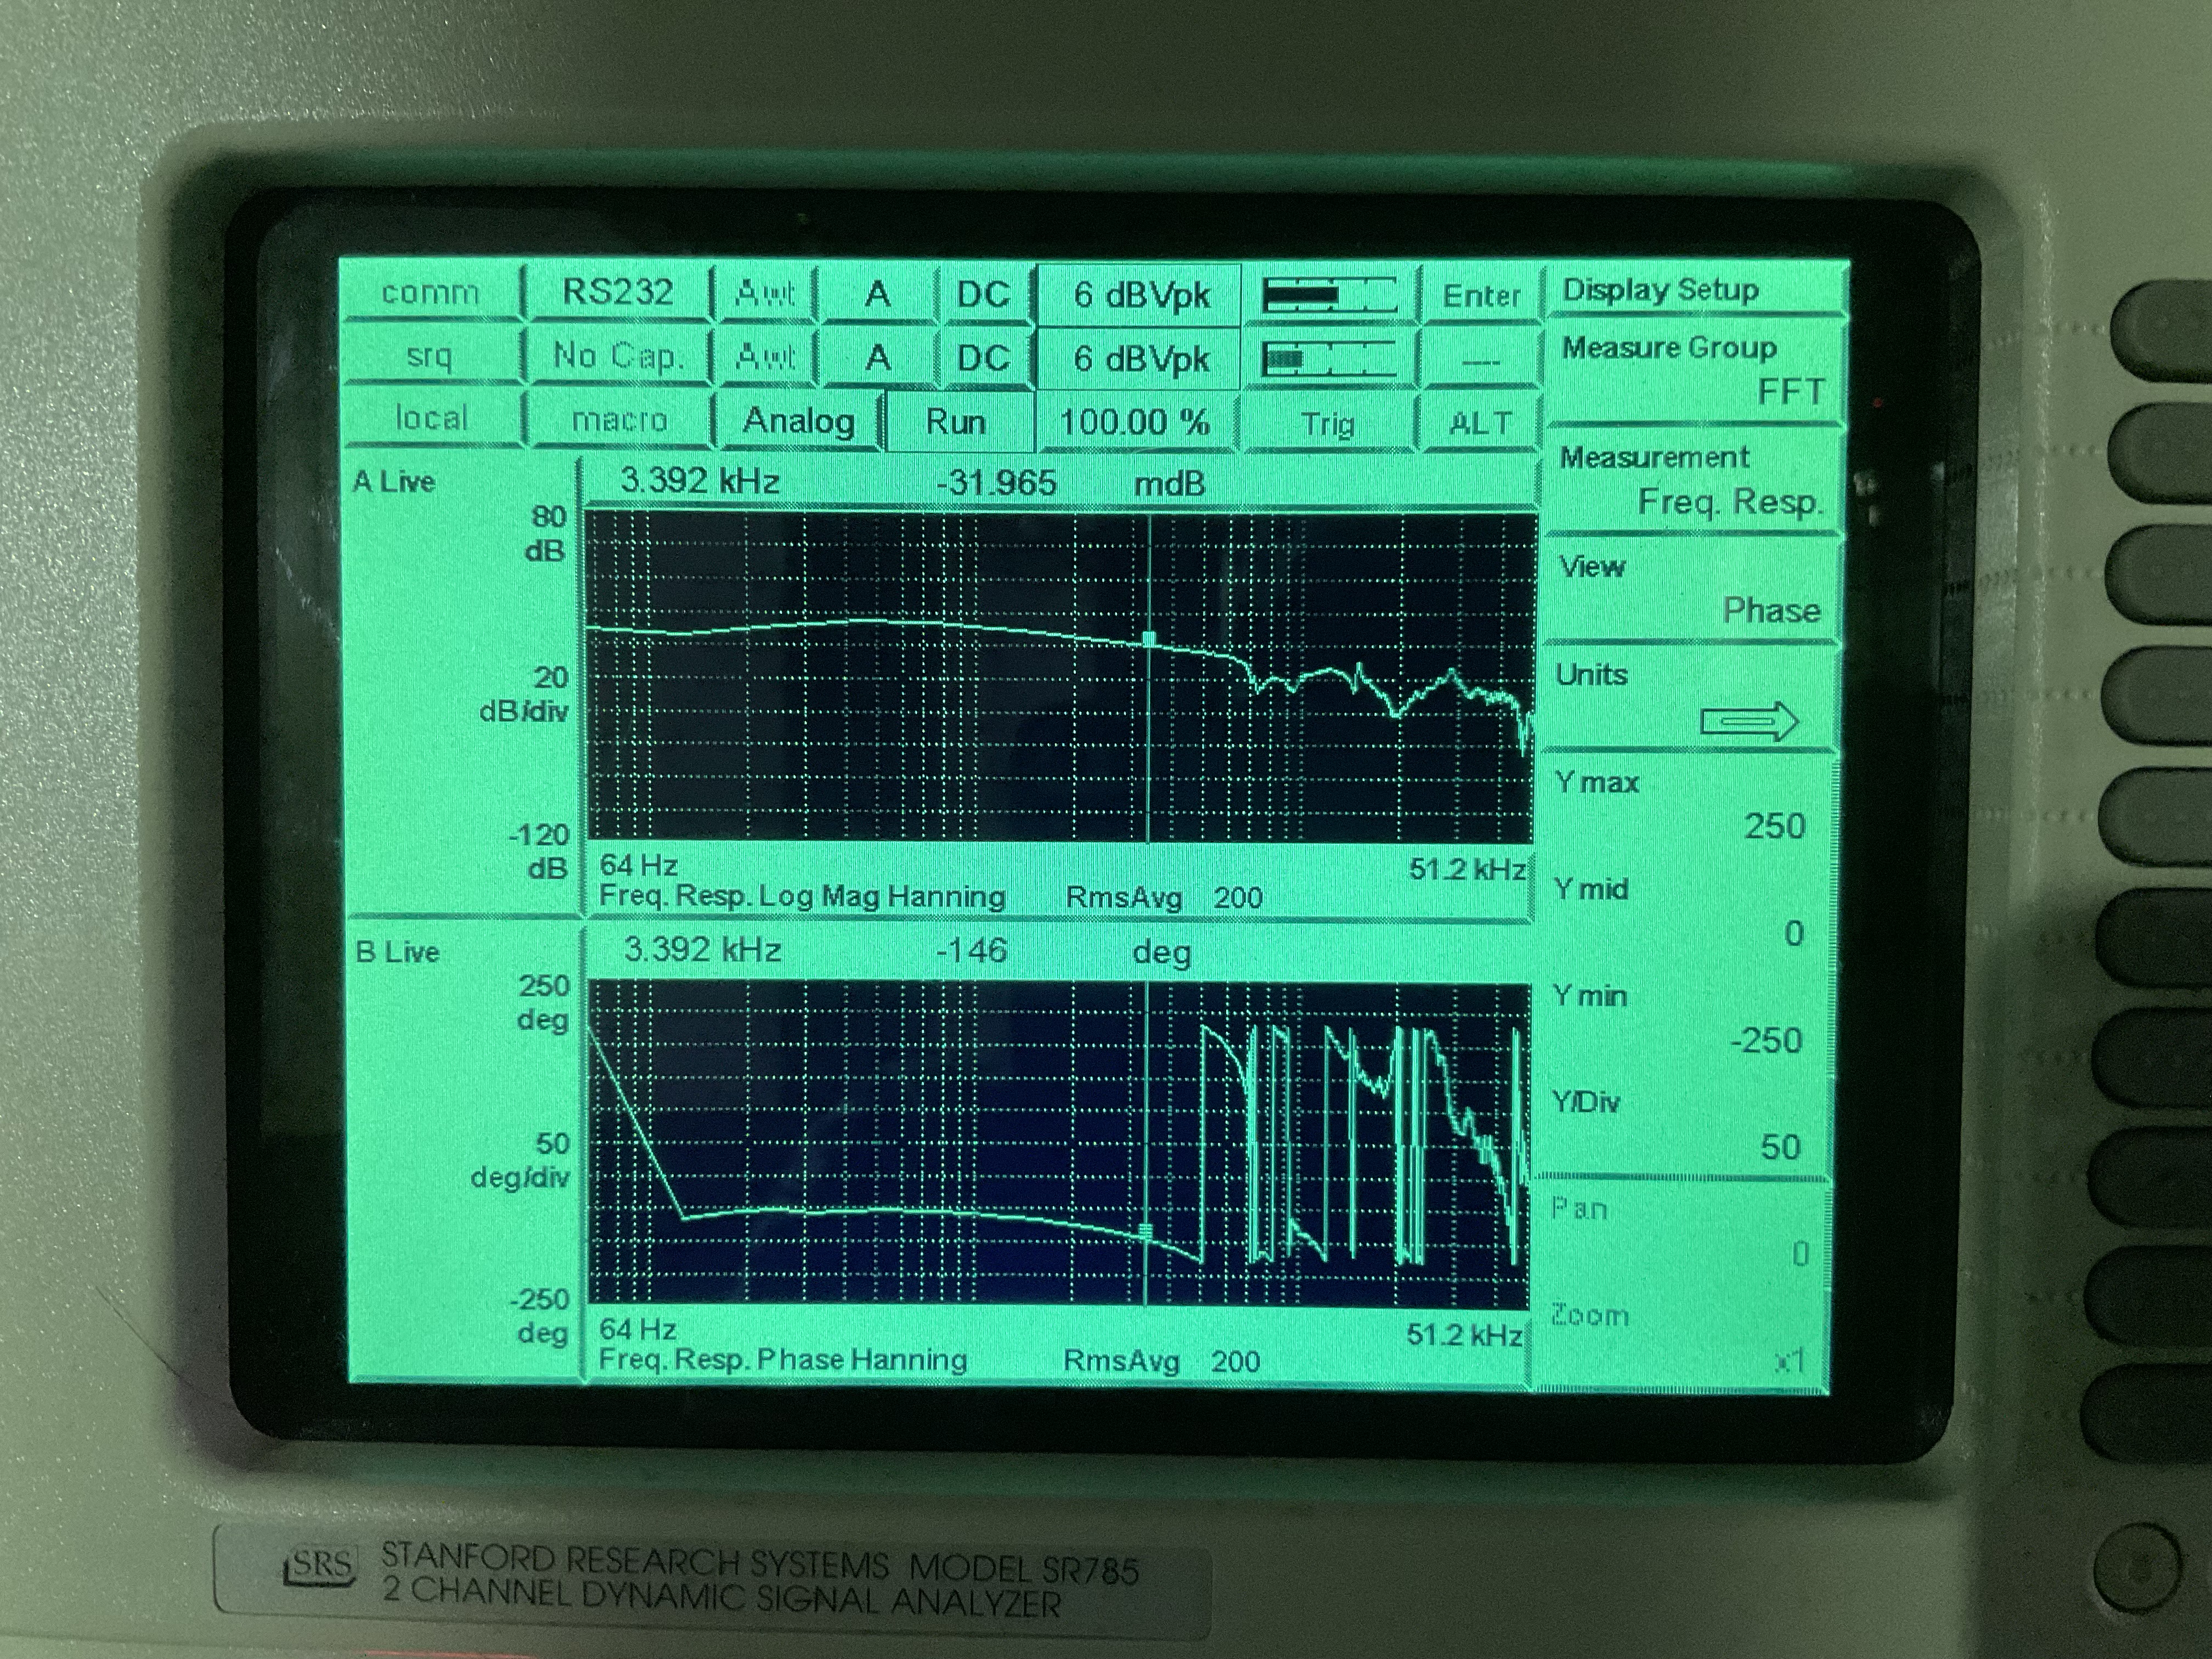
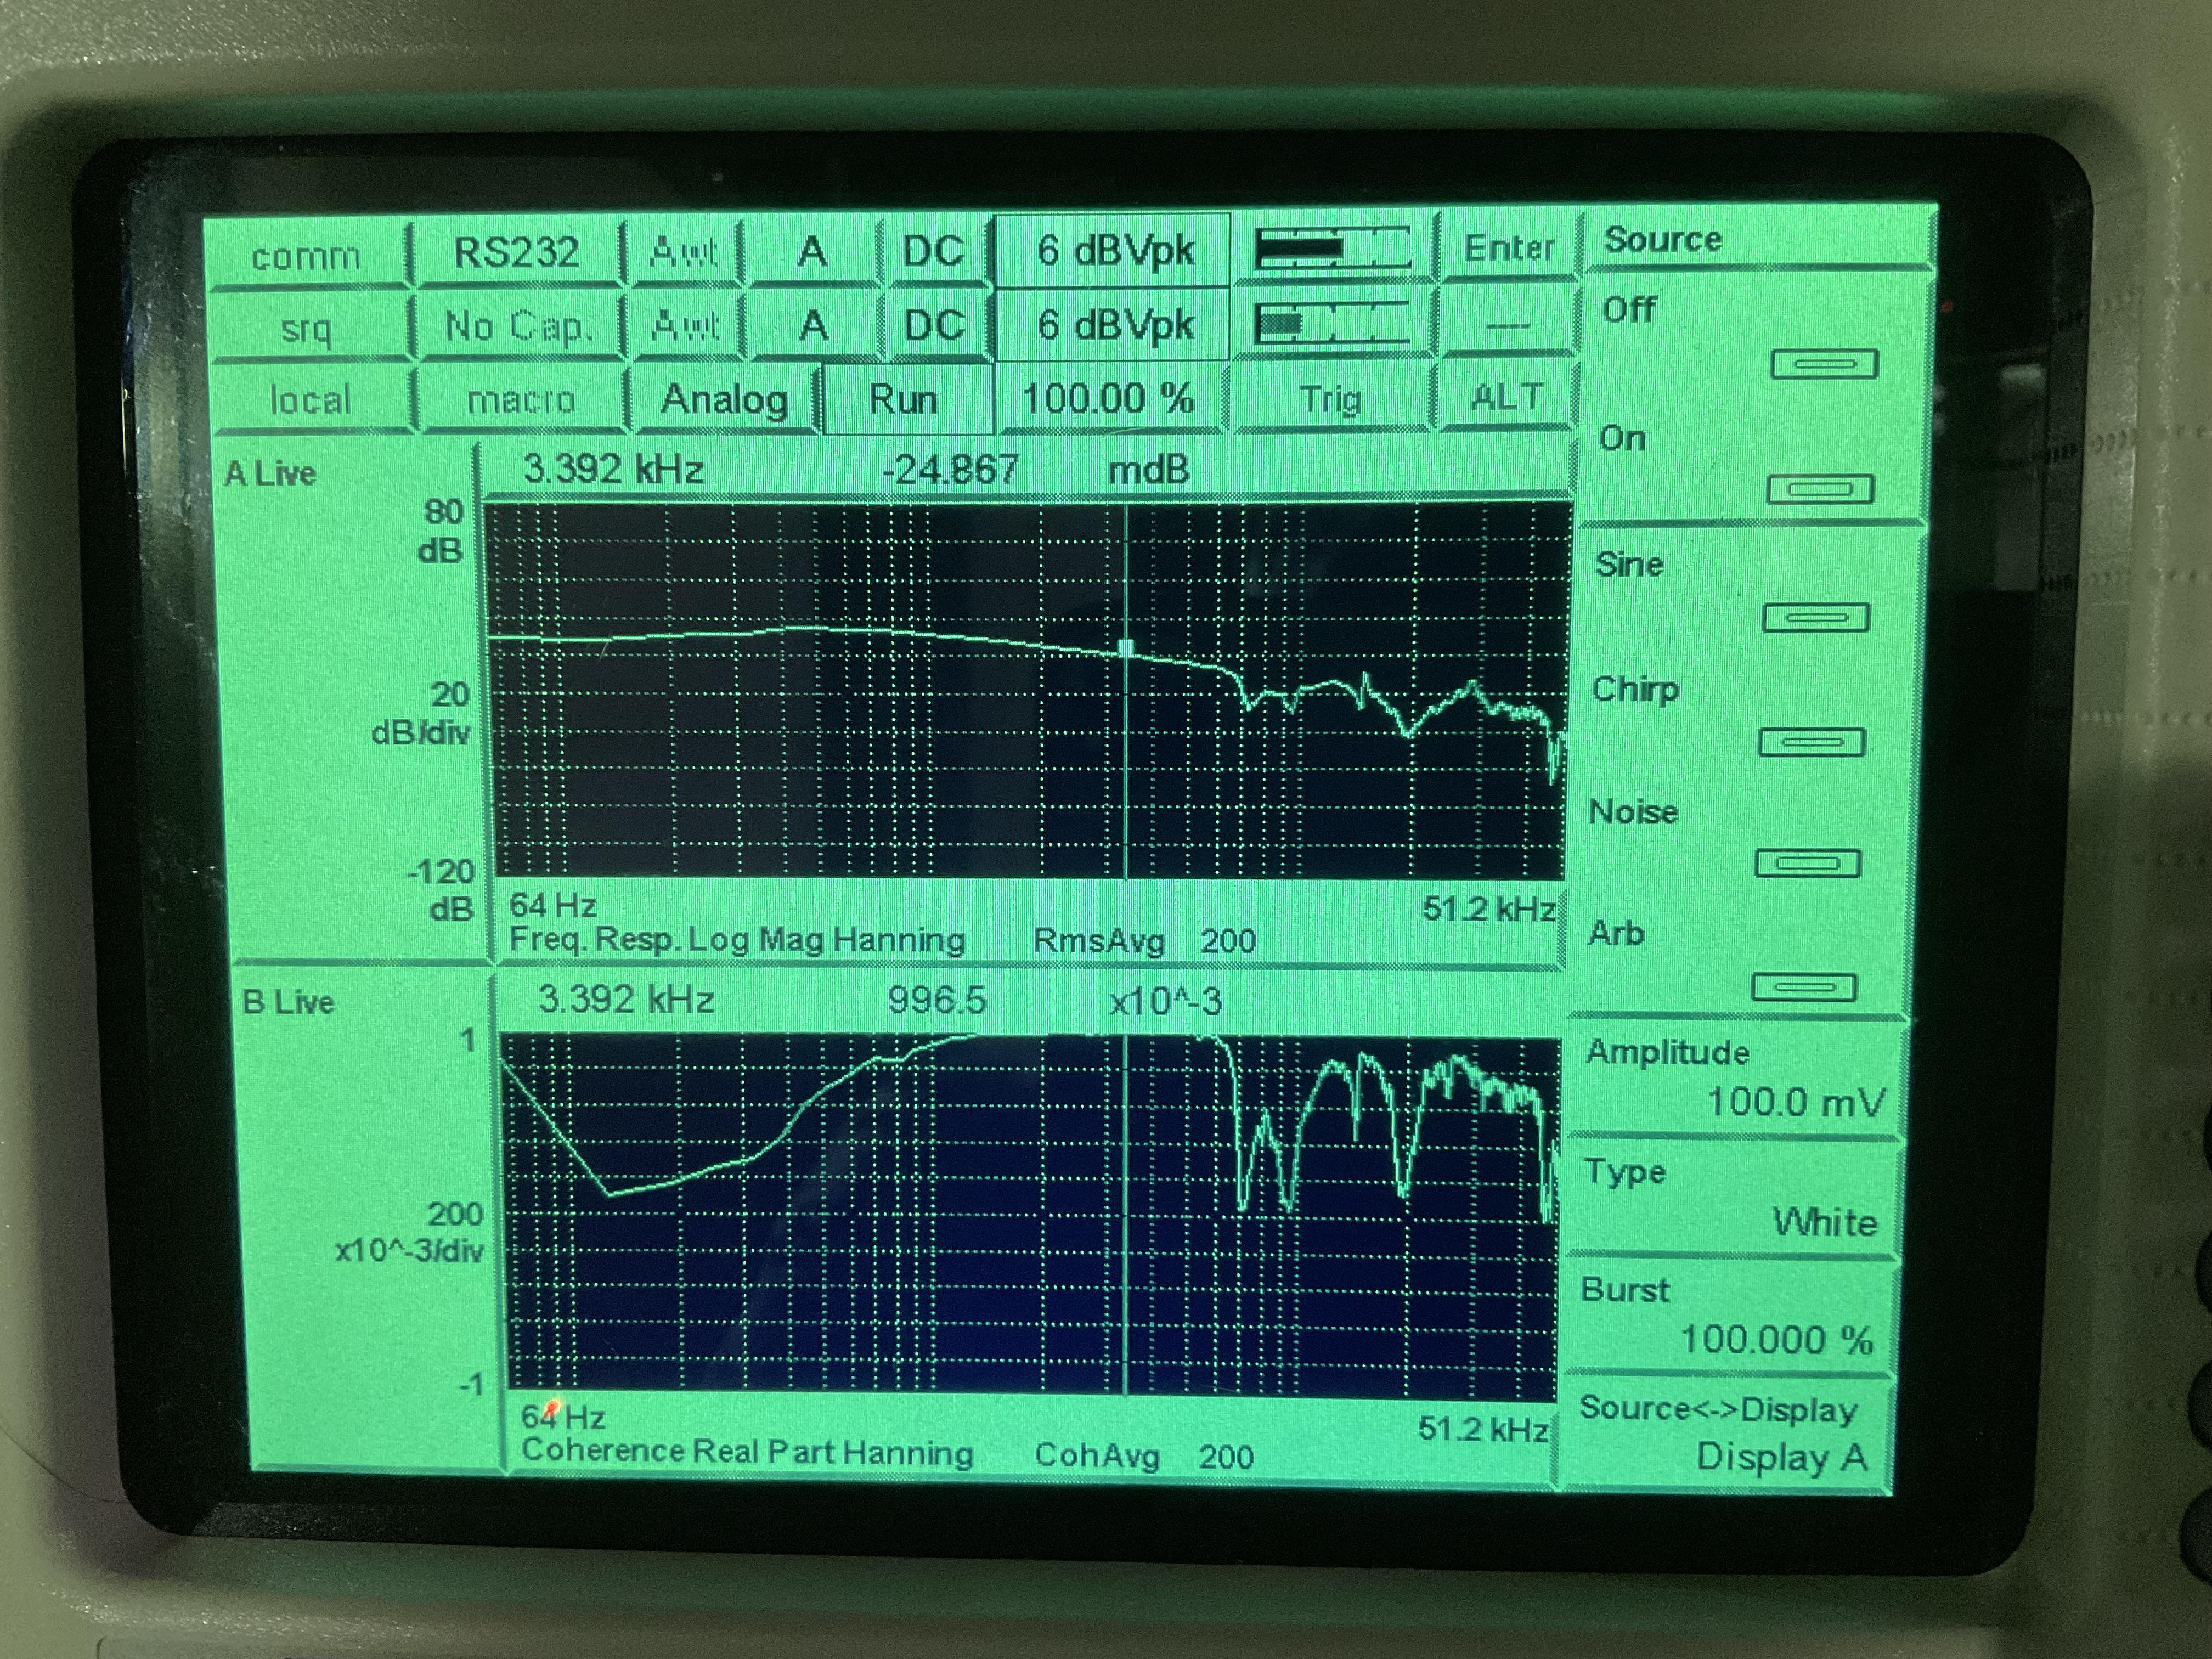
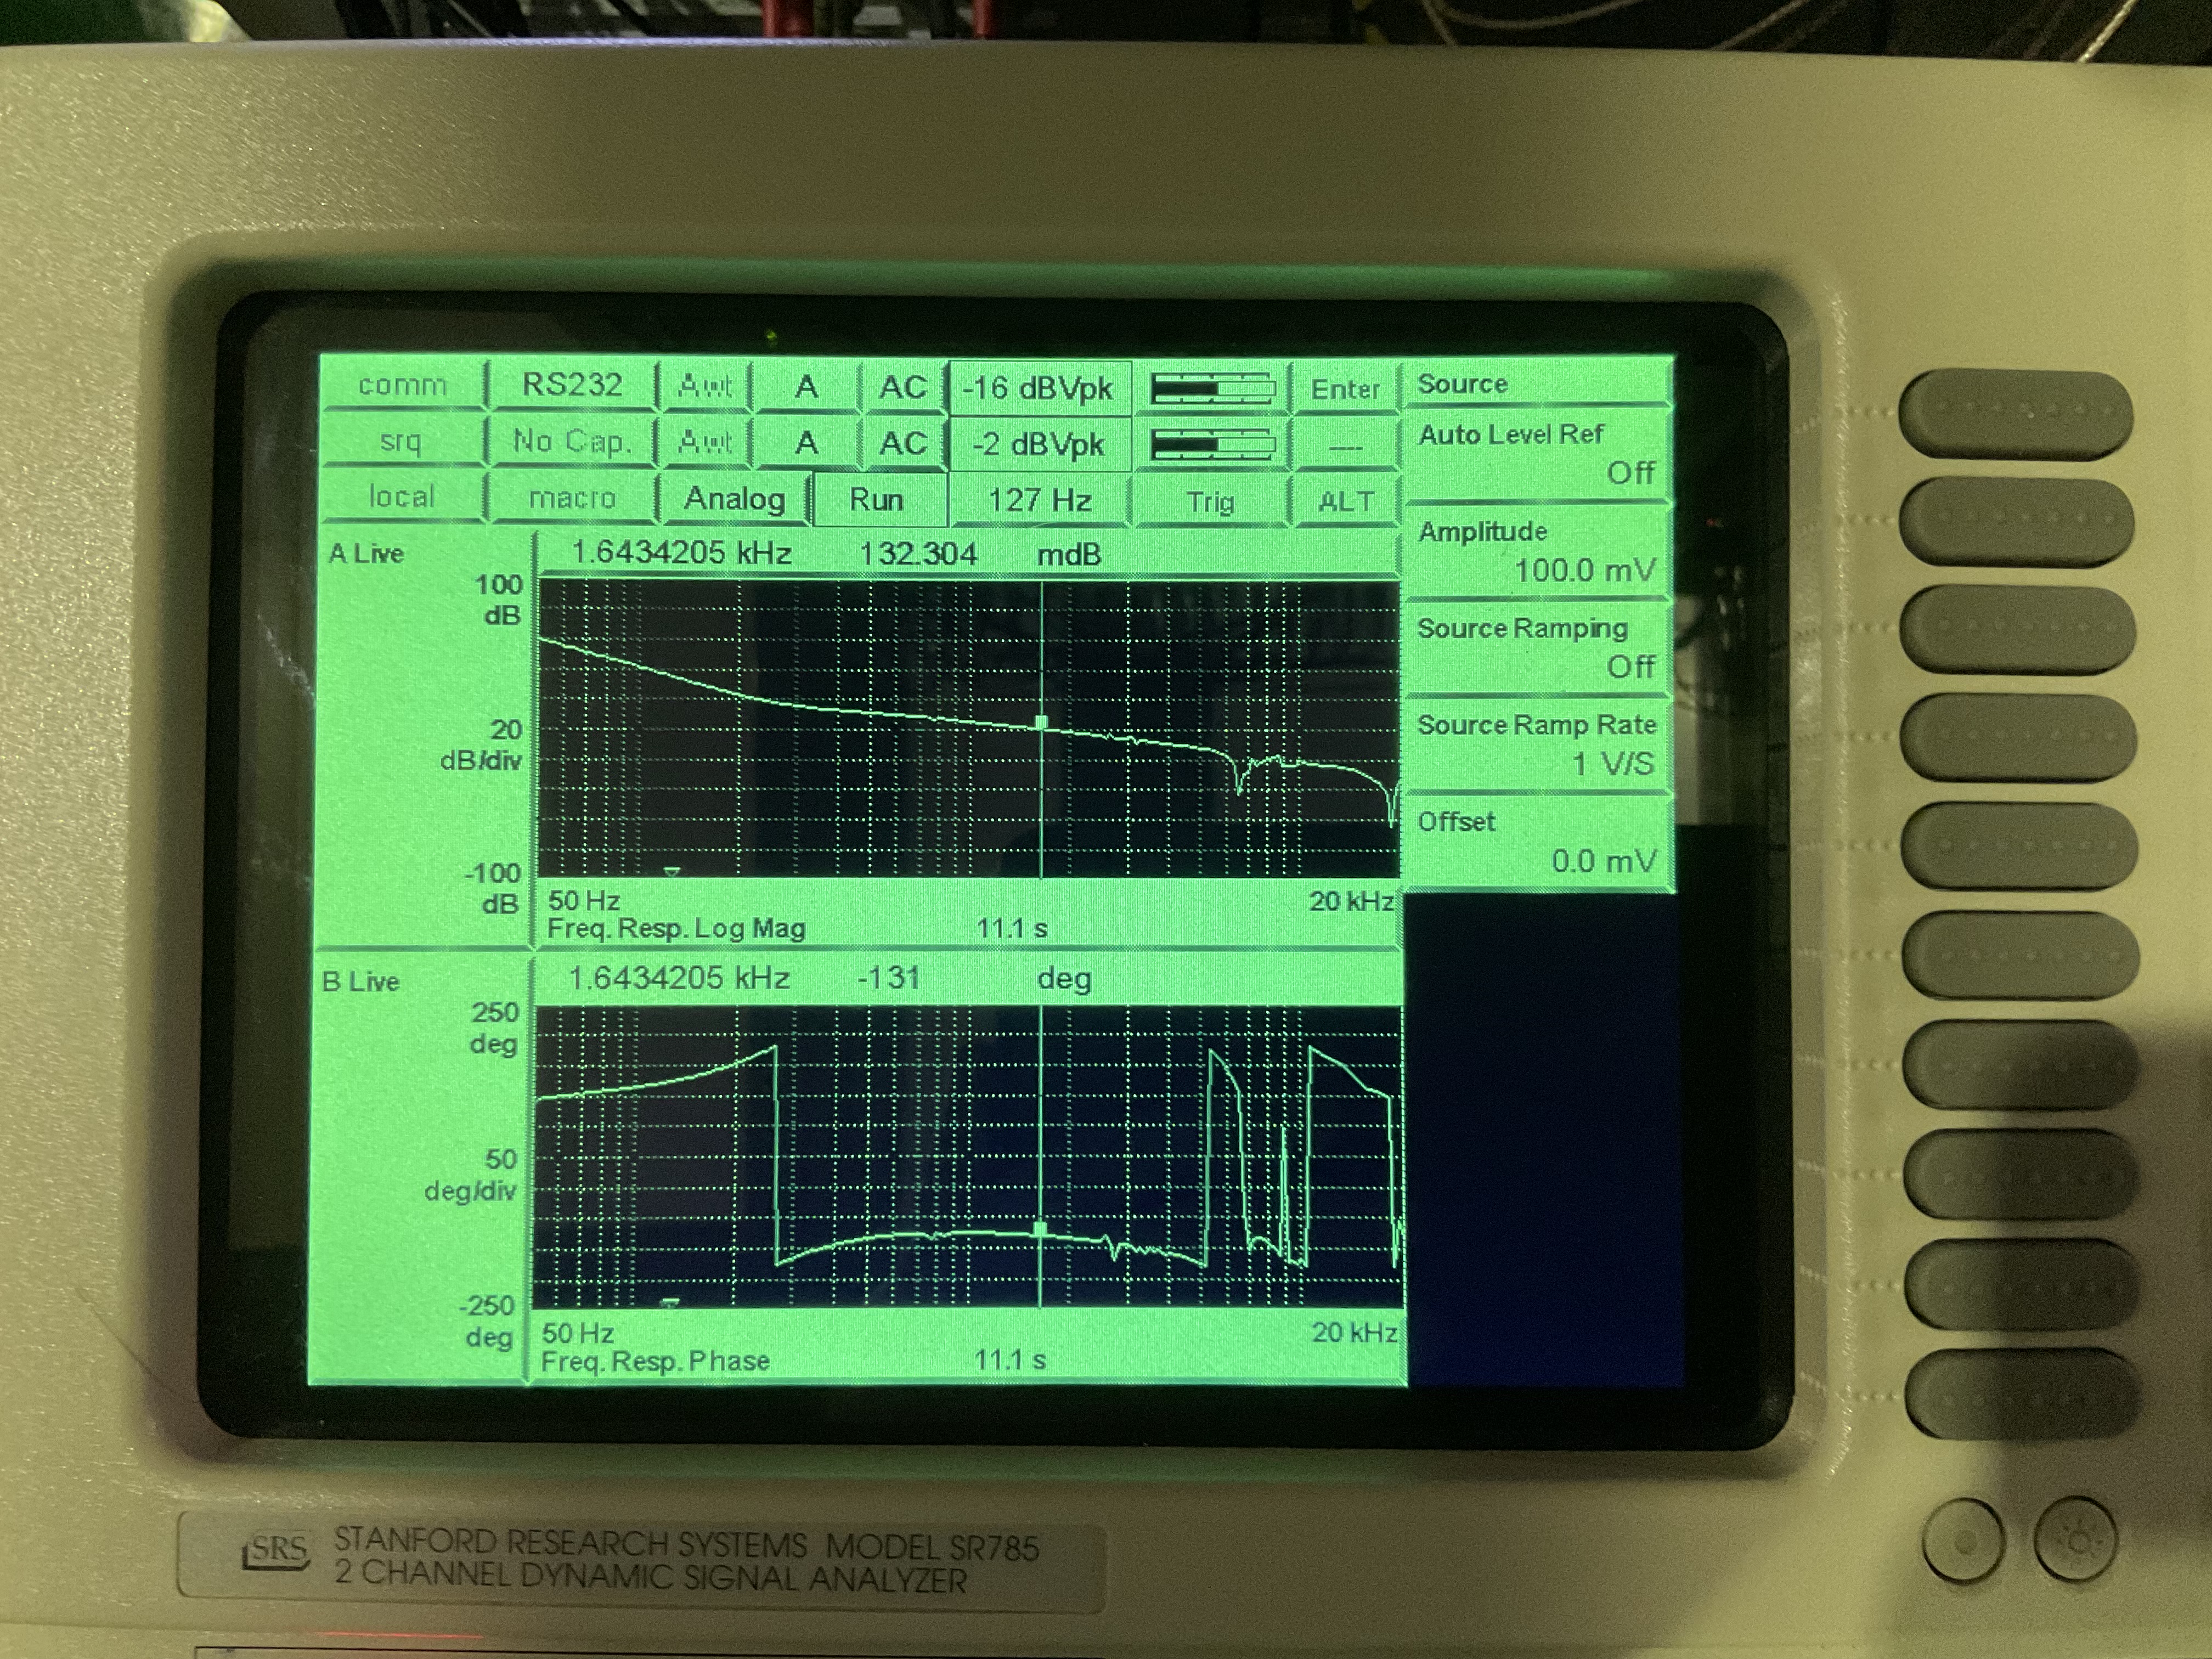
I measured the open loop transfer function EPS1/EPS2 of the SHG (fig 1, 2) and GRMC (fig 3, 4) using FFT mode of the spectrum analyzer and injecting about 100 mW noise to PERTURB IN. The coherence is basically 1 around the unity gain frequency. I also checked the SHG transfer function with swept sine mode and it gives basically the same result (fig 5). The SHG unity gain frequency is a bit low. Nominally it should be between 2-3 kHz (Aritomi thesis) but it sits about 1.6 kHz with 50 degrees phase margin when set to 0.09 gain. However, increasing the gain further past 0.1 makes the SHG oscillate quite a lot, even though the sticker on the servo says 0.2 indicating a former optimal setting. I set the GRMC gain to 0.8 which gives 3.4 kHz UGF with 45 degrees phase margin.
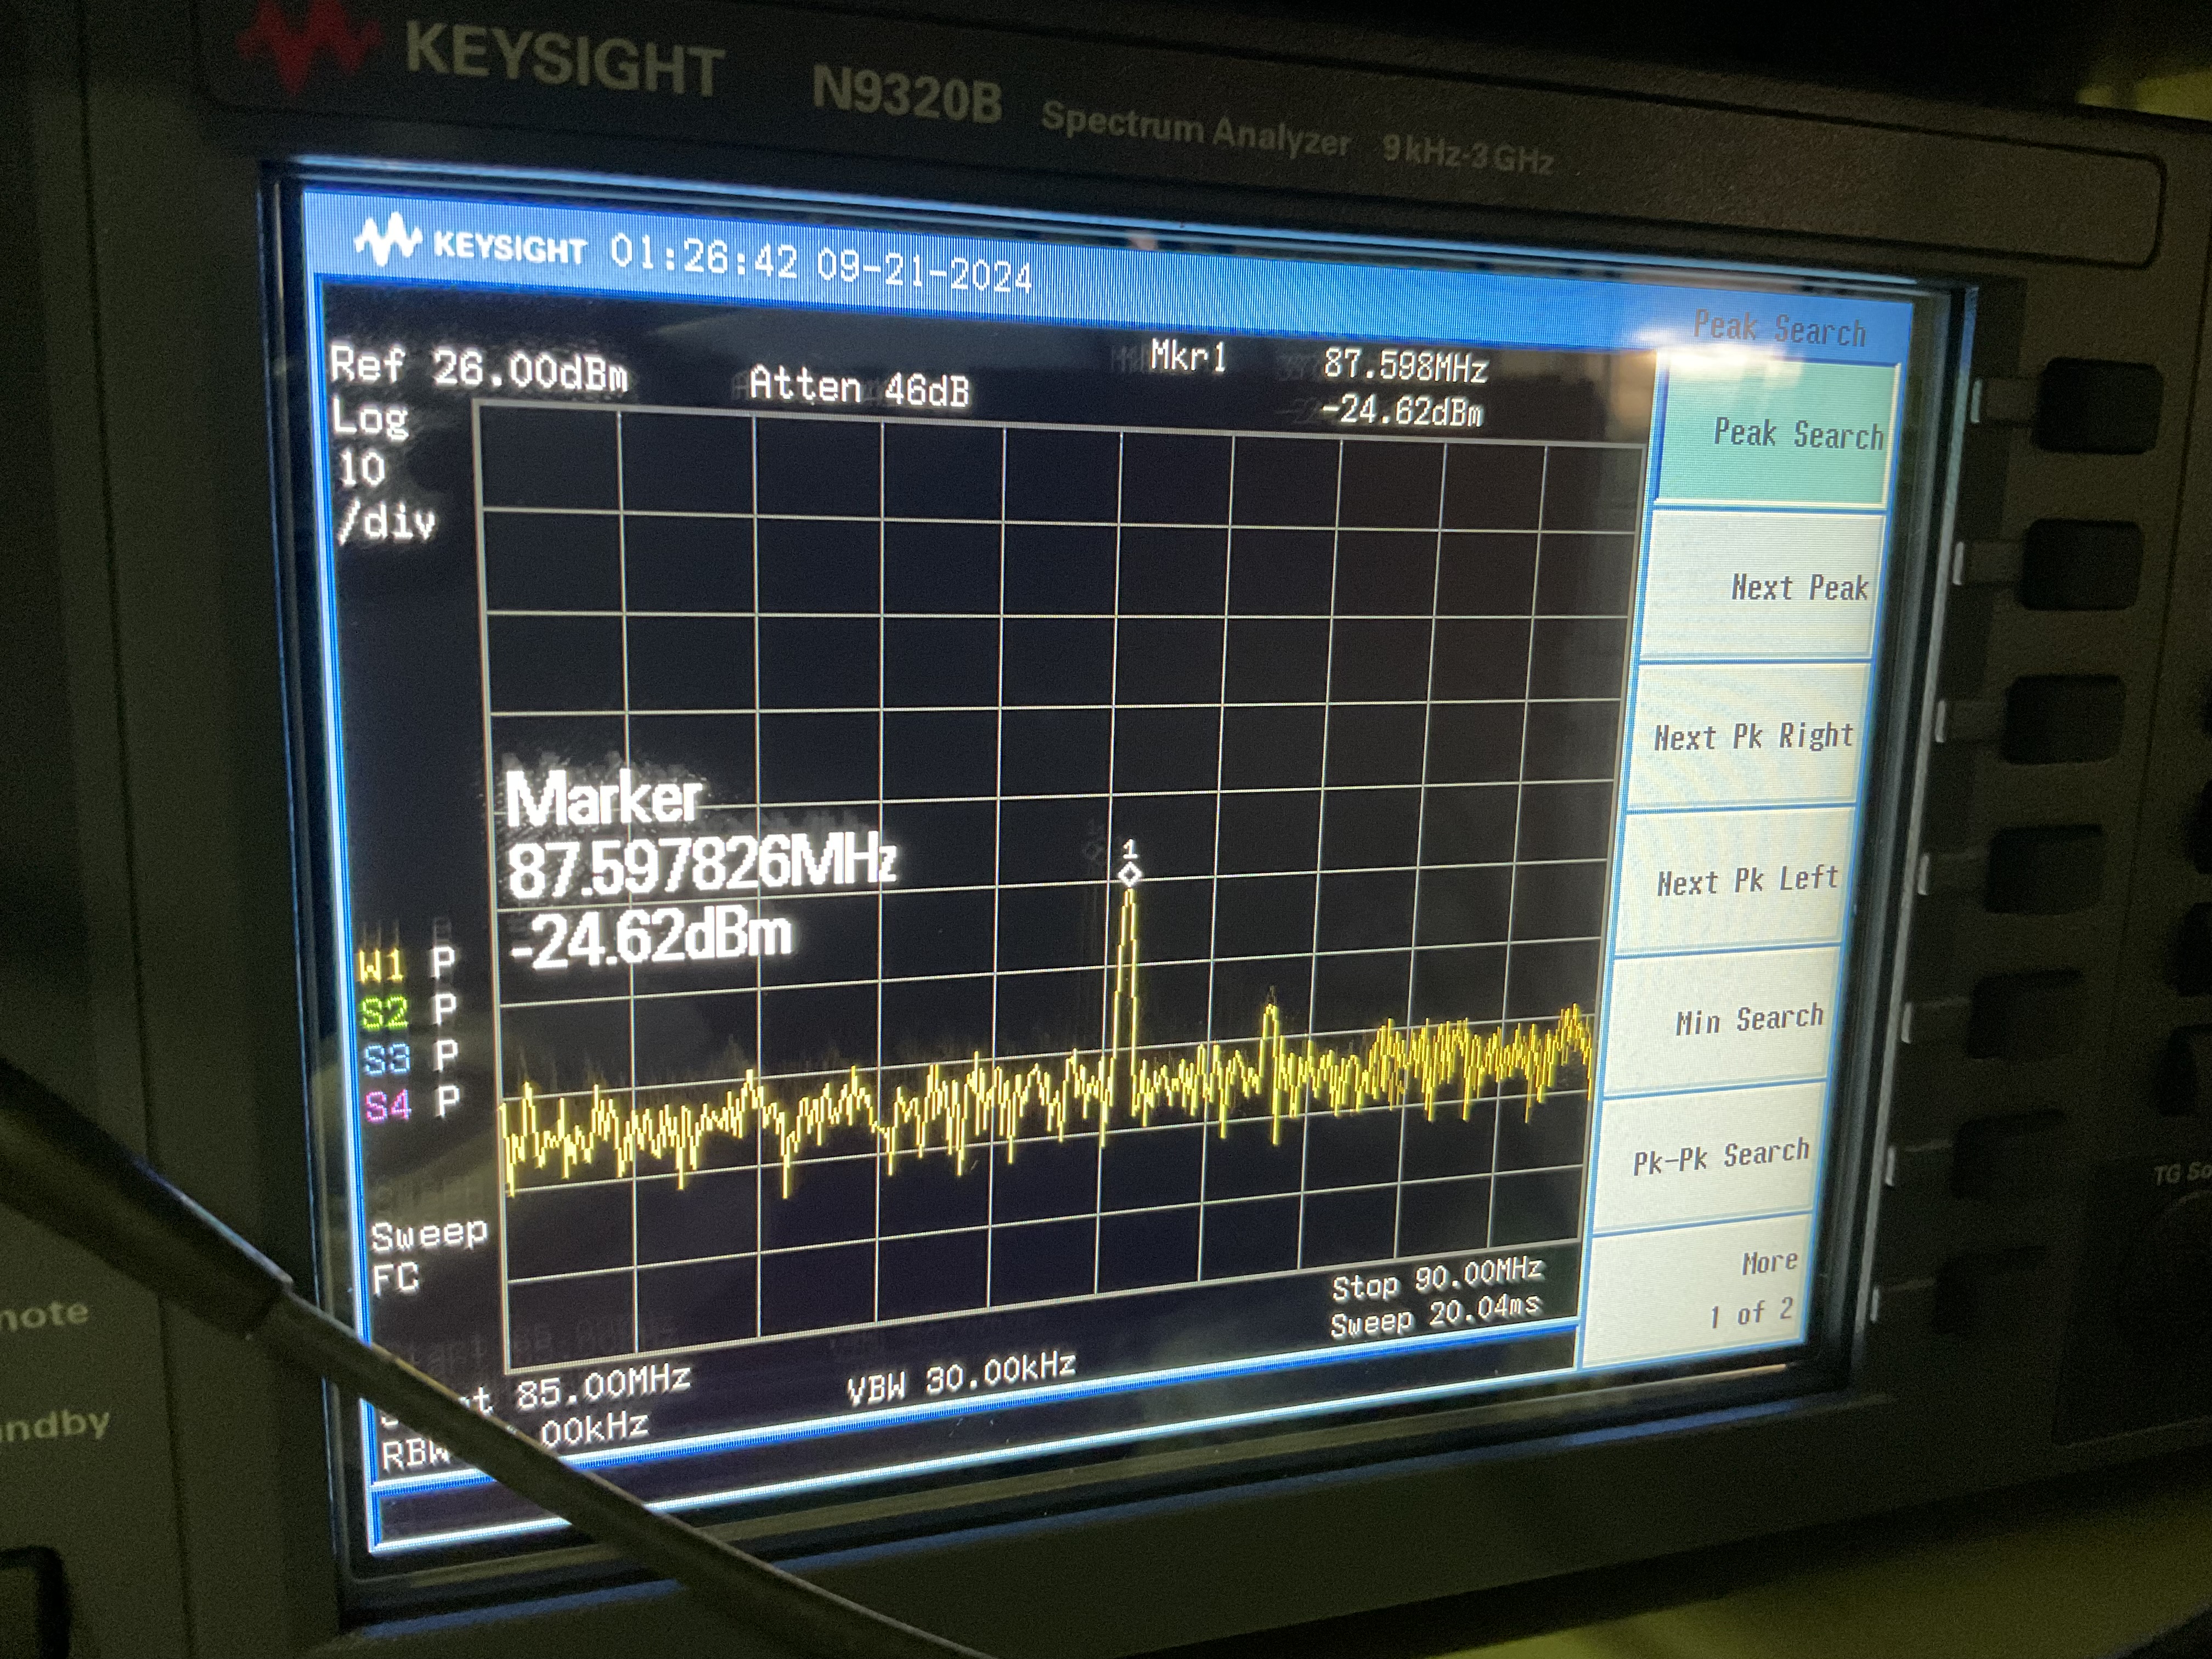
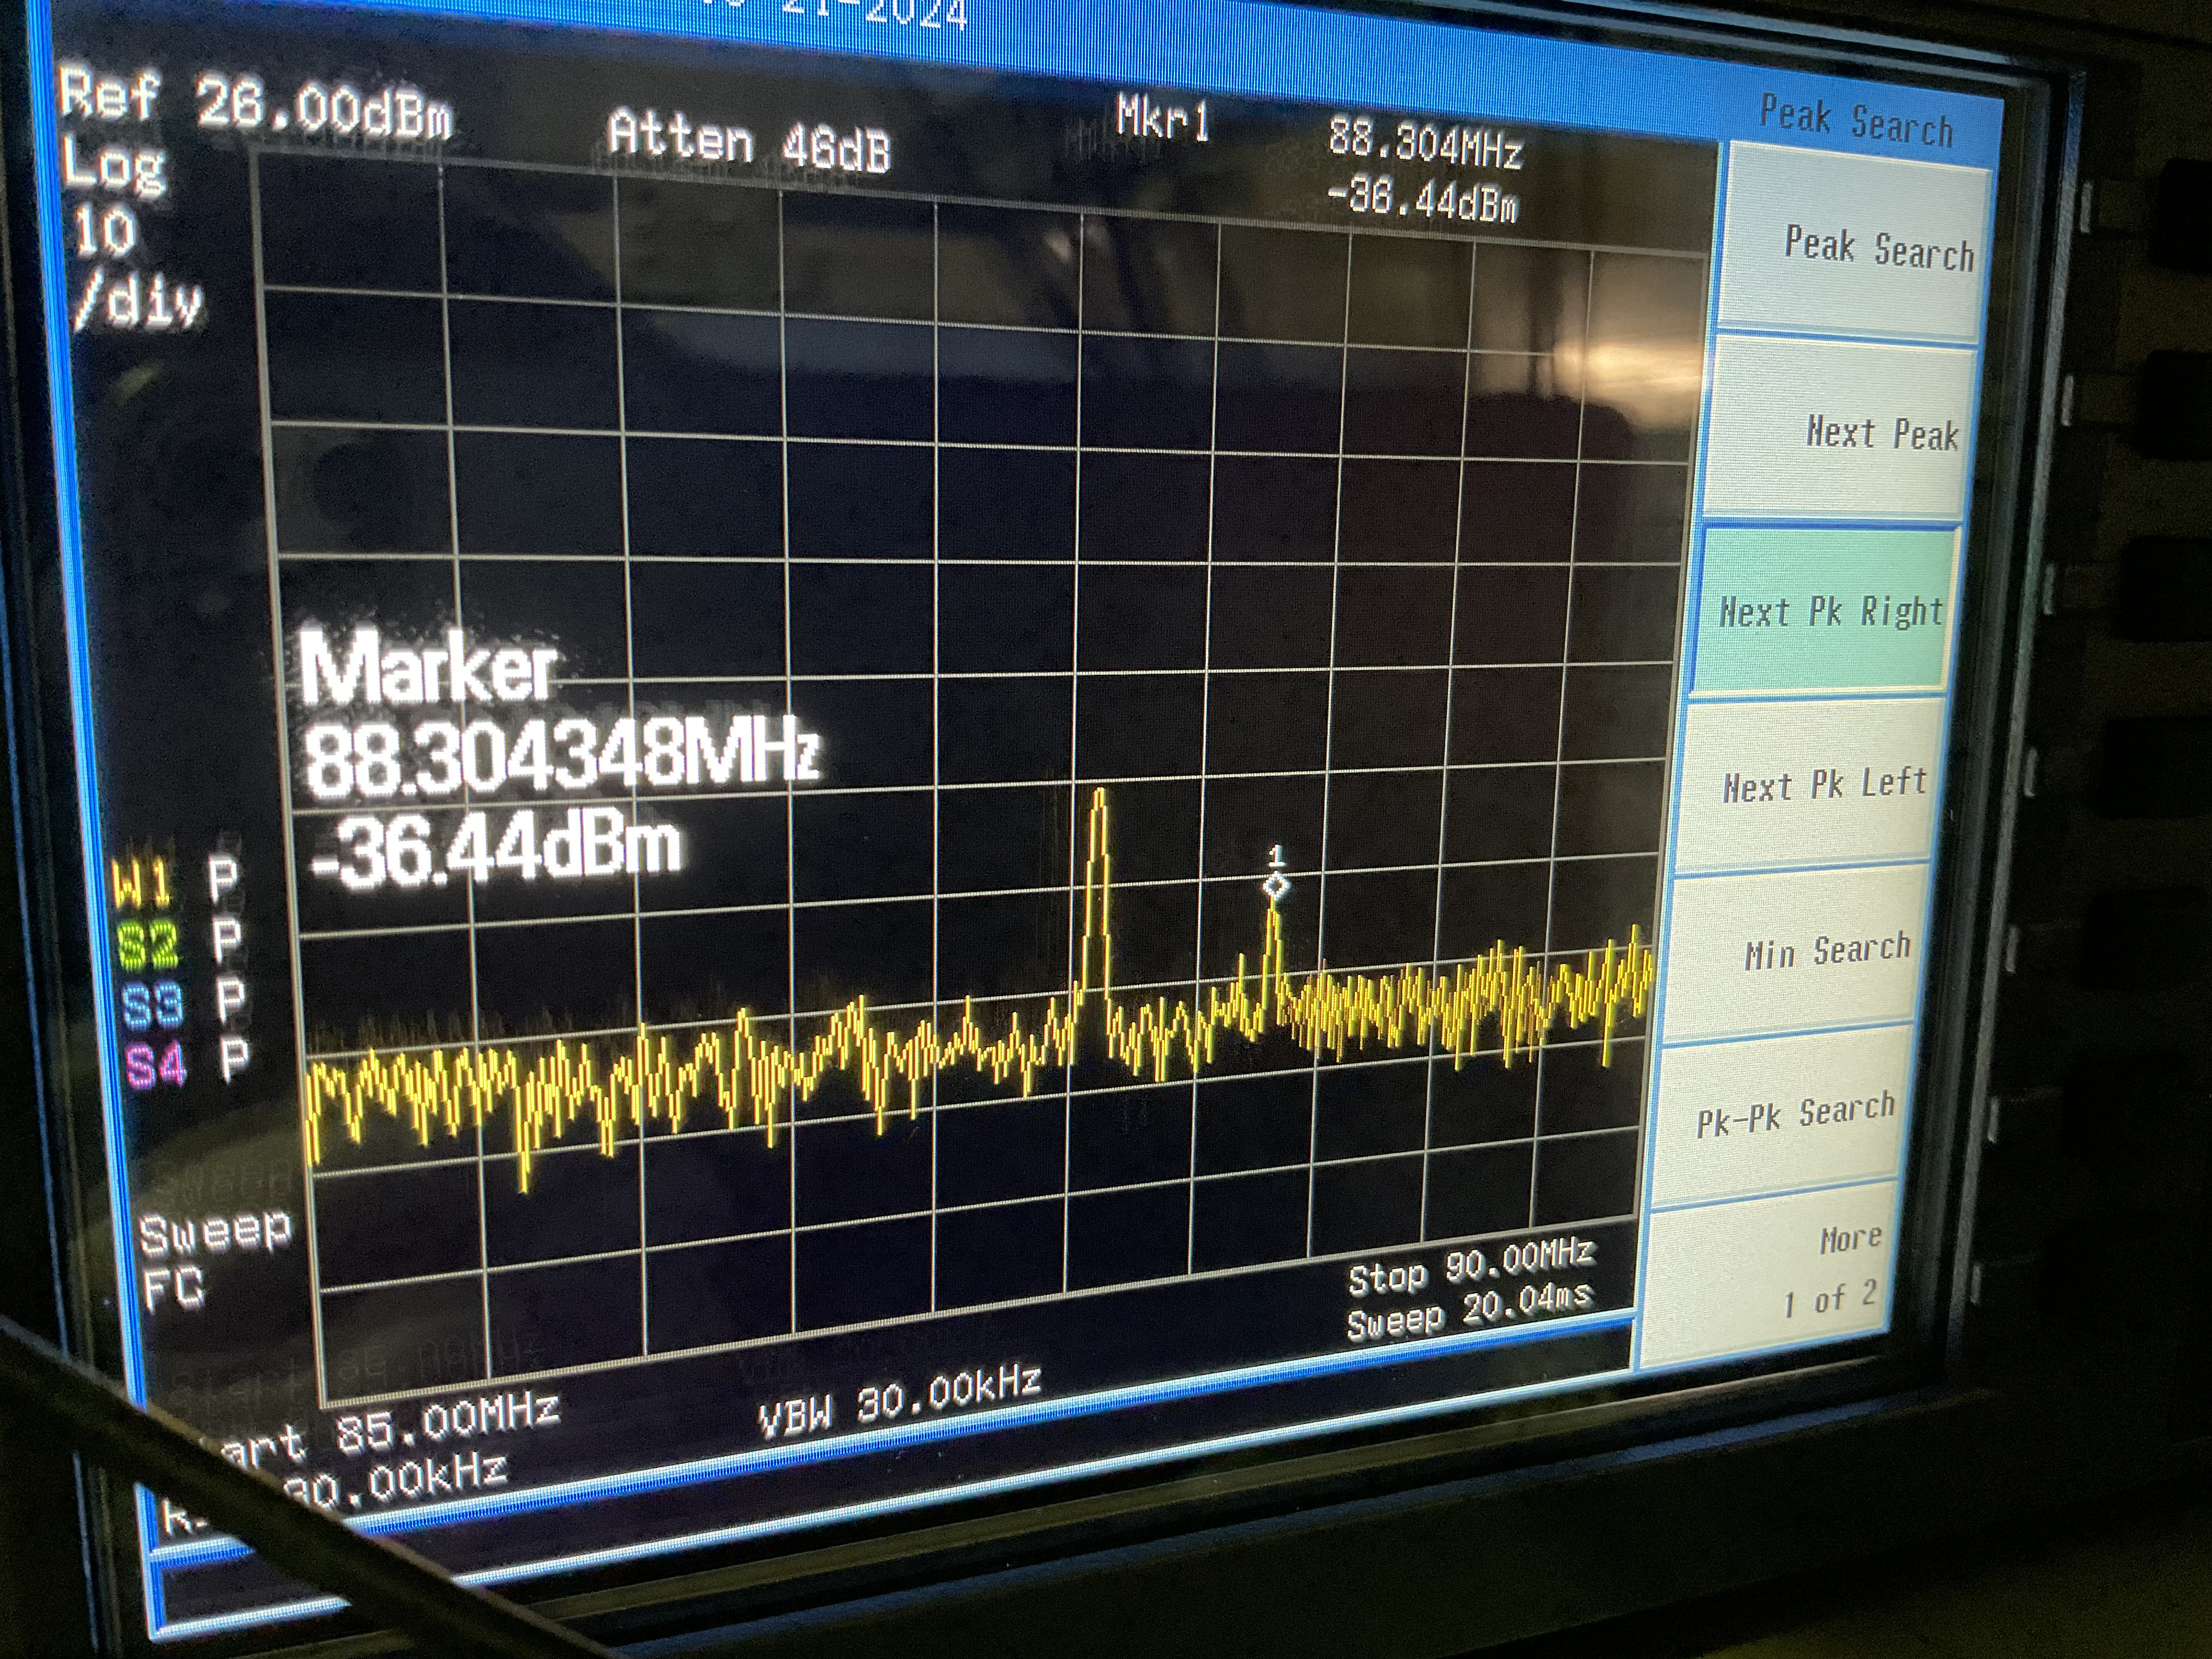
The GRMC error signal is clearly visible but also a bit noisy. It's quite curious that the GRMC signal shows up at 88 MHz (fig 6, 7), which is the modulation applied to the IR carrier, despite also propagating through three 1064 reflection dichroics. But evidently it has worked to lock the GRMC since the EOM replacement a while ago. I have a bit of difficulty in locking the GRMC to TEM00 though, a lot of the time it just locks to near zero transmission amplitude and I have to keep hitting the rest button a lot. when I managed to lock it with 4.2 MZ offset (stabilizing GRMC transmission to 25 mW) and noted the GRMC transmission level (GRMC TRANSMISS IN) of 316 mV. I set the GRMC threshold to about 100 mV which helps for avoiding HOMs but it's still not reliable for locking to TEM00.
The force constant k was evaluated as follows:
mg = kx
k = (delta mg) / (delta x) = ((0.06-0.03) * 9.8)/(0.01 * (28-27)) = 29.4
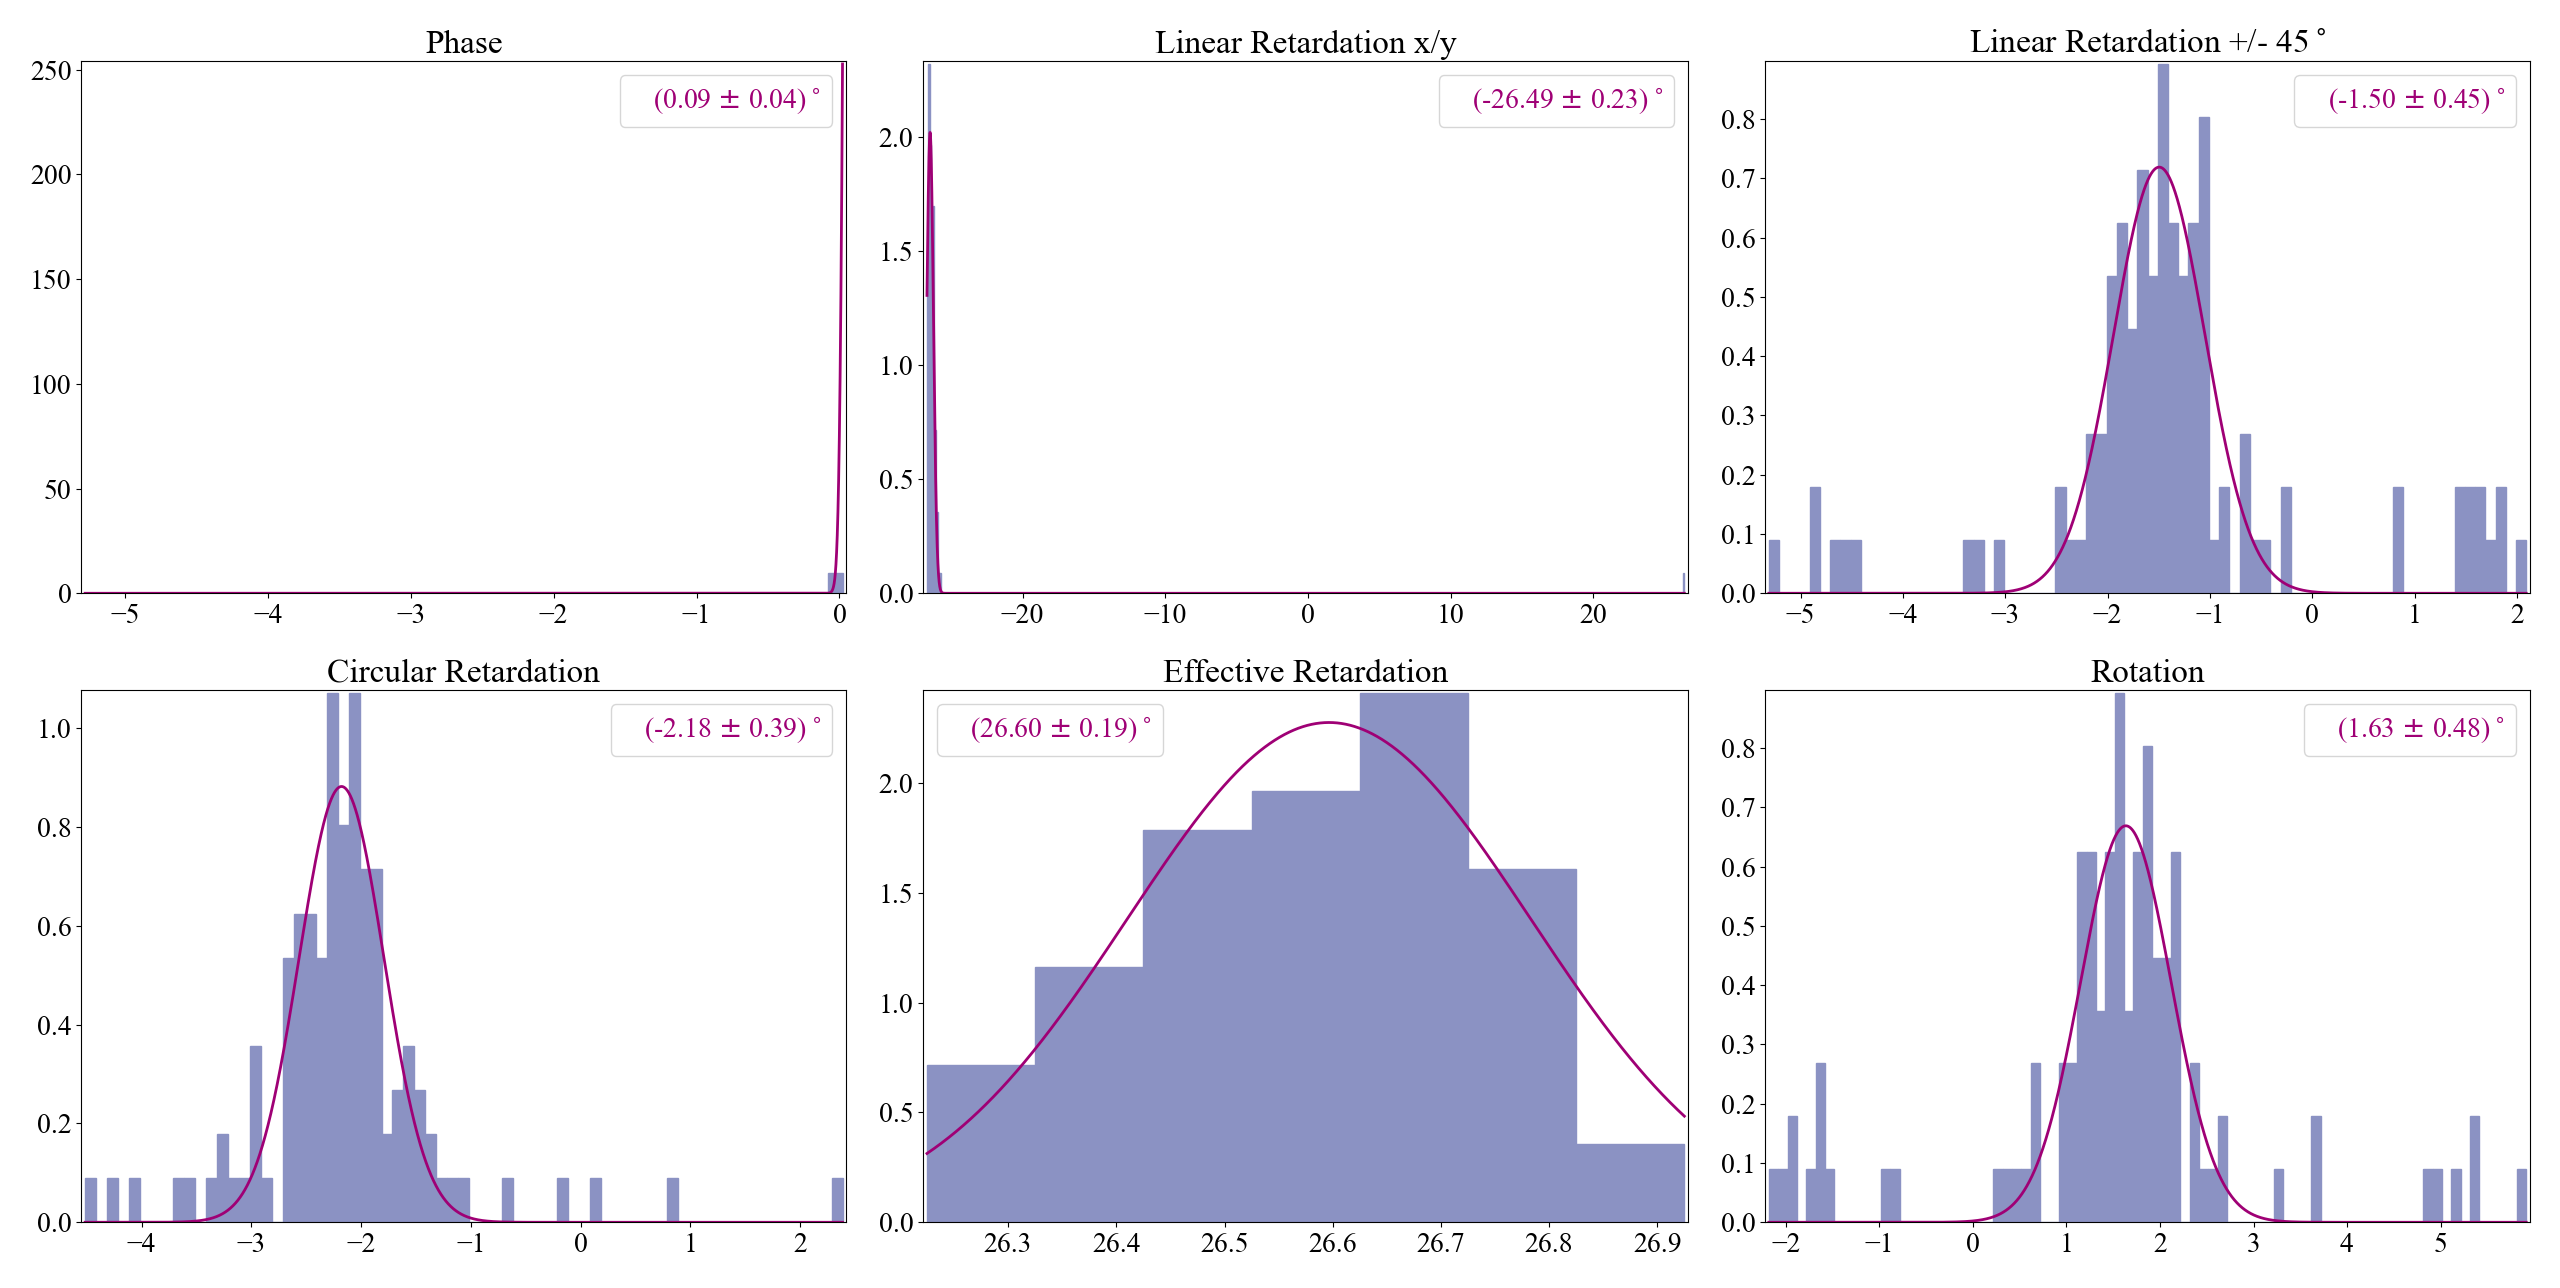
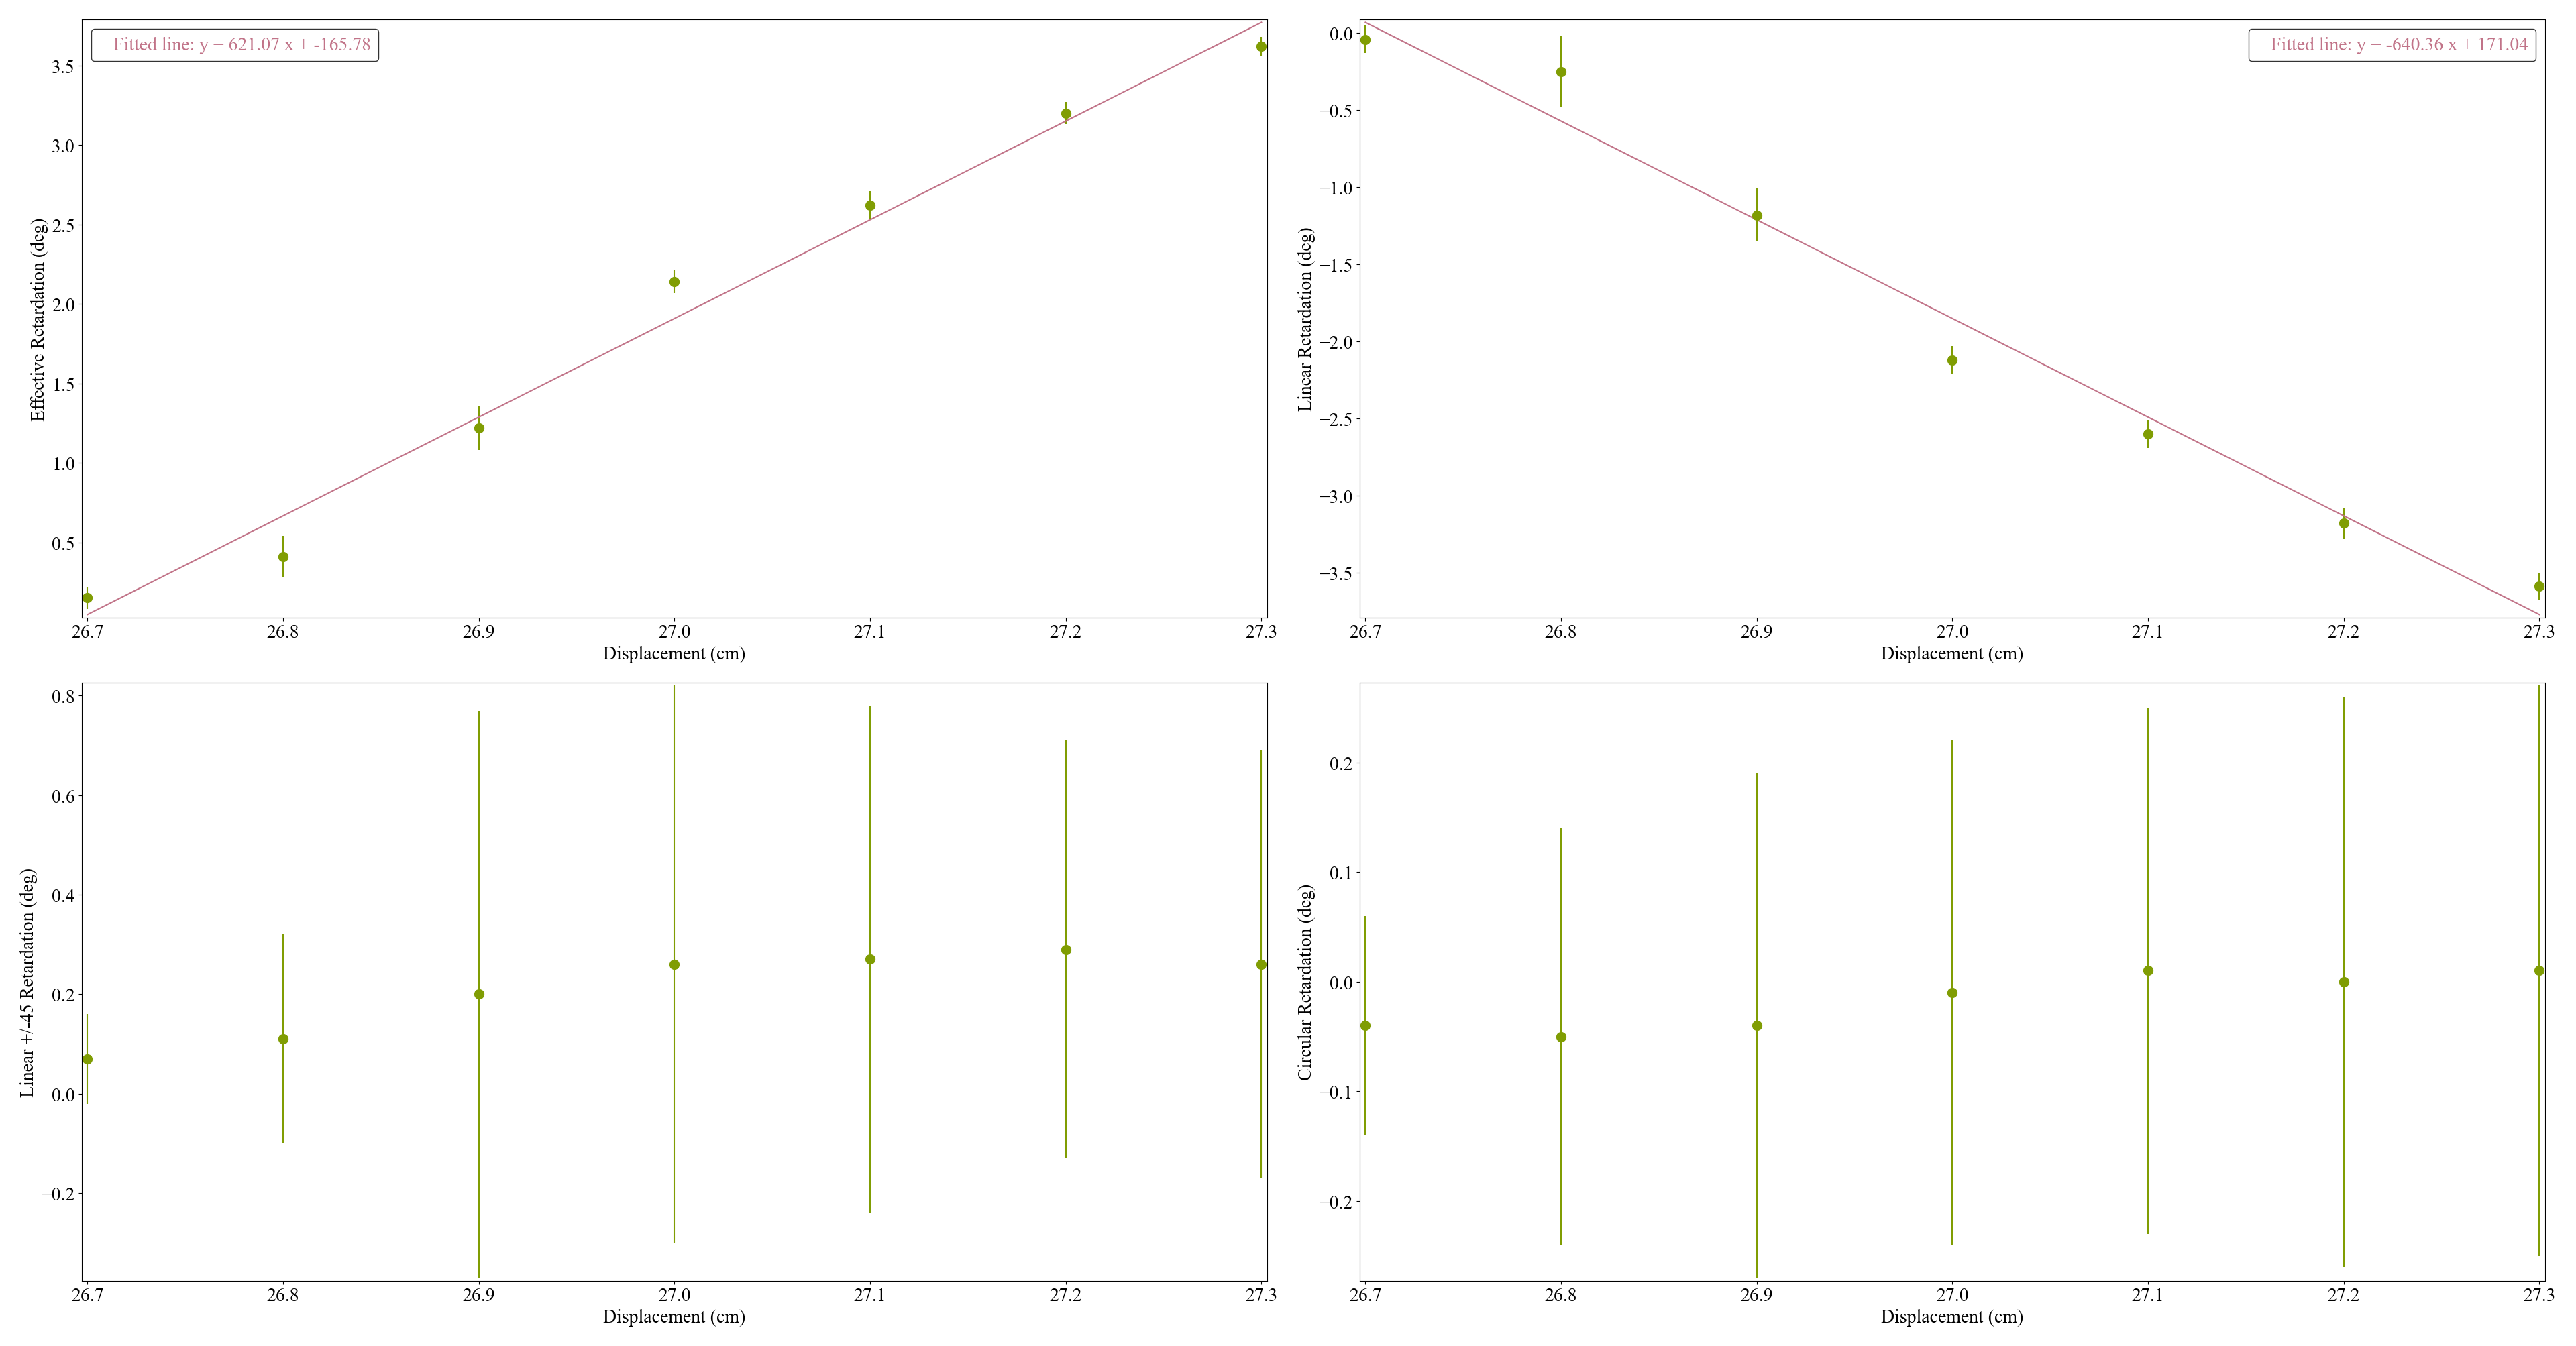
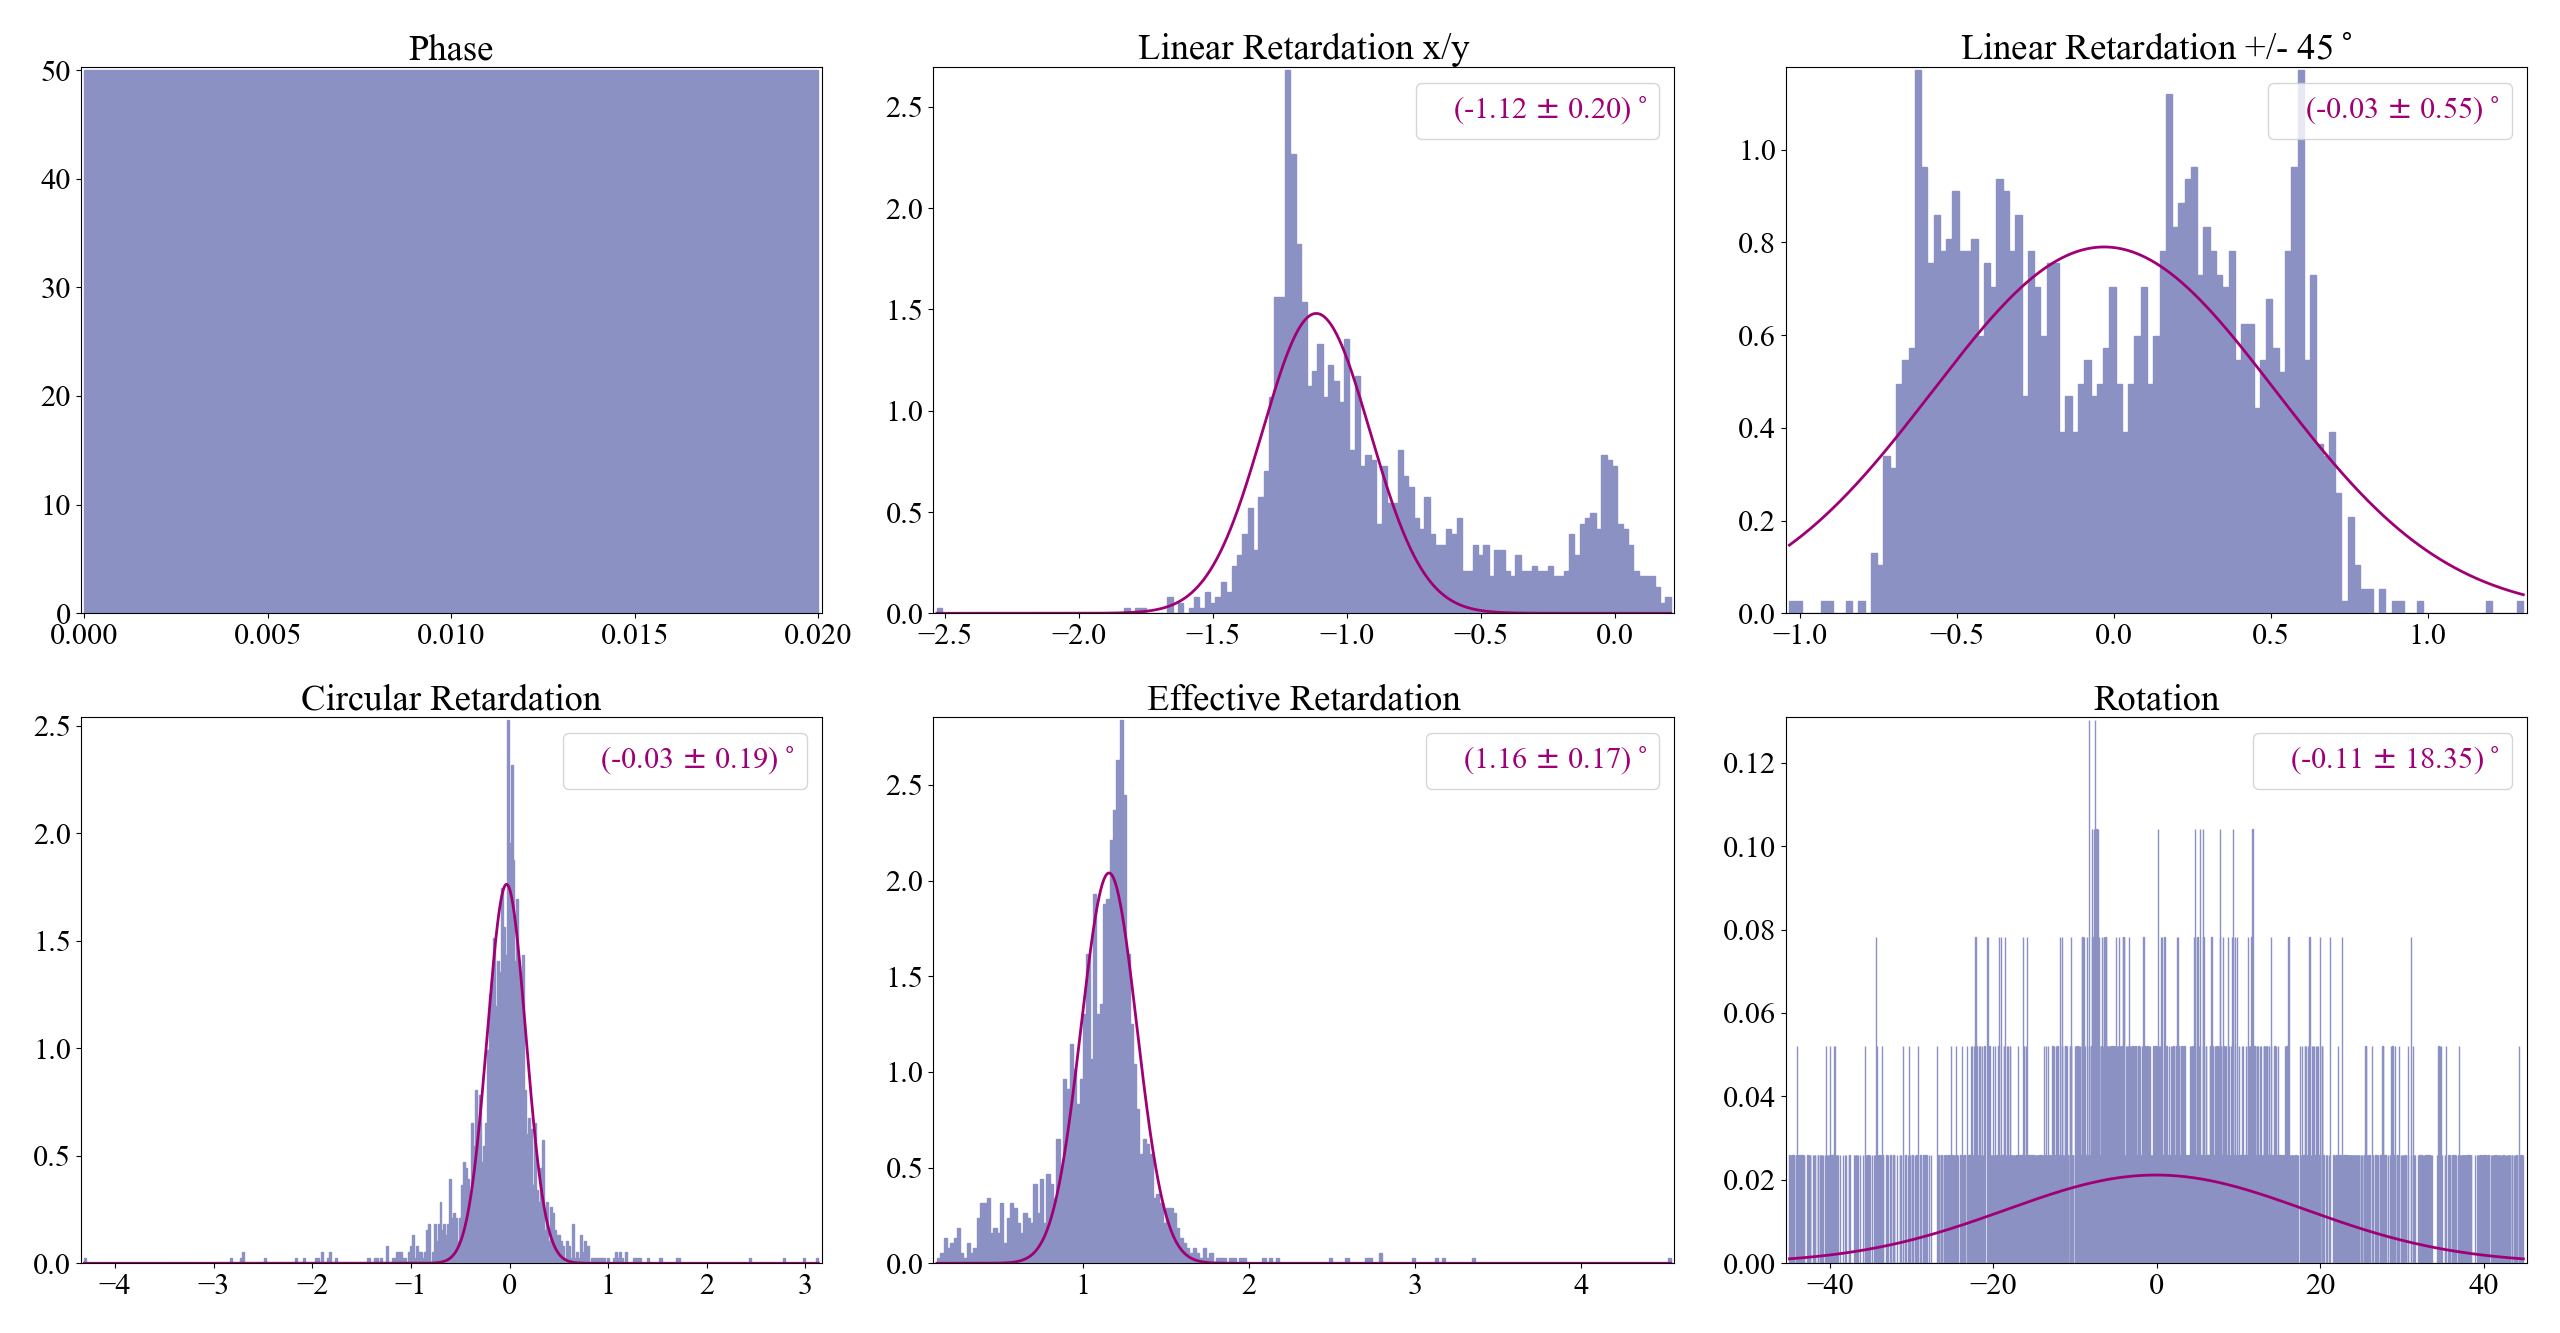
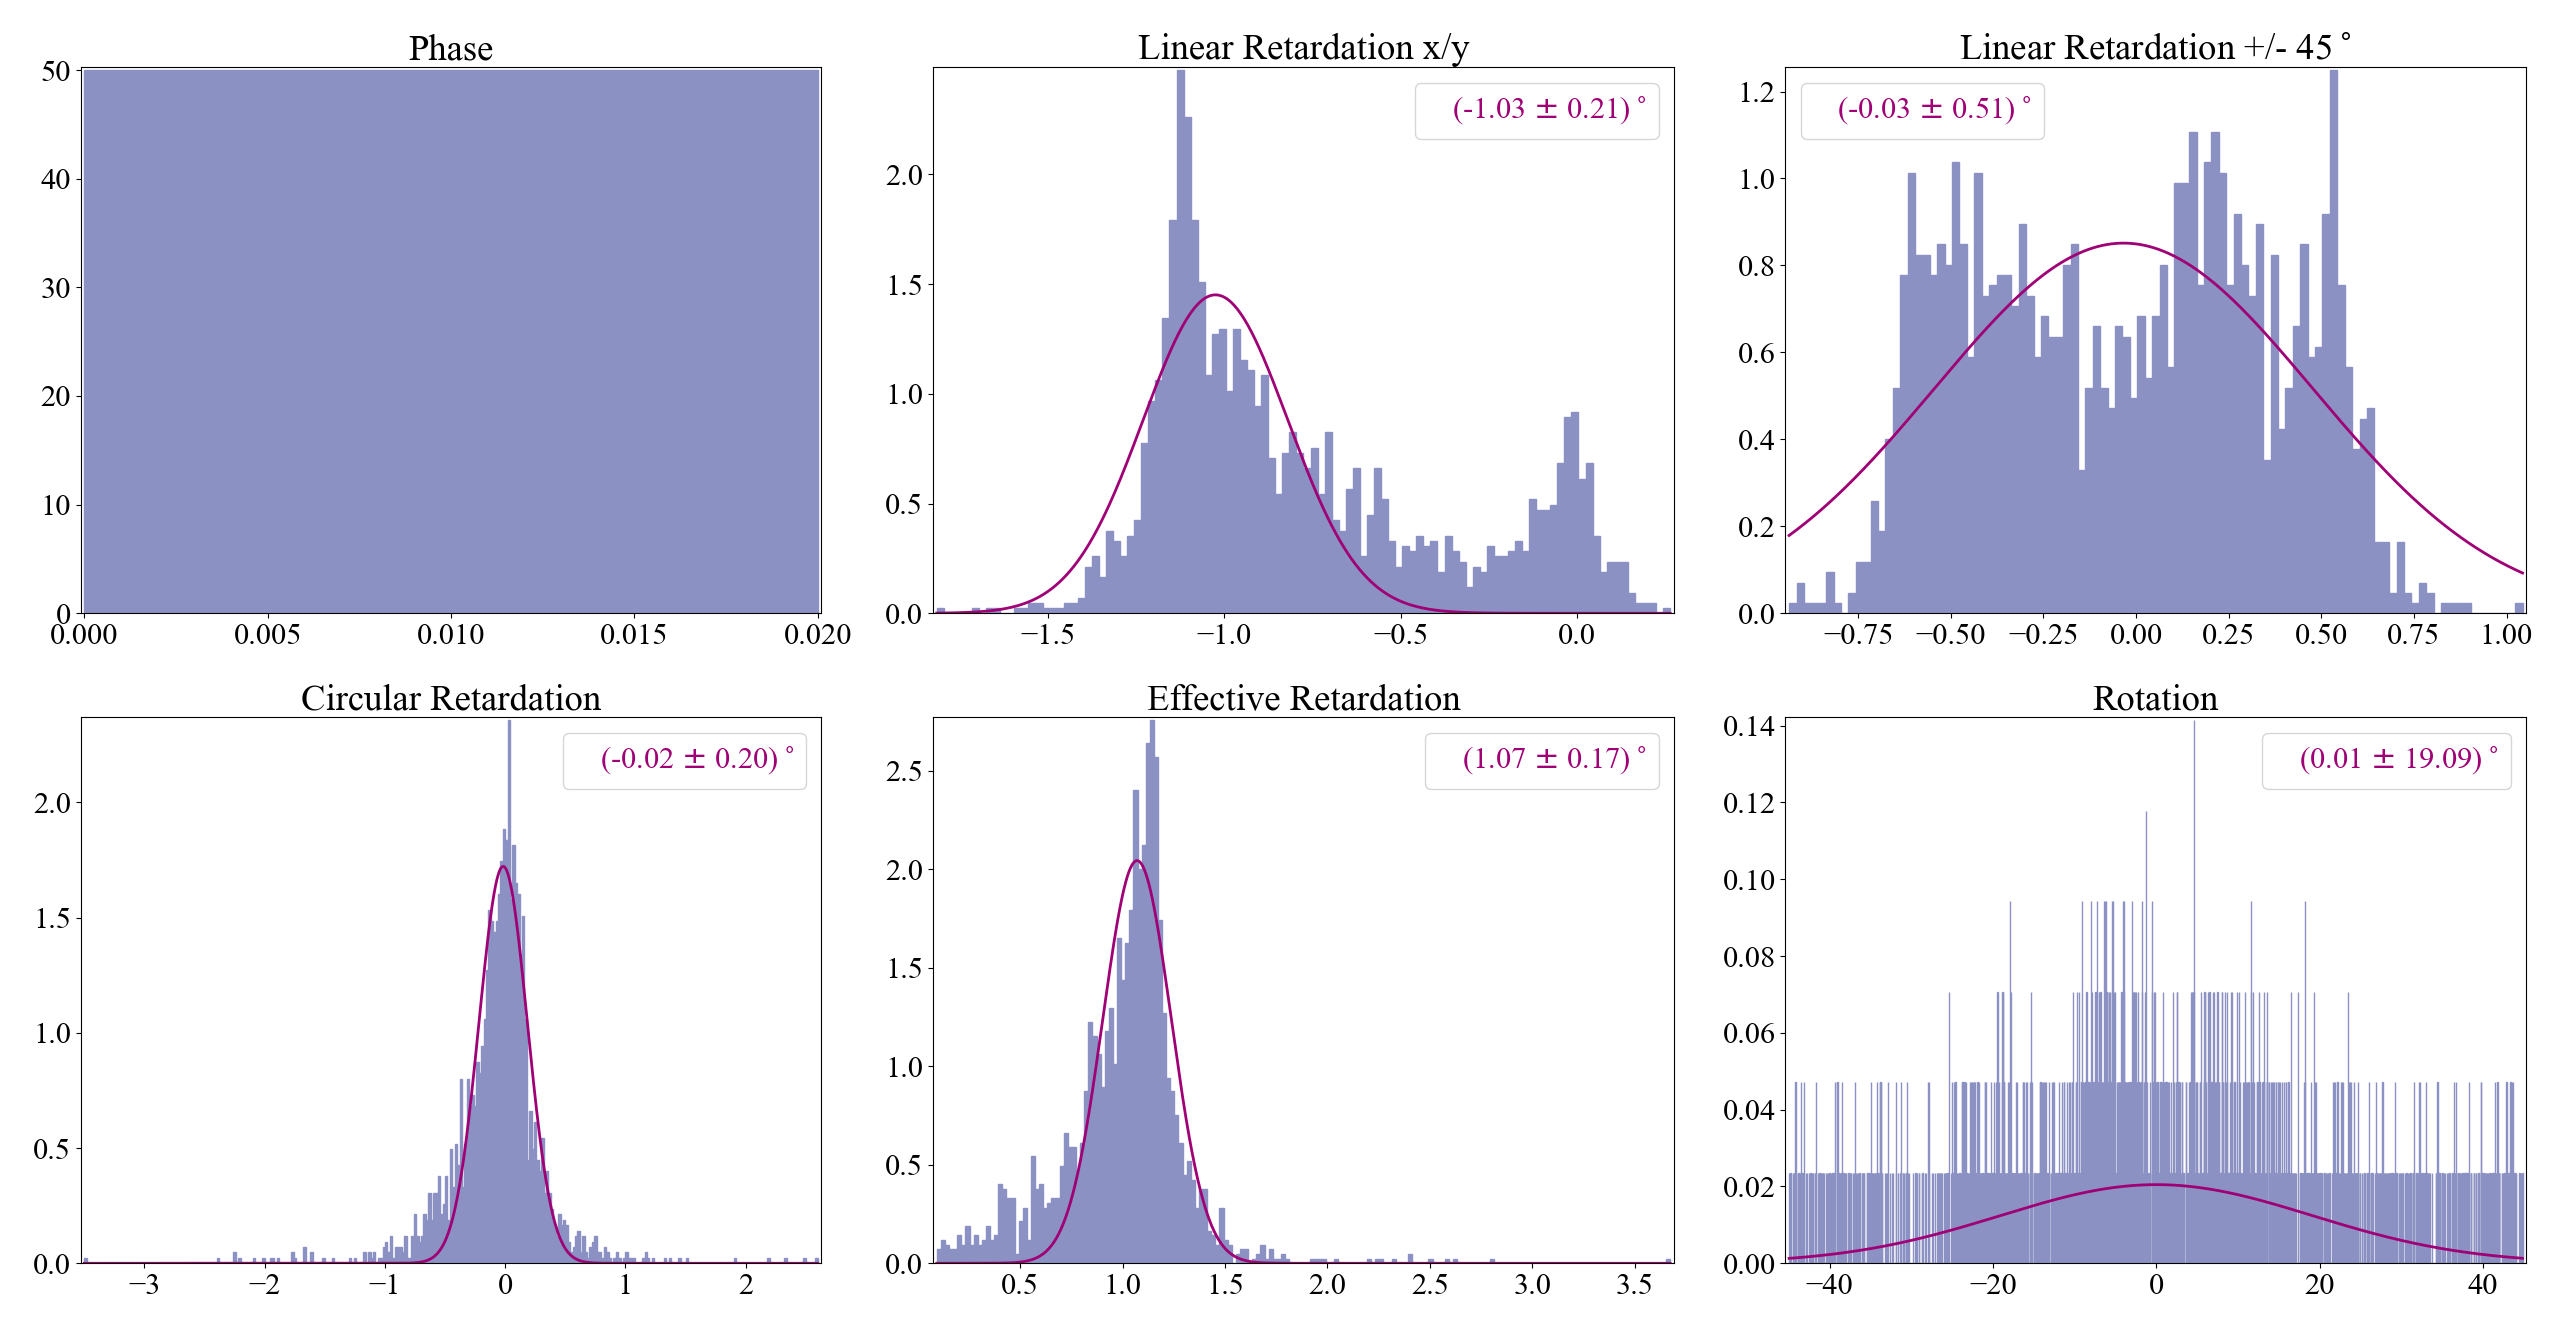
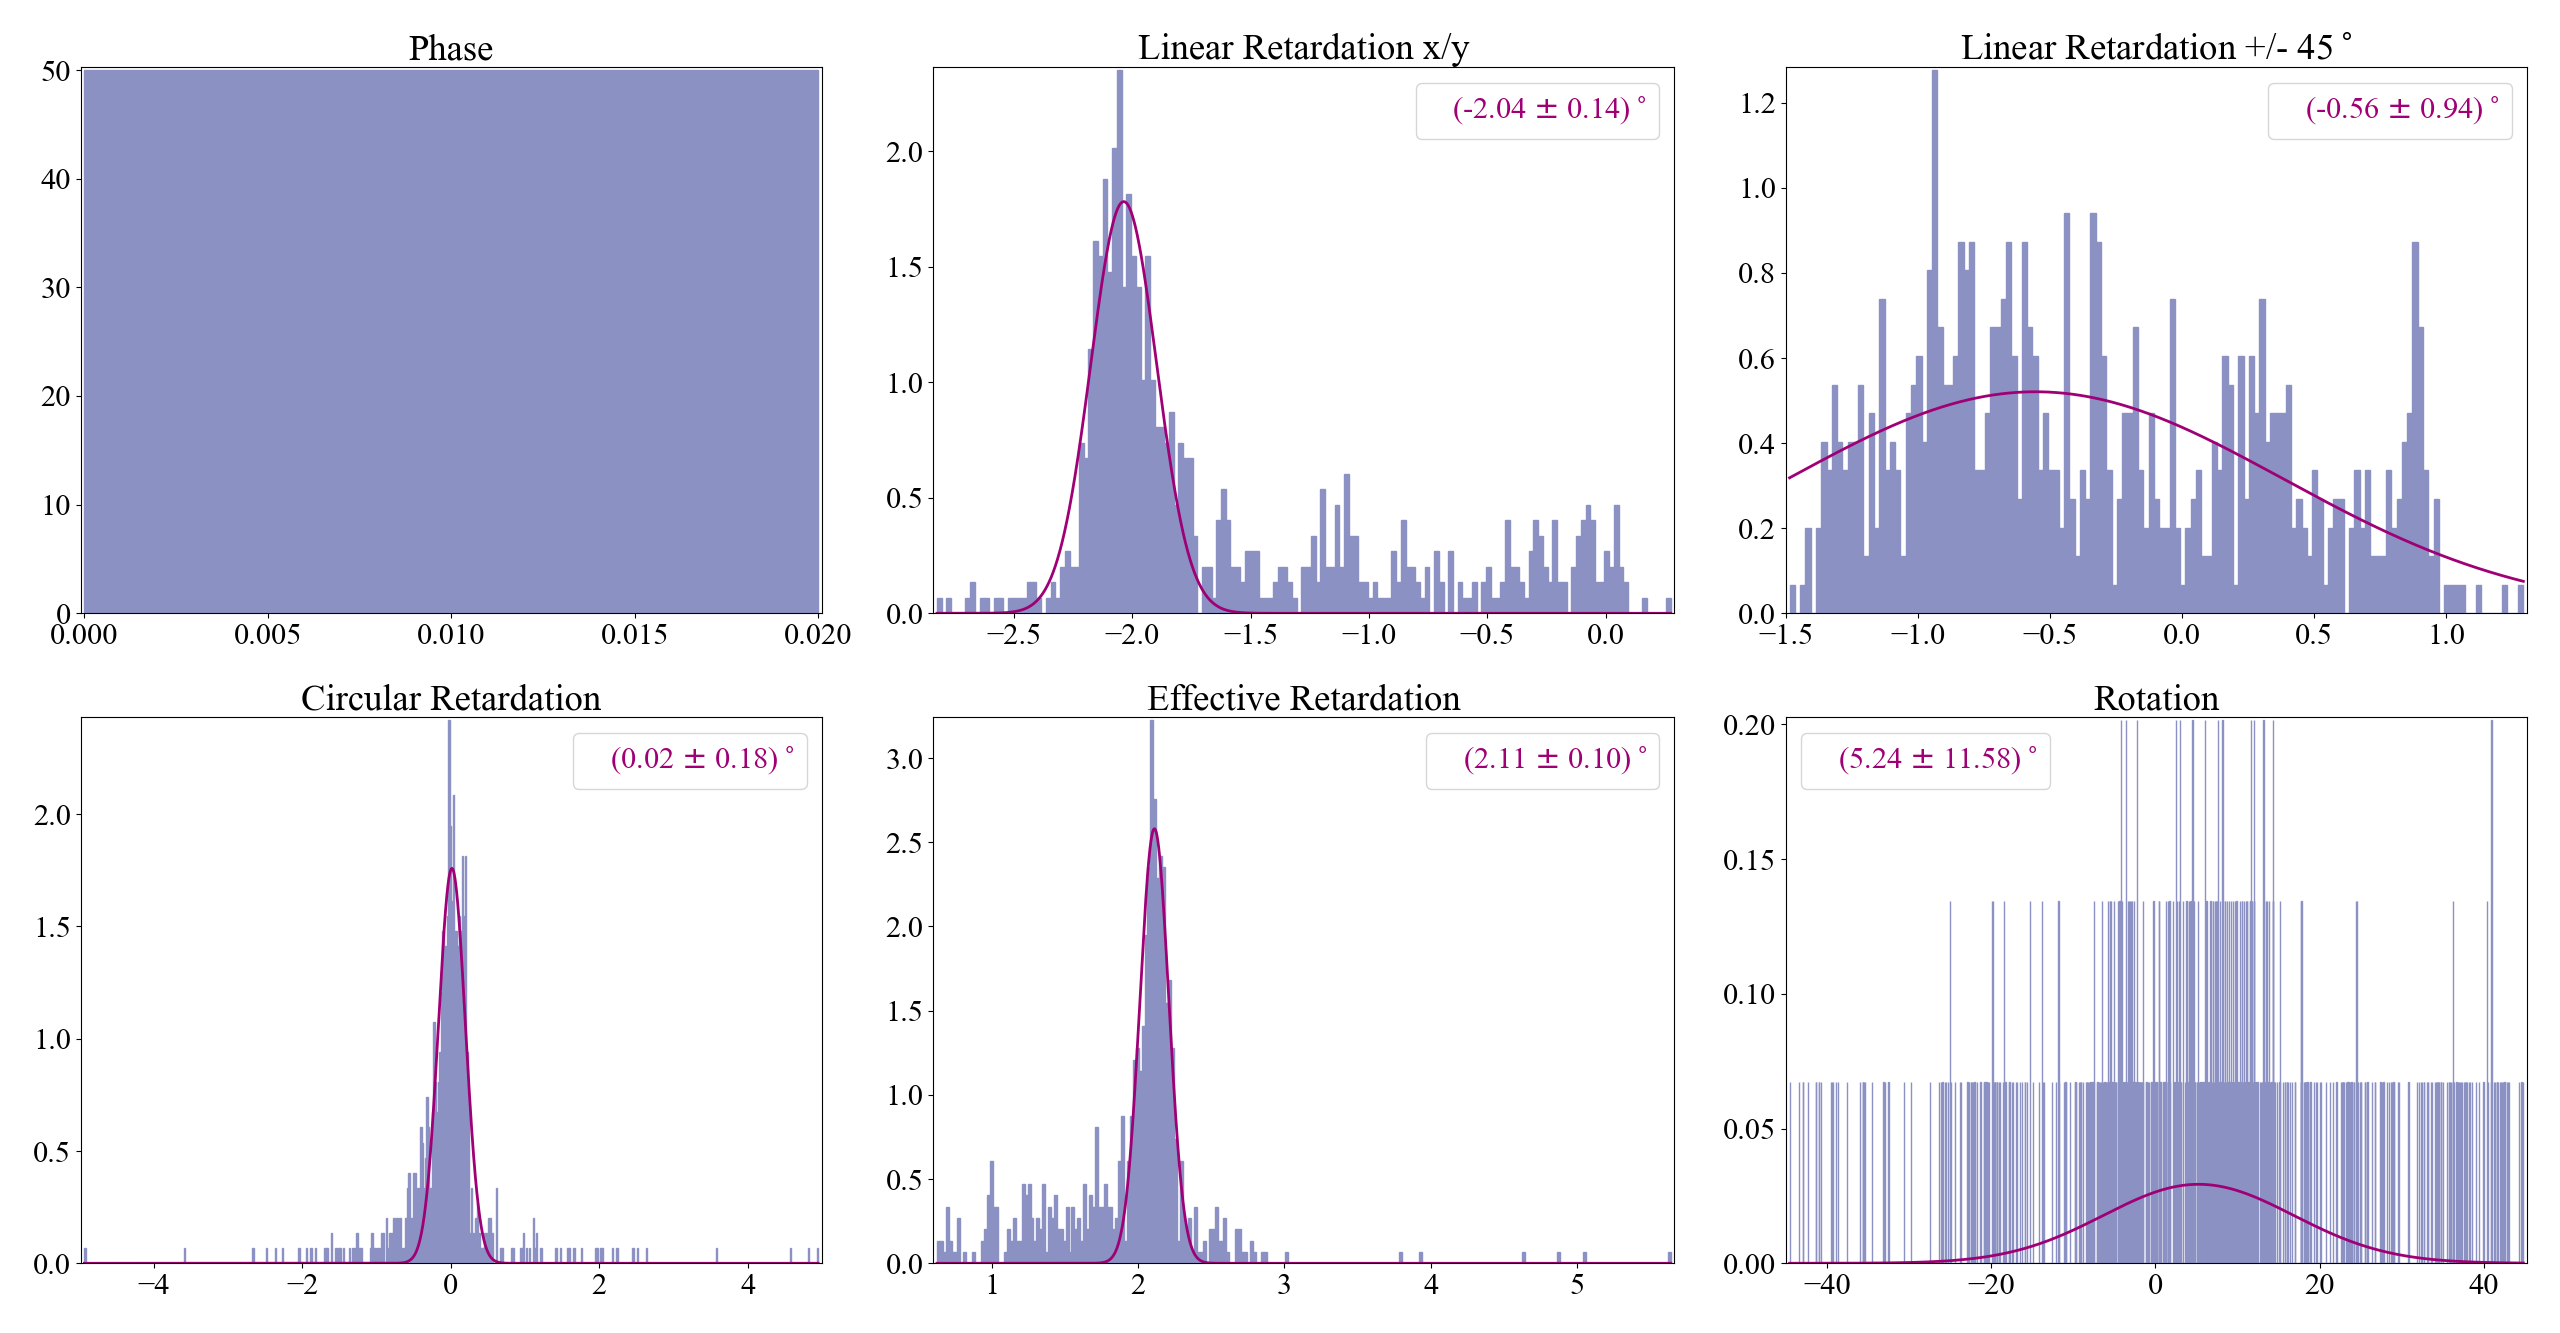
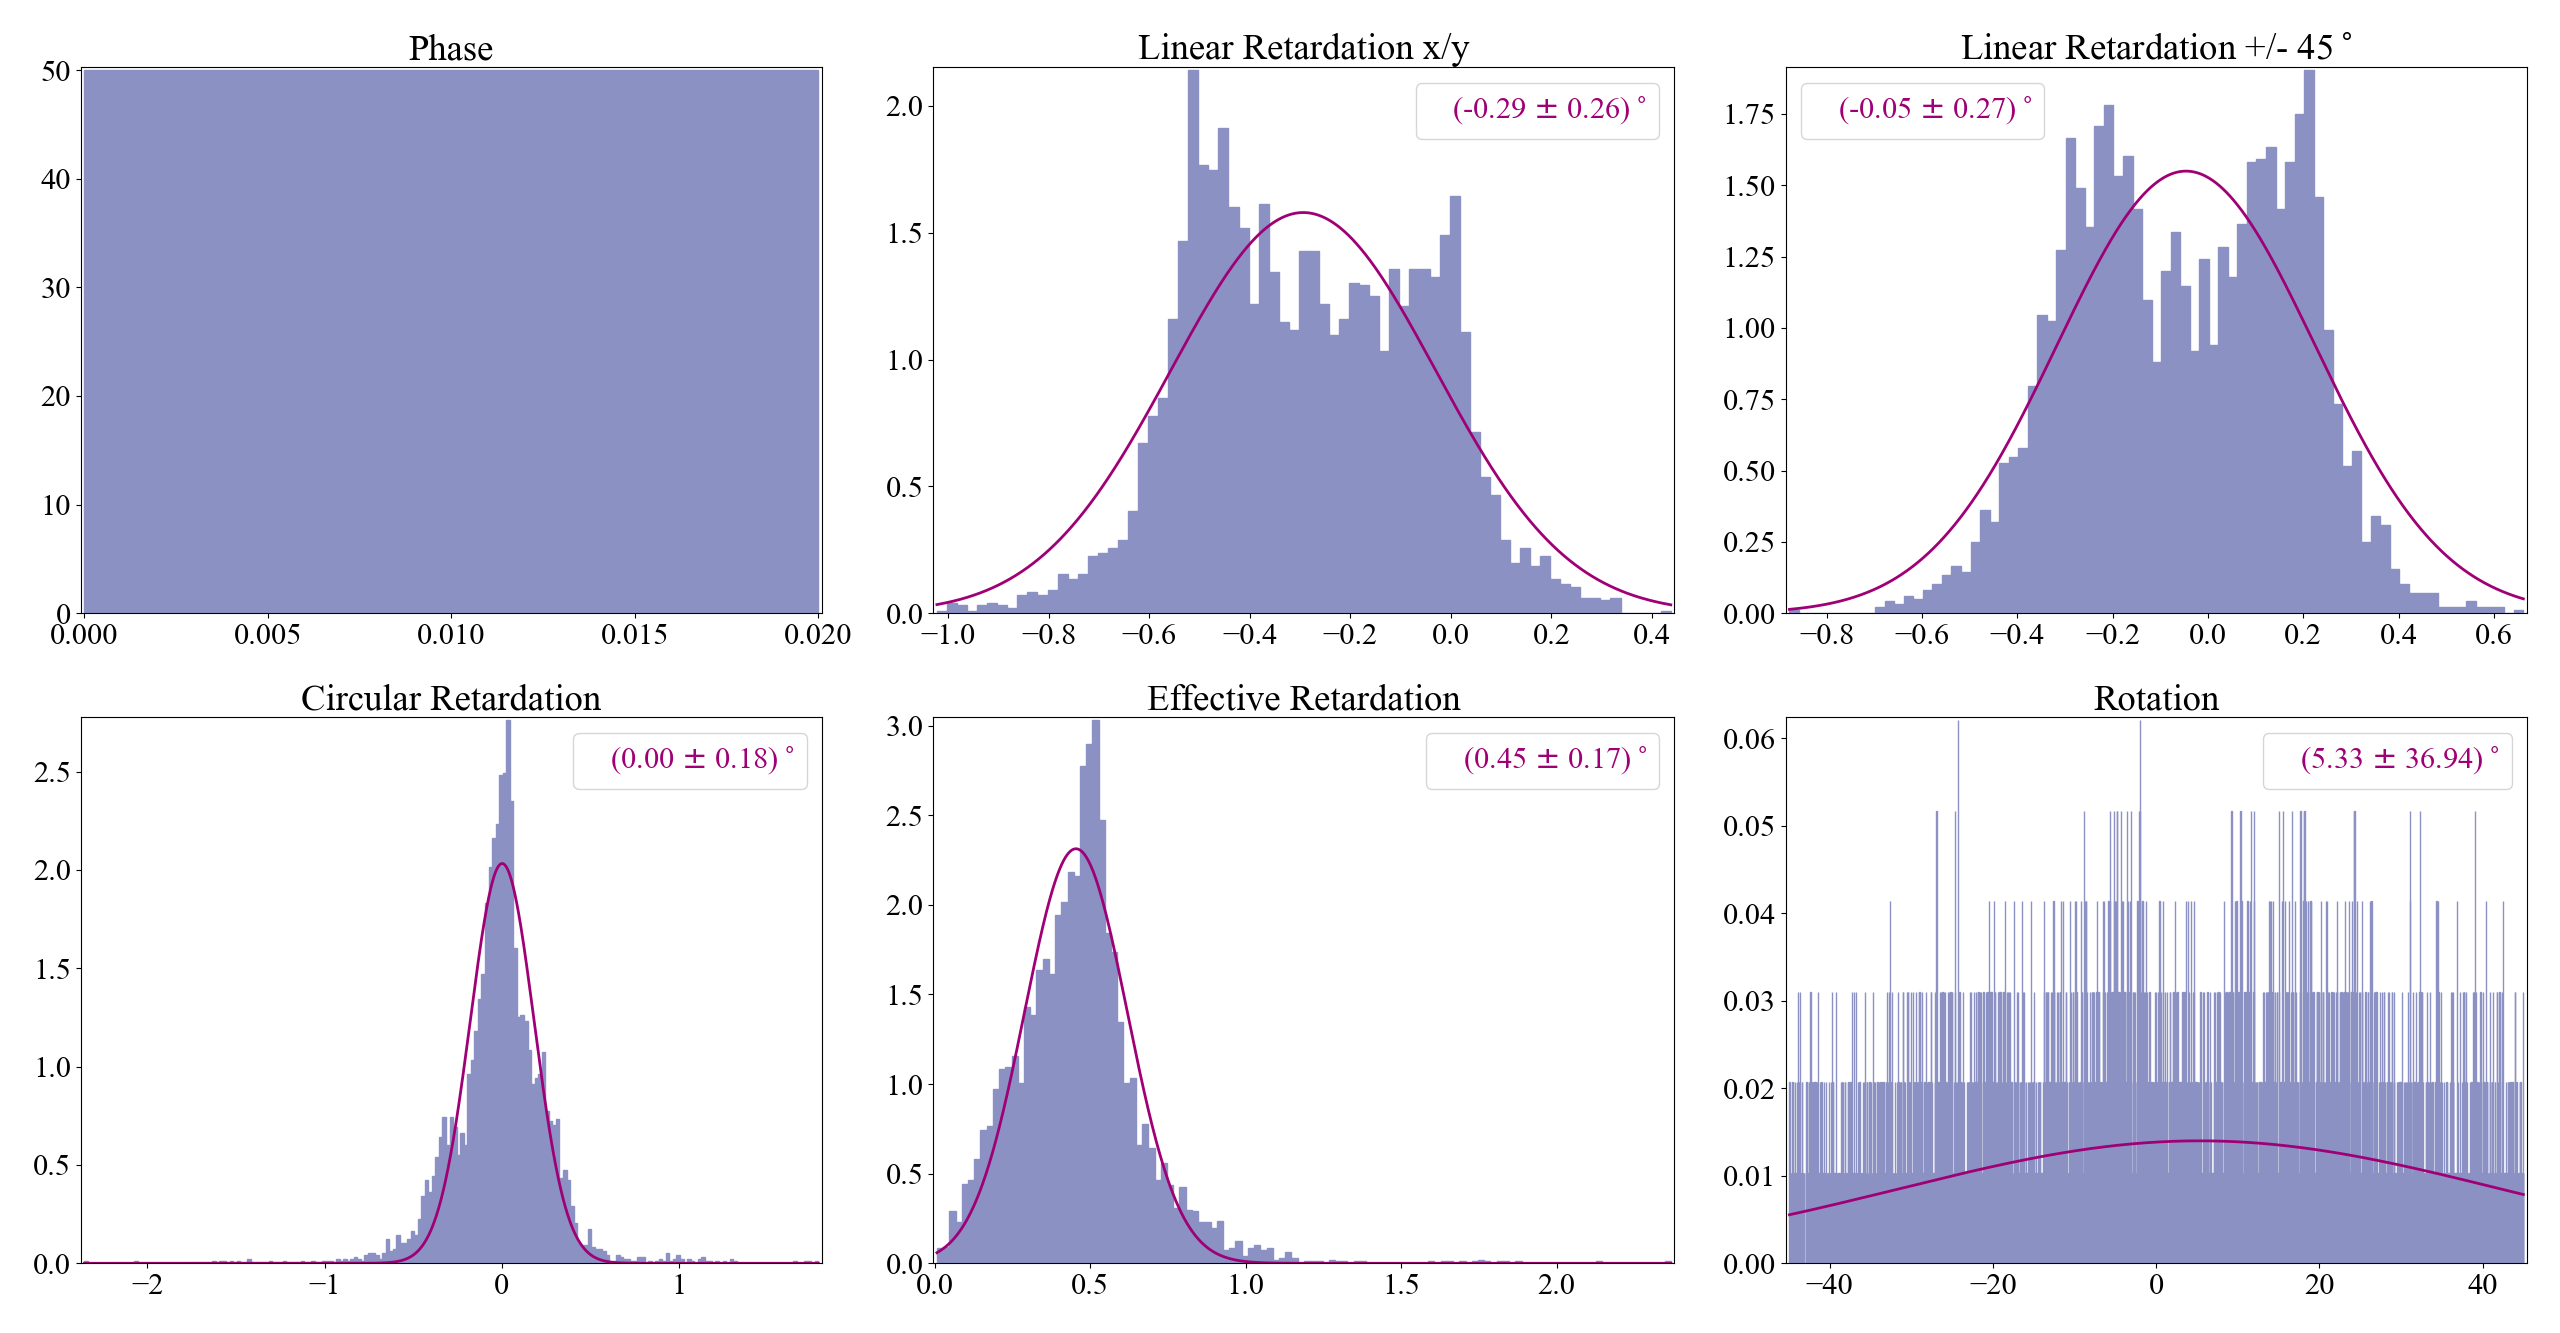
The retardation of the data was evaluated and plotted. We can see a linear dependency of retardation(effective and linear retardation) with the stretch of hydrogel. On the other hand, circular retardation and linear retardation along 45deg axis doesn't change.
The distibution of retardation was fit with gaussian fit and the mean and std was estimated. Then for each displacement the analysis was repeated to make the plot 1.
Plot 1 Retardation vs. Displacement
[Katsuki, Shalika, Marc]
The thickness of the hydrogel is 1.5mm. The measurement is taken with LC voltage from 0.5V - 3 V with 0.25V step and 10avg.
26.7 cm (F=0g)
C:\Users\atama\Dropbox\LC-Experiment\Measurement Data\cell birefringence\hydrogel\Wed, Sep 25, 2024 10-42-00 AM.txt
26.8 cm
C:\Users\atama\Dropbox\LC-Experiment\Measurement Data\cell birefringence\hydrogel\Wed, Sep 25, 2024 11-45-27 AM.txt
26.9 cm
C:\Users\atama\Dropbox\LC-Experiment\Measurement Data\cell birefringence\hydrogel\Wed, Sep 25, 2024 11-48-42 AM.txt
27 cm
C:\Users\atama\Dropbox\LC-Experiment\Measurement Data\cell birefringence\hydrogel\Wed, Sep 25, 2024 11-52-24 AM.txt
27.1 cm
C:\Users\atama\Dropbox\LC-Experiment\Measurement Data\cell birefringence\hydrogel\Wed, Sep 25, 2024 11-56-57 AM.txt
27.2 cm
C:\Users\atama\Dropbox\LC-Experiment\Measurement Data\cell birefringence\hydrogel\Wed, Sep 25, 2024 12-01-33 PM.txt
27.3 cm
C:\Users\atama\Dropbox\LC-Experiment\Measurement Data\cell birefringence\hydrogel\Wed, Sep 25, 2024 12-06-09 PM.txt
Hydrogel changed here.
27.4 cm (discarded for analysis)
C:\Users\atama\Dropbox\LC-Experiment\Measurement Data\cell birefringence\hydrogel\Wed, Sep 25, 2024 1-46-34 PM.txt
27.5 cm (discarded for analysis)
C:\Users\atama\Dropbox\LC-Experiment\Measurement Data\cell birefringence\hydrogel\Wed, Sep 25, 2024 1-52-02 PM.txt
The retardation of the data was evaluated and plotted. We can see a linear dependency of retardation(effective and linear retardation) with the stretch of hydrogel. On the other hand, circular retardation and linear retardation along 45deg axis doesn't change.
The distibution of retardation was fit with gaussian fit and the mean and std was estimated. Then for each displacement the analysis was repeated to make the plot 1.
Plot 1 Retardation vs. Displacement
The force constant k was evaluated as follows:
mg = kx
k = (delta mg) / (delta x) = ((0.06-0.03) * 9.8)/(0.01 * (28-27)) = 29.4
The diattenuation vs. Displacement is as in Fig 1. Doesn't change with increasing displacement.
The beam in the reflection of beam splitter was tuned to remove the misalignment of the beam (beam height was chaning by 1cm at the end of the table). Now the beam height is same as before the BS.
I placed the Shinkosha S7 after the beam splitter reflection and before the camera. The LC voltages are changed from 0.5V - 3V with 0.25V step size, with 10 averaging.
without sample
C:\Users\atama\Dropbox\LC-Experiment\Measurement Data\Birefringence Measurements\S7\Tue, Sep 24, 2024 3-23-26 PM.txt
with S7
C:\Users\atama\Dropbox\LC-Experiment\Measurement Data\Birefringence Measurements\S7\Wed, Sep 25, 2024 10-07-47 AM.txt
The birefringence obtained is Fig 1. Since there were too few points (112/6050) after filtering. I will re take measurements.
[Katsuki, Marc, Shalika]
A 1mm thin hydrogel was prepared between plates to measure its birefringence. We change the LC voltage from 0.5-3 V with step size of 0.25V and averaging of 10th order.
without sample
C:\Users\atama\Dropbox\LC-Experiment\Measurement Data\cell birefringence\hydrogel\Tue, Sep 24, 2024 3-23-26 PM.txt
We try to shake the hydrogel to see if any movement due to air flow will change the output. The range of azimuth change is 0.02 deg and ell change is 0.1 deg. We then try to stretch the hydrogel using force gauge. The minimum reading of force gauge is 10g.
1. At, F = 10g
C:\Users\atama\Dropbox\LC-Experiment\Measurement Data\cell birefringence\hydrogel\Tue, Sep 24, 2024 3-27-28 PM.txt
It seemed there were issues related to the resolution of the gauge, and we weren't able to see anything other than 10. When we saw the force gauge reading of 40g, the hydrogel broke. We started taking measurements related to the position of the black actuator on the bar
2. 31 cm : C:\Users\atama\Dropbox\LC-Experiment\Measurement Data\cell birefringence\hydrogel\Tue, Sep 24, 2024 4-02-55 PM.txt
3. 30 cm: C:\Users\atama\Dropbox\LC-Experiment\Measurement Data\cell birefringence\hydrogel\Tue, Sep 24, 2024 4-22-05 PM.txt
4. 29.5 cm : C:\Users\atama\Dropbox\LC-Experiment\Measurement Data\cell birefringence\hydrogel\Tue, Sep 24, 2024 4-16-38 PM.txt
The figures are in order of the measurement taken.
The lens actually was f=50mm and f=-50mm. I have changed the beam characteristics accordingly.
The lens change was mentioned in 3563
There is a scale on the table kept in backward direction, i.e increasing distance from laser is decreasing measurement on the scale.
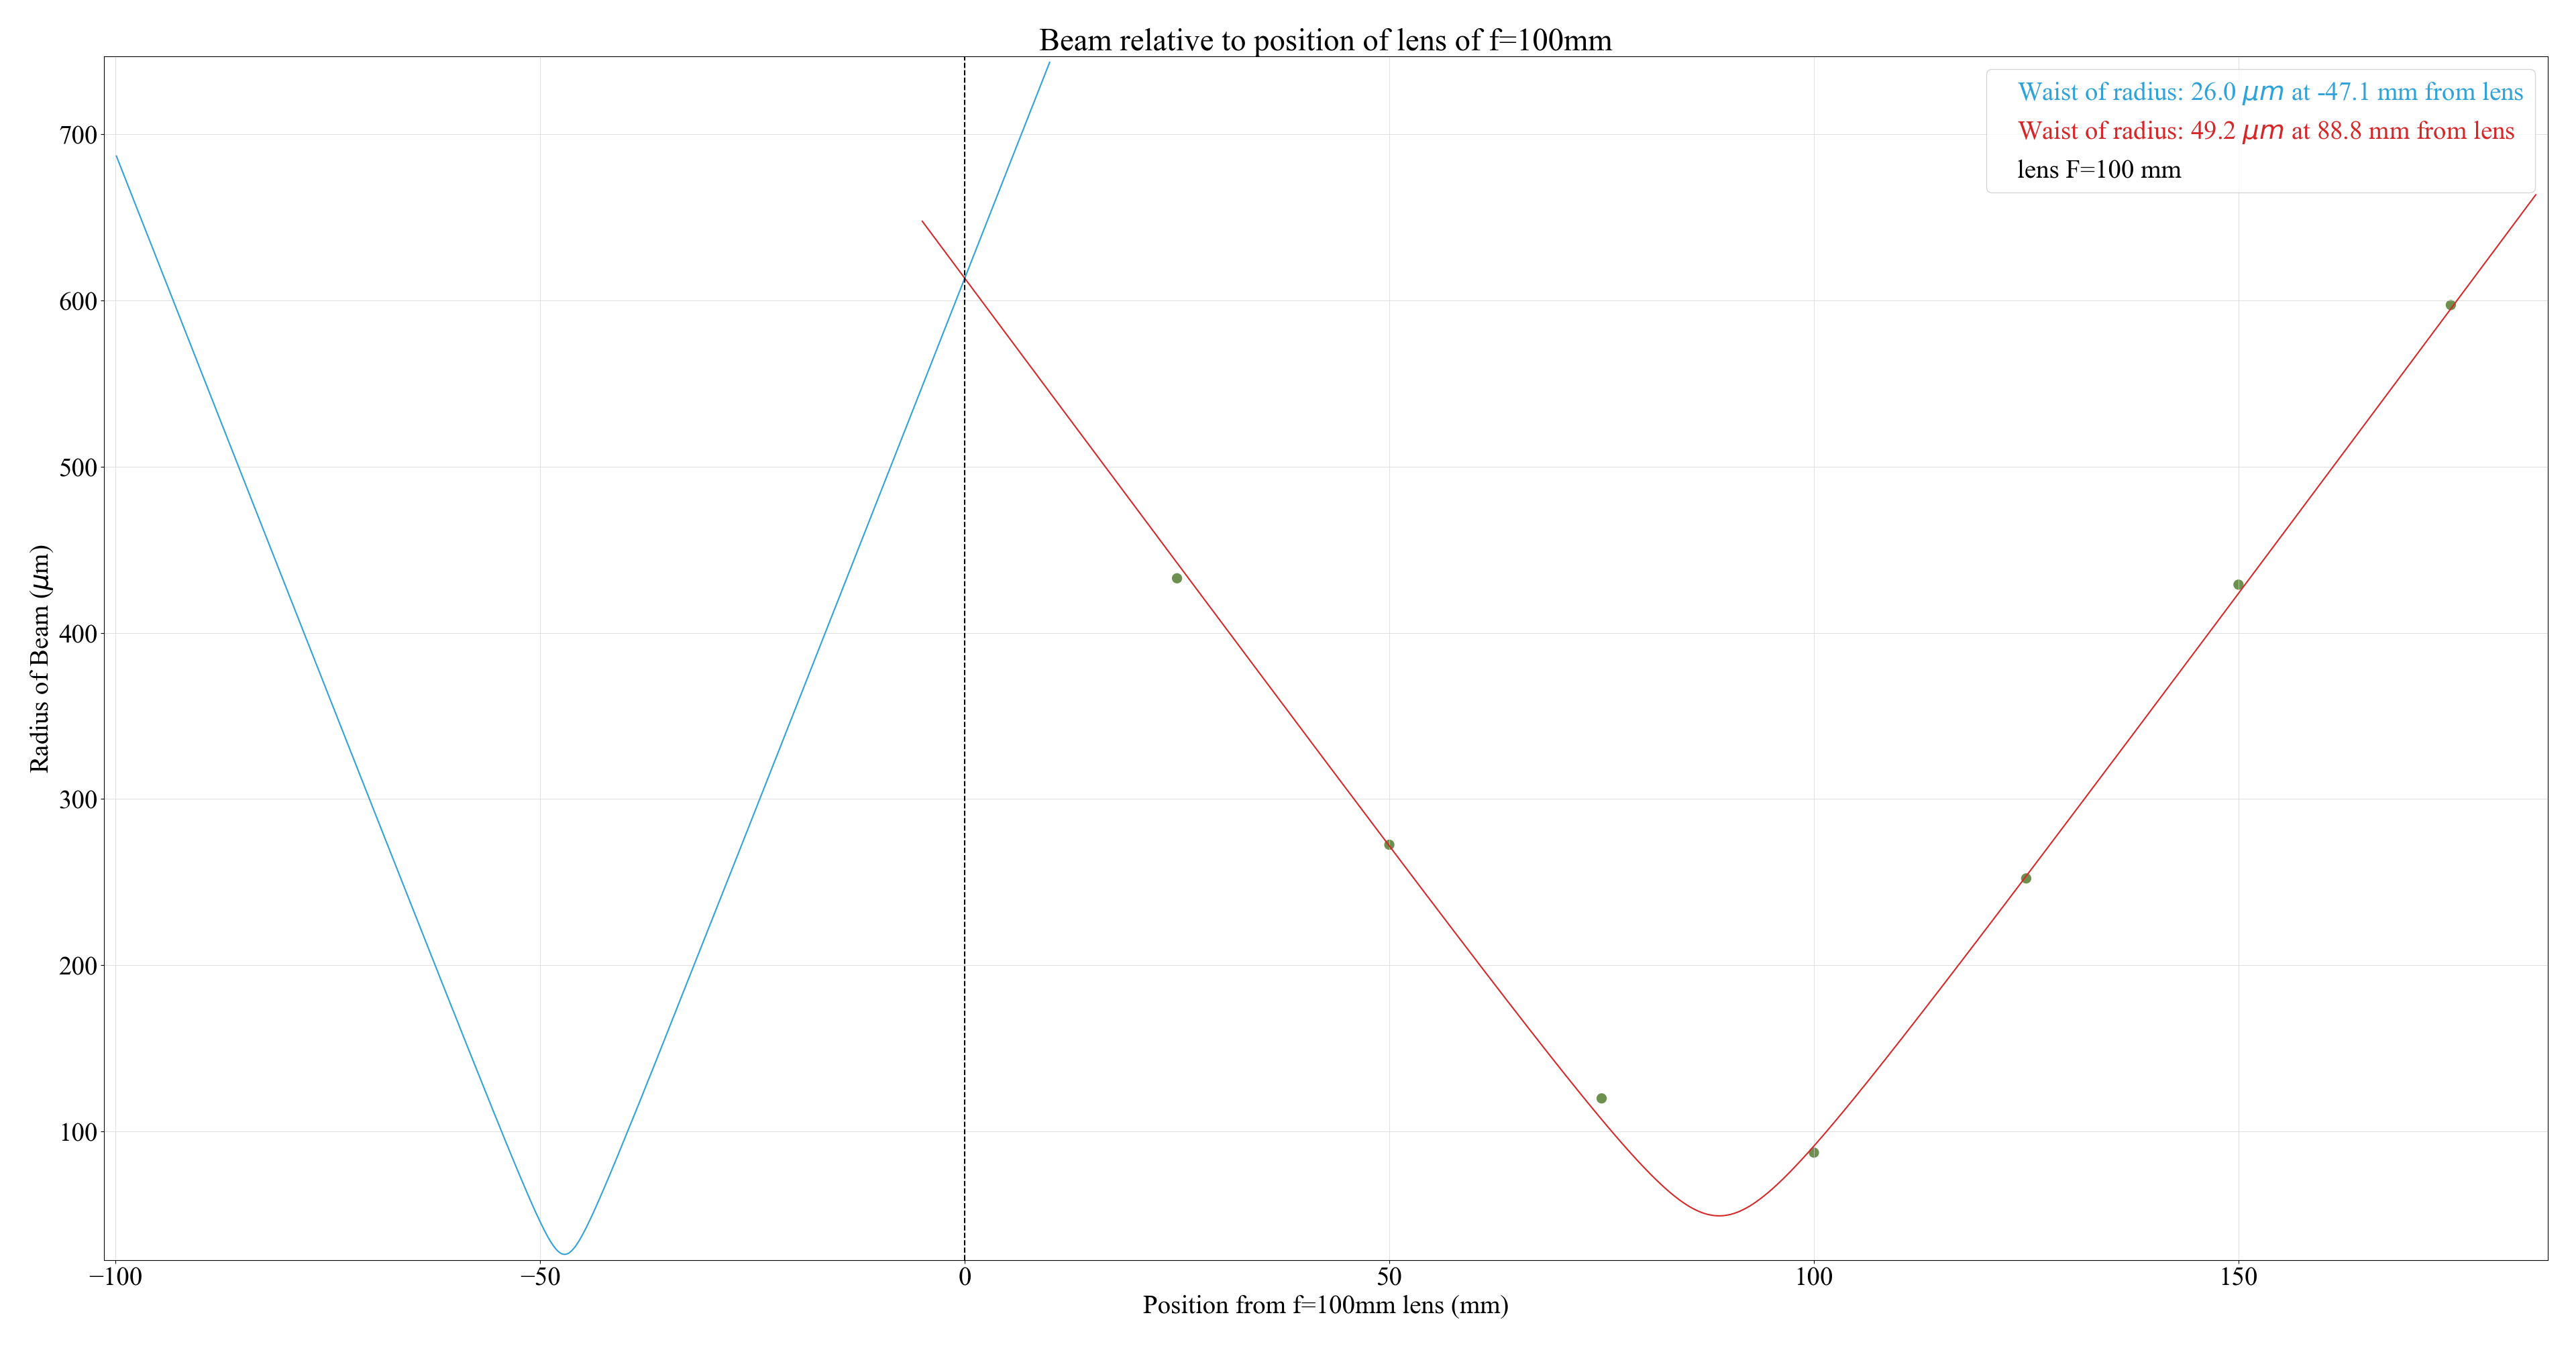
In reference to elog 3561 the beam was as attached in Fig 1. The beam characterization was originally done with f=100mm lens at 101.5cm. The waist of beam before the lens was at -47.1 mm, i.e at 101.5 cm +4.71 cm=106.21 cm
According to the elog the lens f = 100 mm was moved later by d=0.2m. But, now the setup has two f=50mm lens. This was never mentioned in elogs that the lens was changed.
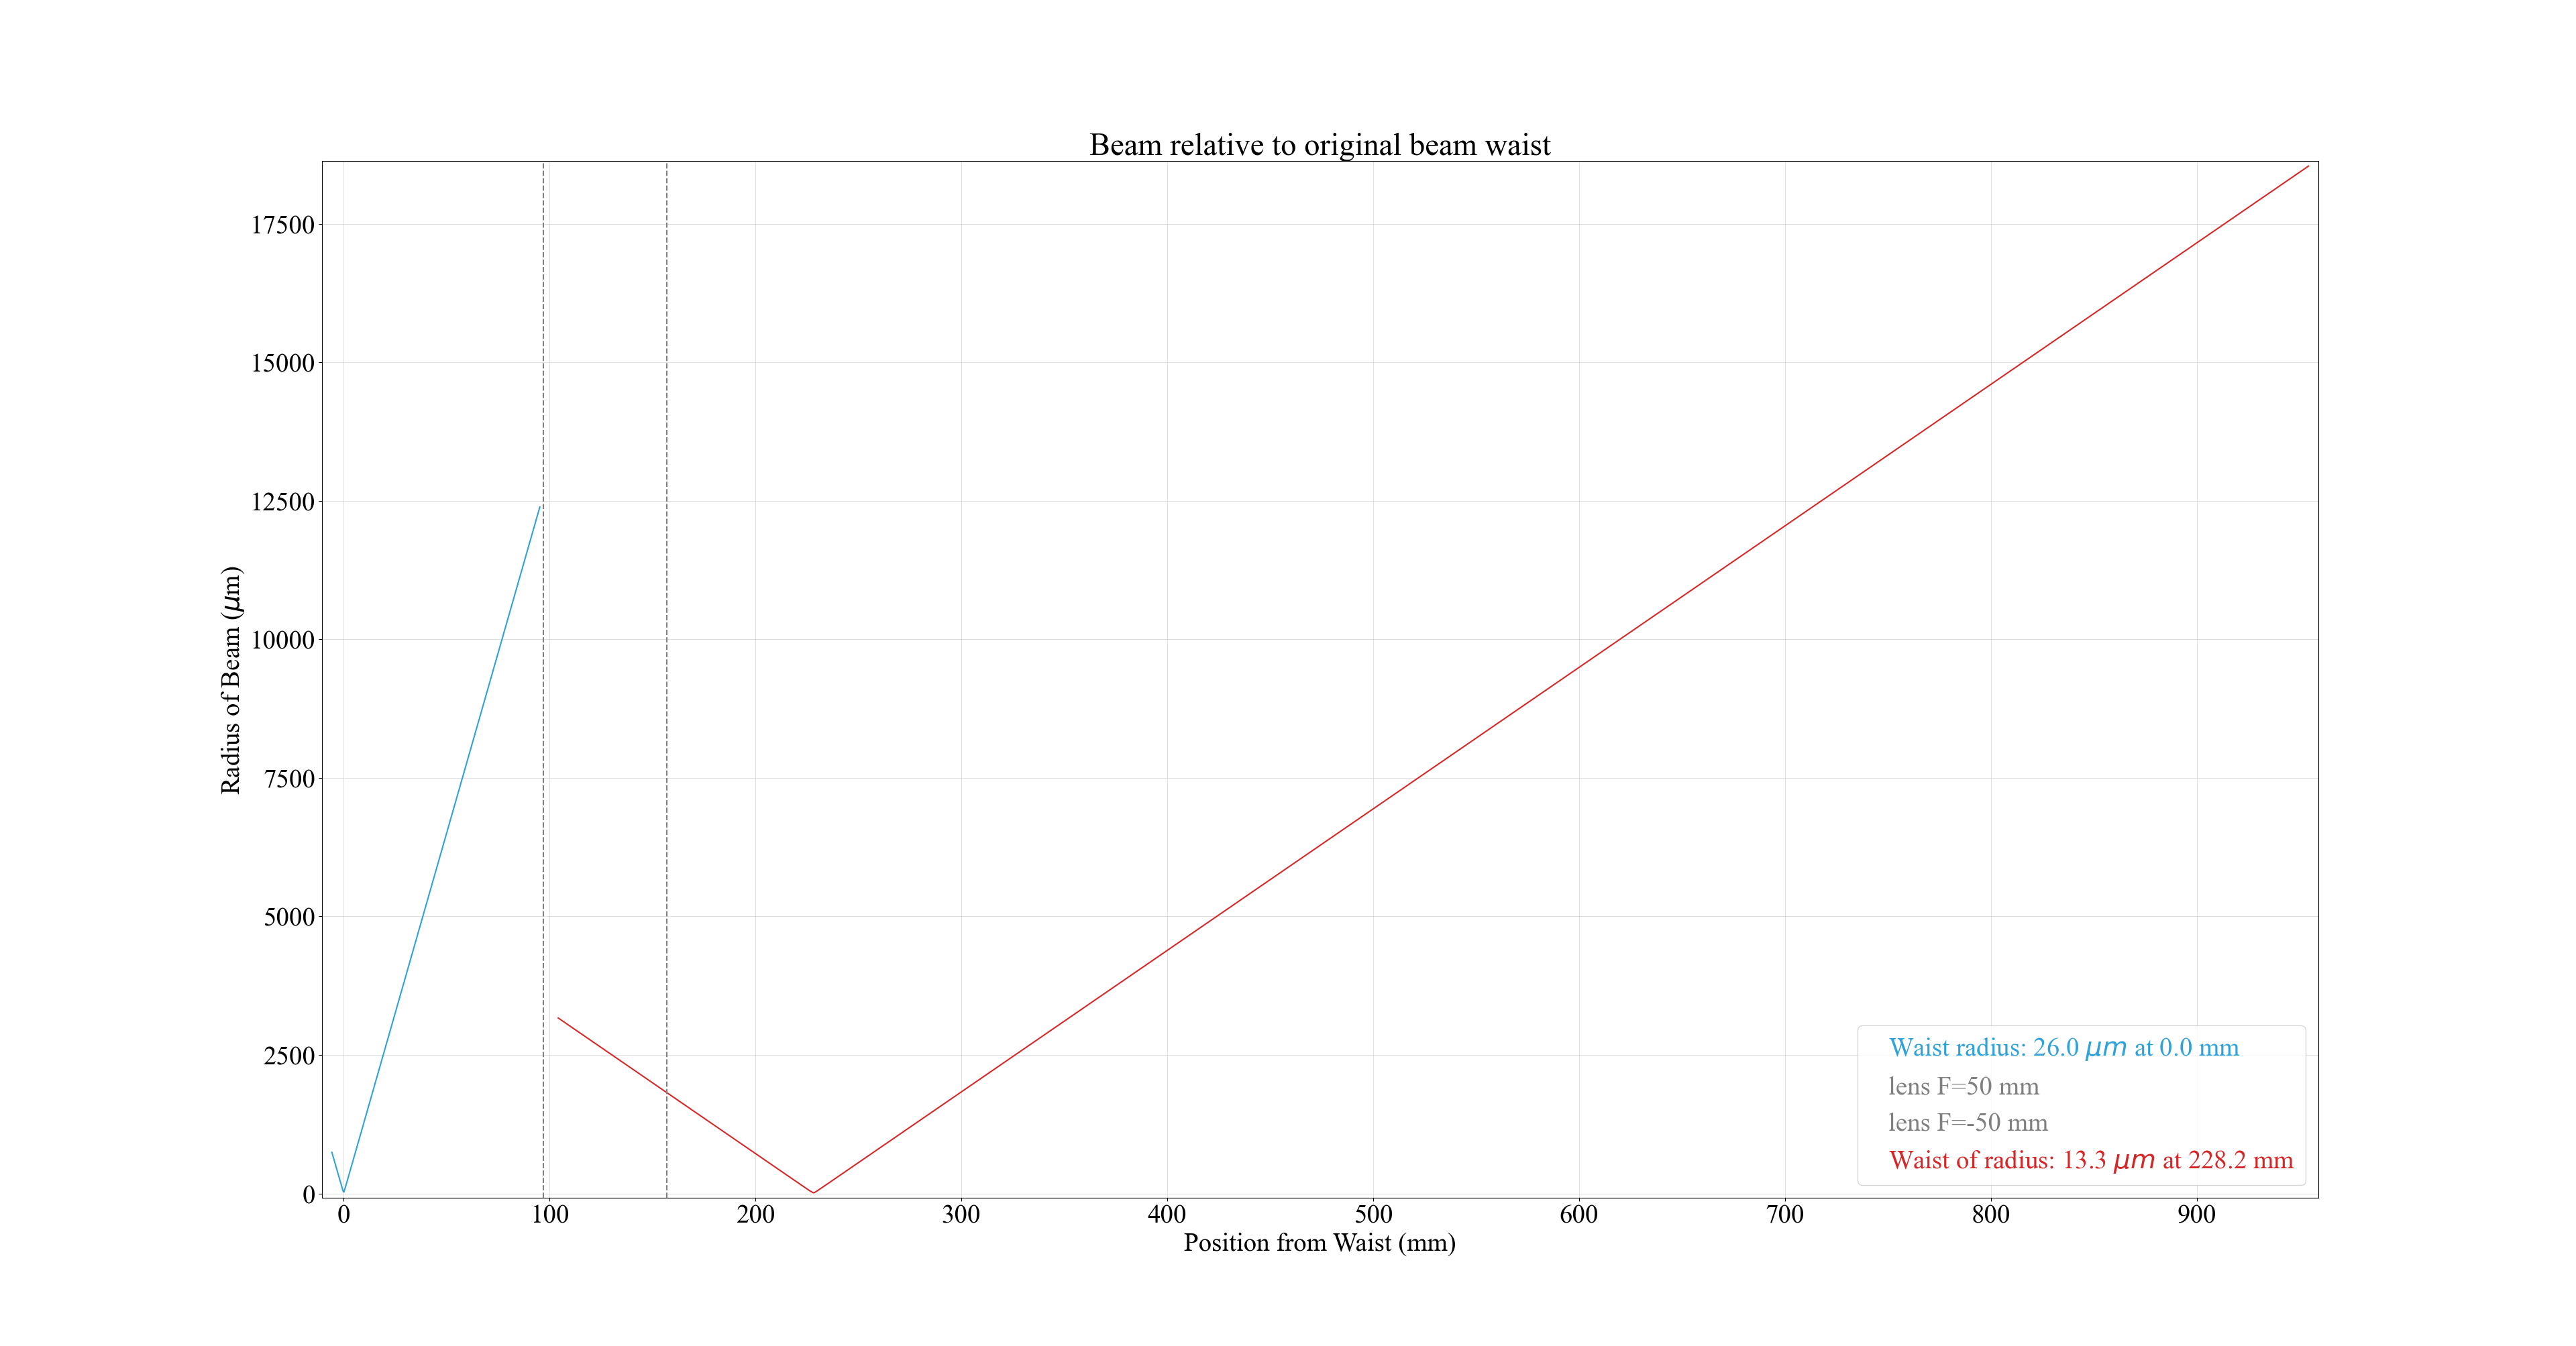
For the modified setup:
The two f = 50 mm, -50mm lens are placed at 96.5 cm and 90.5cm.Hence, the relative distance between lens and waist of beam is 9.71cm and 15.71cm respectively.
The new beam propagation is as in Fig 2. I propagated the original beam (one before f=100 mm lens) after the two f = 50mm lens.
The beam power before filter is 64mW.
I wish to replace the energy filter before the HWP on the EOM path, with a beam splitter or beam sampler and make a separate path for SLM.
The lens change was mentioned in 3563
The lens actually was f=50mm and f=-50mm. I have changed the beam characteristics accordingly.