NAOJ GW Elog Logbook 3.2

Marc, Pierre (remote)
Since the replacement of the EOM, we had difficulties to achieve automatic lock of IRMC.
This is mainly due to the fact that we're using 78MHz sidebands instead of 88MHz and had to change the PD in reflection of the IRMC for a non-resonant one.
First, the reflection signal of a scan of IRMC is different than before.
The base is at 1.38V and the TEM00 dip at 692mW while in the past the dip was negative.
This meant that we had to modify the pin P4 strap from pin 2-3 to pin 1-2.
Also, the threshold value was tweaked looking at this signal.
Then, the error signal was about 83mVpk while it was about 10 times more in the past.
Despite putting the servo gain to max I could not achieve lock (even though it was detected from the blinking LED).
I used the CCFC amplifier (32dB) and got an error signal about 2.2Vpk.
As the error signal slope and triangle scan slope are identical, the lock can be achieved with the switch INV.
I put a gain of 0.5 and could lock reliably the IRMC.
Marc, Michael
I wanted to check some of the multiplexer output diagnostics for the PLLs but the BEAT signal (the electrical signal from the fiber PD) had disappeared. We roughly checked the coupling into the CC fiber PD using the power meter and it seems reasonable (ML 4.34 mW, CC 0.64 mW, 1.05 mW out). The fiber PD electrical output have a large DC offset. I noticed that the PPol signal was oscillating at 45 kHz which I thought was a bit strange.
I eventually plugged the CC BEAT signal into the spectrum analyser with a wide setting, and noticed that the large peak corresponding to what was at the level of the previous measured CC BEAT (-11 dBm) had drifted quite far away from its usual frequency setting and the PPol BEAT peak was sitting at the previously mentioned 45 kHz. Both aux laser temperatures were quite far from the values listed in the wiki, so I readjusted them to the proper values and saw the good BEAT signals (CC -11 dBm, PPol -7 dBm).
However, the CC PLL lock is still unstable. Using MUXOUT on the CC PLL board, I could see that the digital lock detection was not particularly great. Digital lock detection outputs 1 when the phase delay between 3 cycles is less than 15 ns, and 0 when not. I noticed the output was not continuously 1 (i.e. has a lot of phase noise). It remained locked for about 4-5 minutes. I still need to figure out what the other diagnostic functions do.
The step voltage sub vi was fixed (misplaced connection) so I will spend the week end trying to generate and analyze 40 000 polarization states.
I'm scanning each LC voltage from 0 to 10V with 0.05V increment, at 30degC.
The output polarizer angle conversion is so that 298.25deg is our 0deg (ie cross polarizers configuration). The output polarizer will be rotated by 5deg increment.
Note that for tprevious measurement there is a -5deg offset with cross polarizer angle as it was assumed to be 293.25 deg.
I checked the CC PLL fast and slow control as described in 1205, with the only difference being that I used 21 MHz as the base signal. The purpose is to see how the PLL control loop responds to small modulations in a beat signal that is somewhat offset from the main LO.
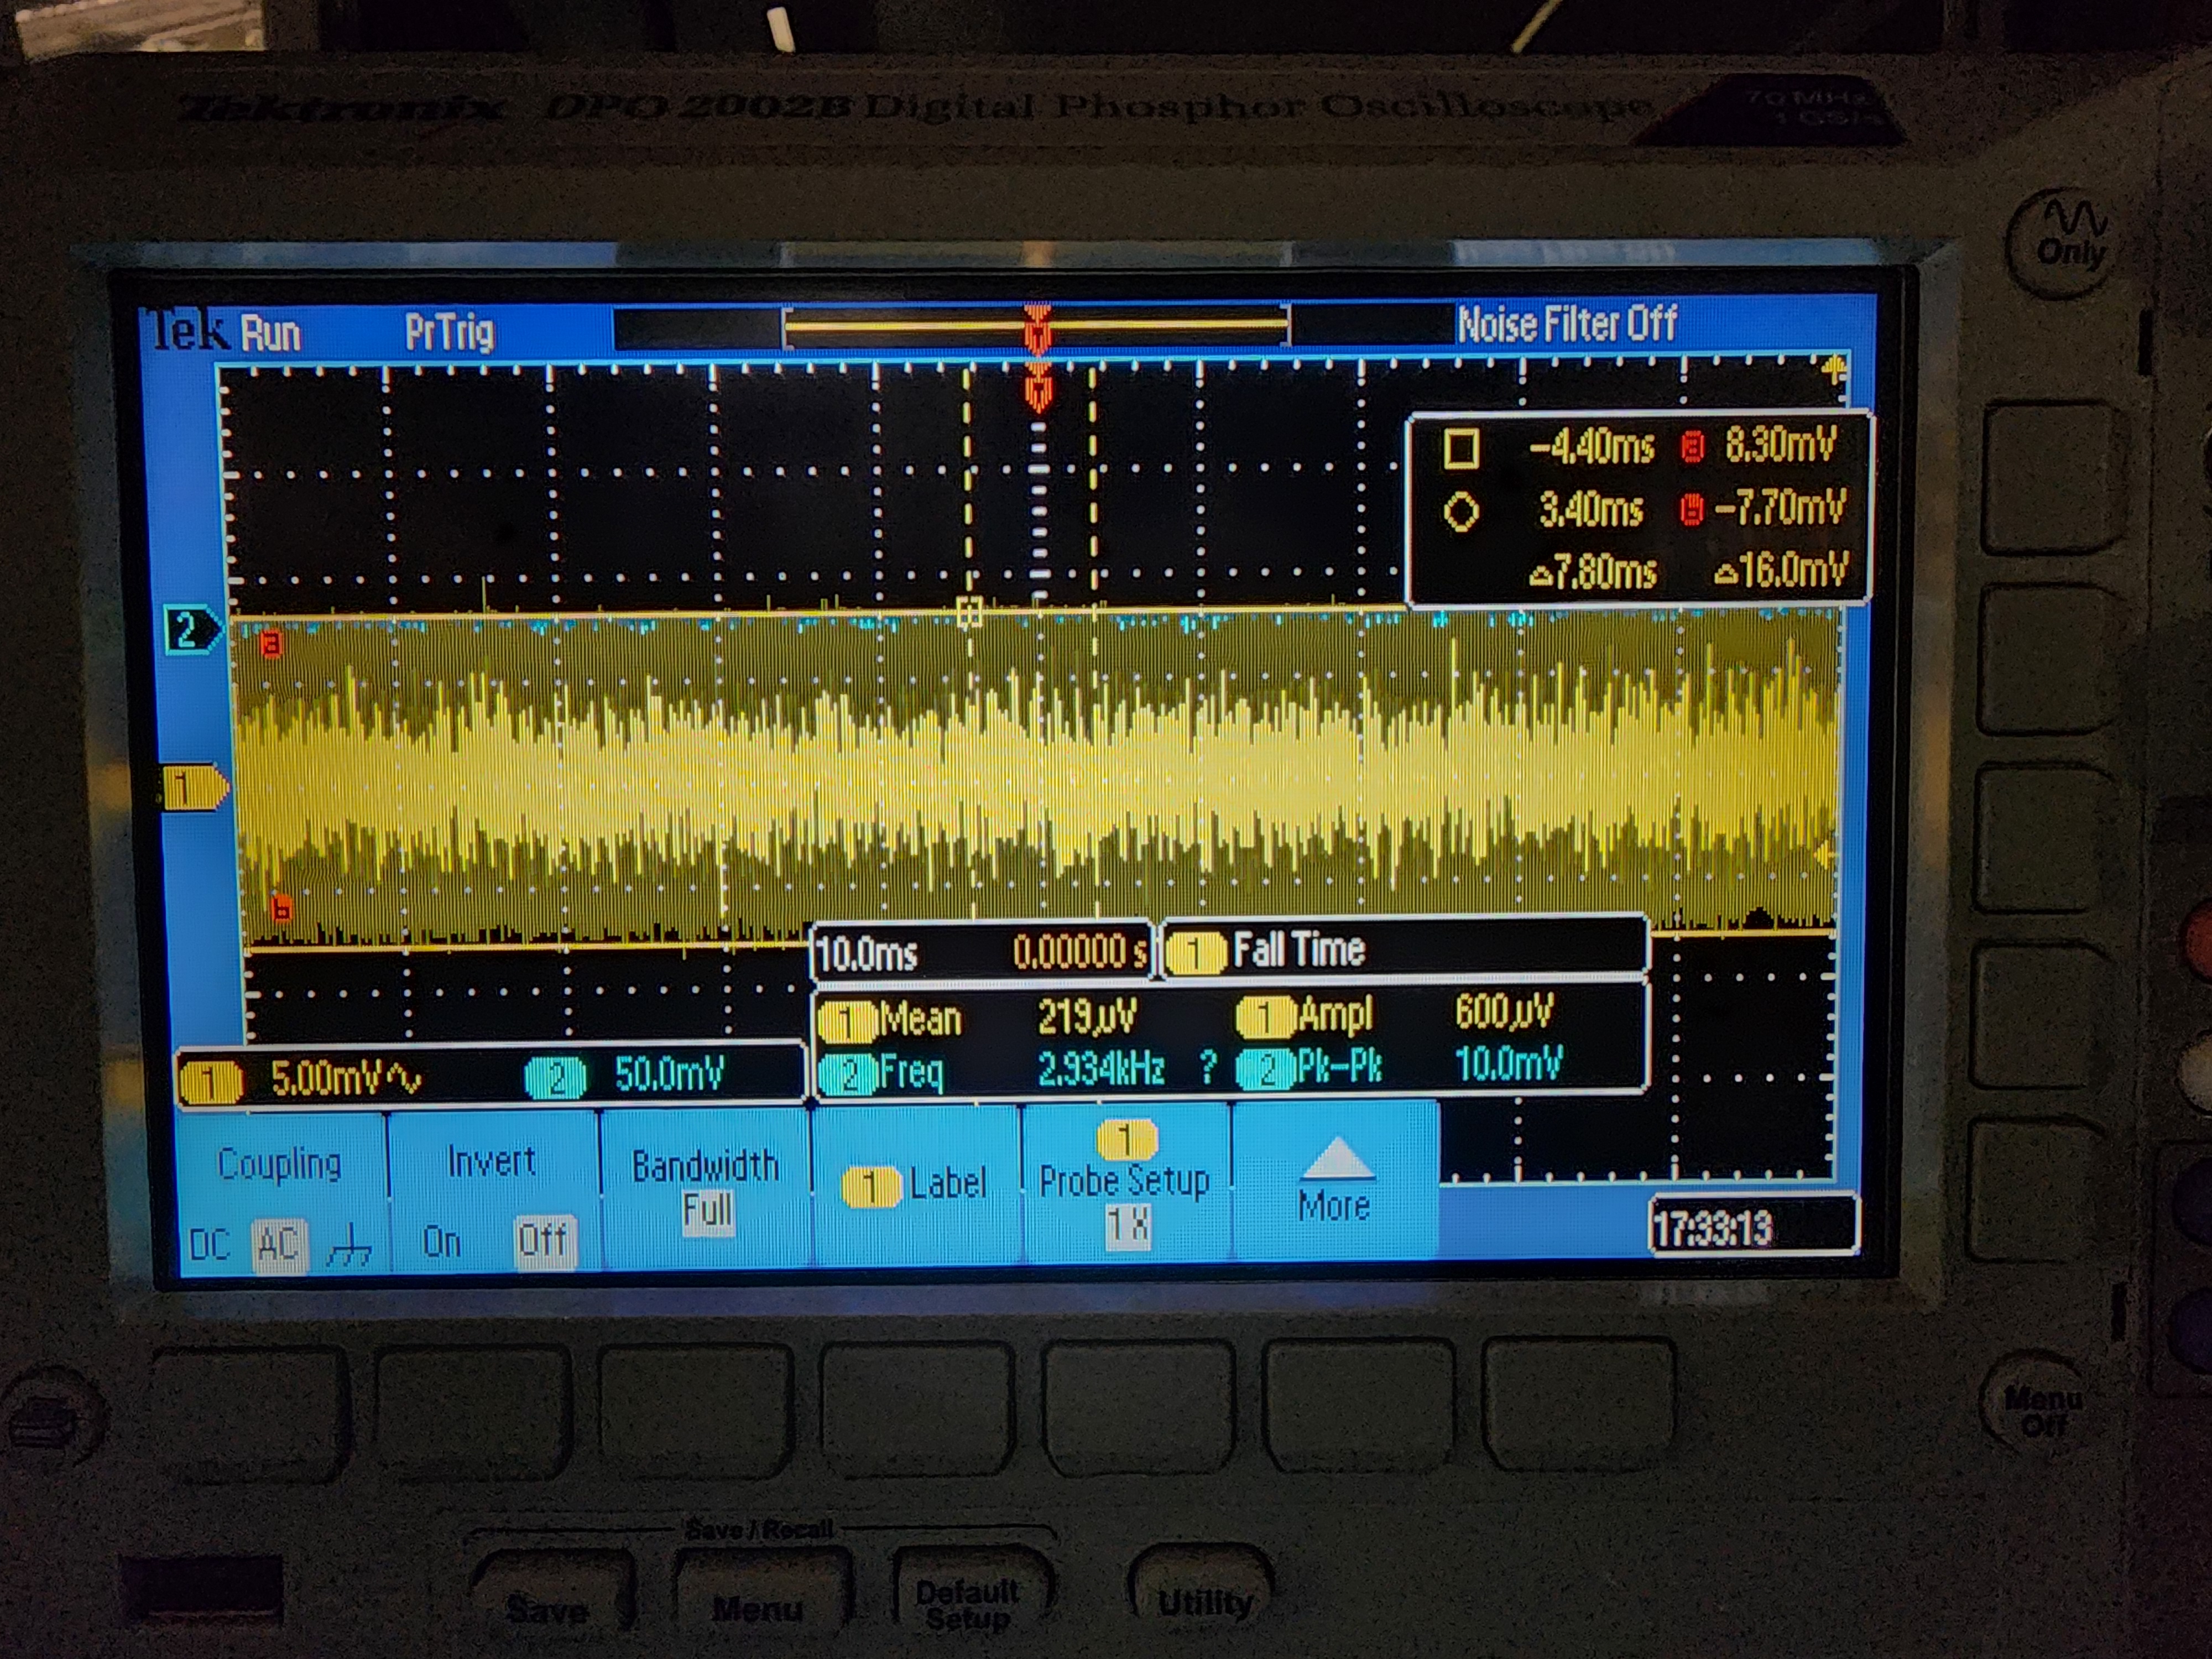
For 1 MHz deviation, I saw DC offset ~ 50 mV (vs 10V for Yuhang) and no apparent AC signal. (fig 1)
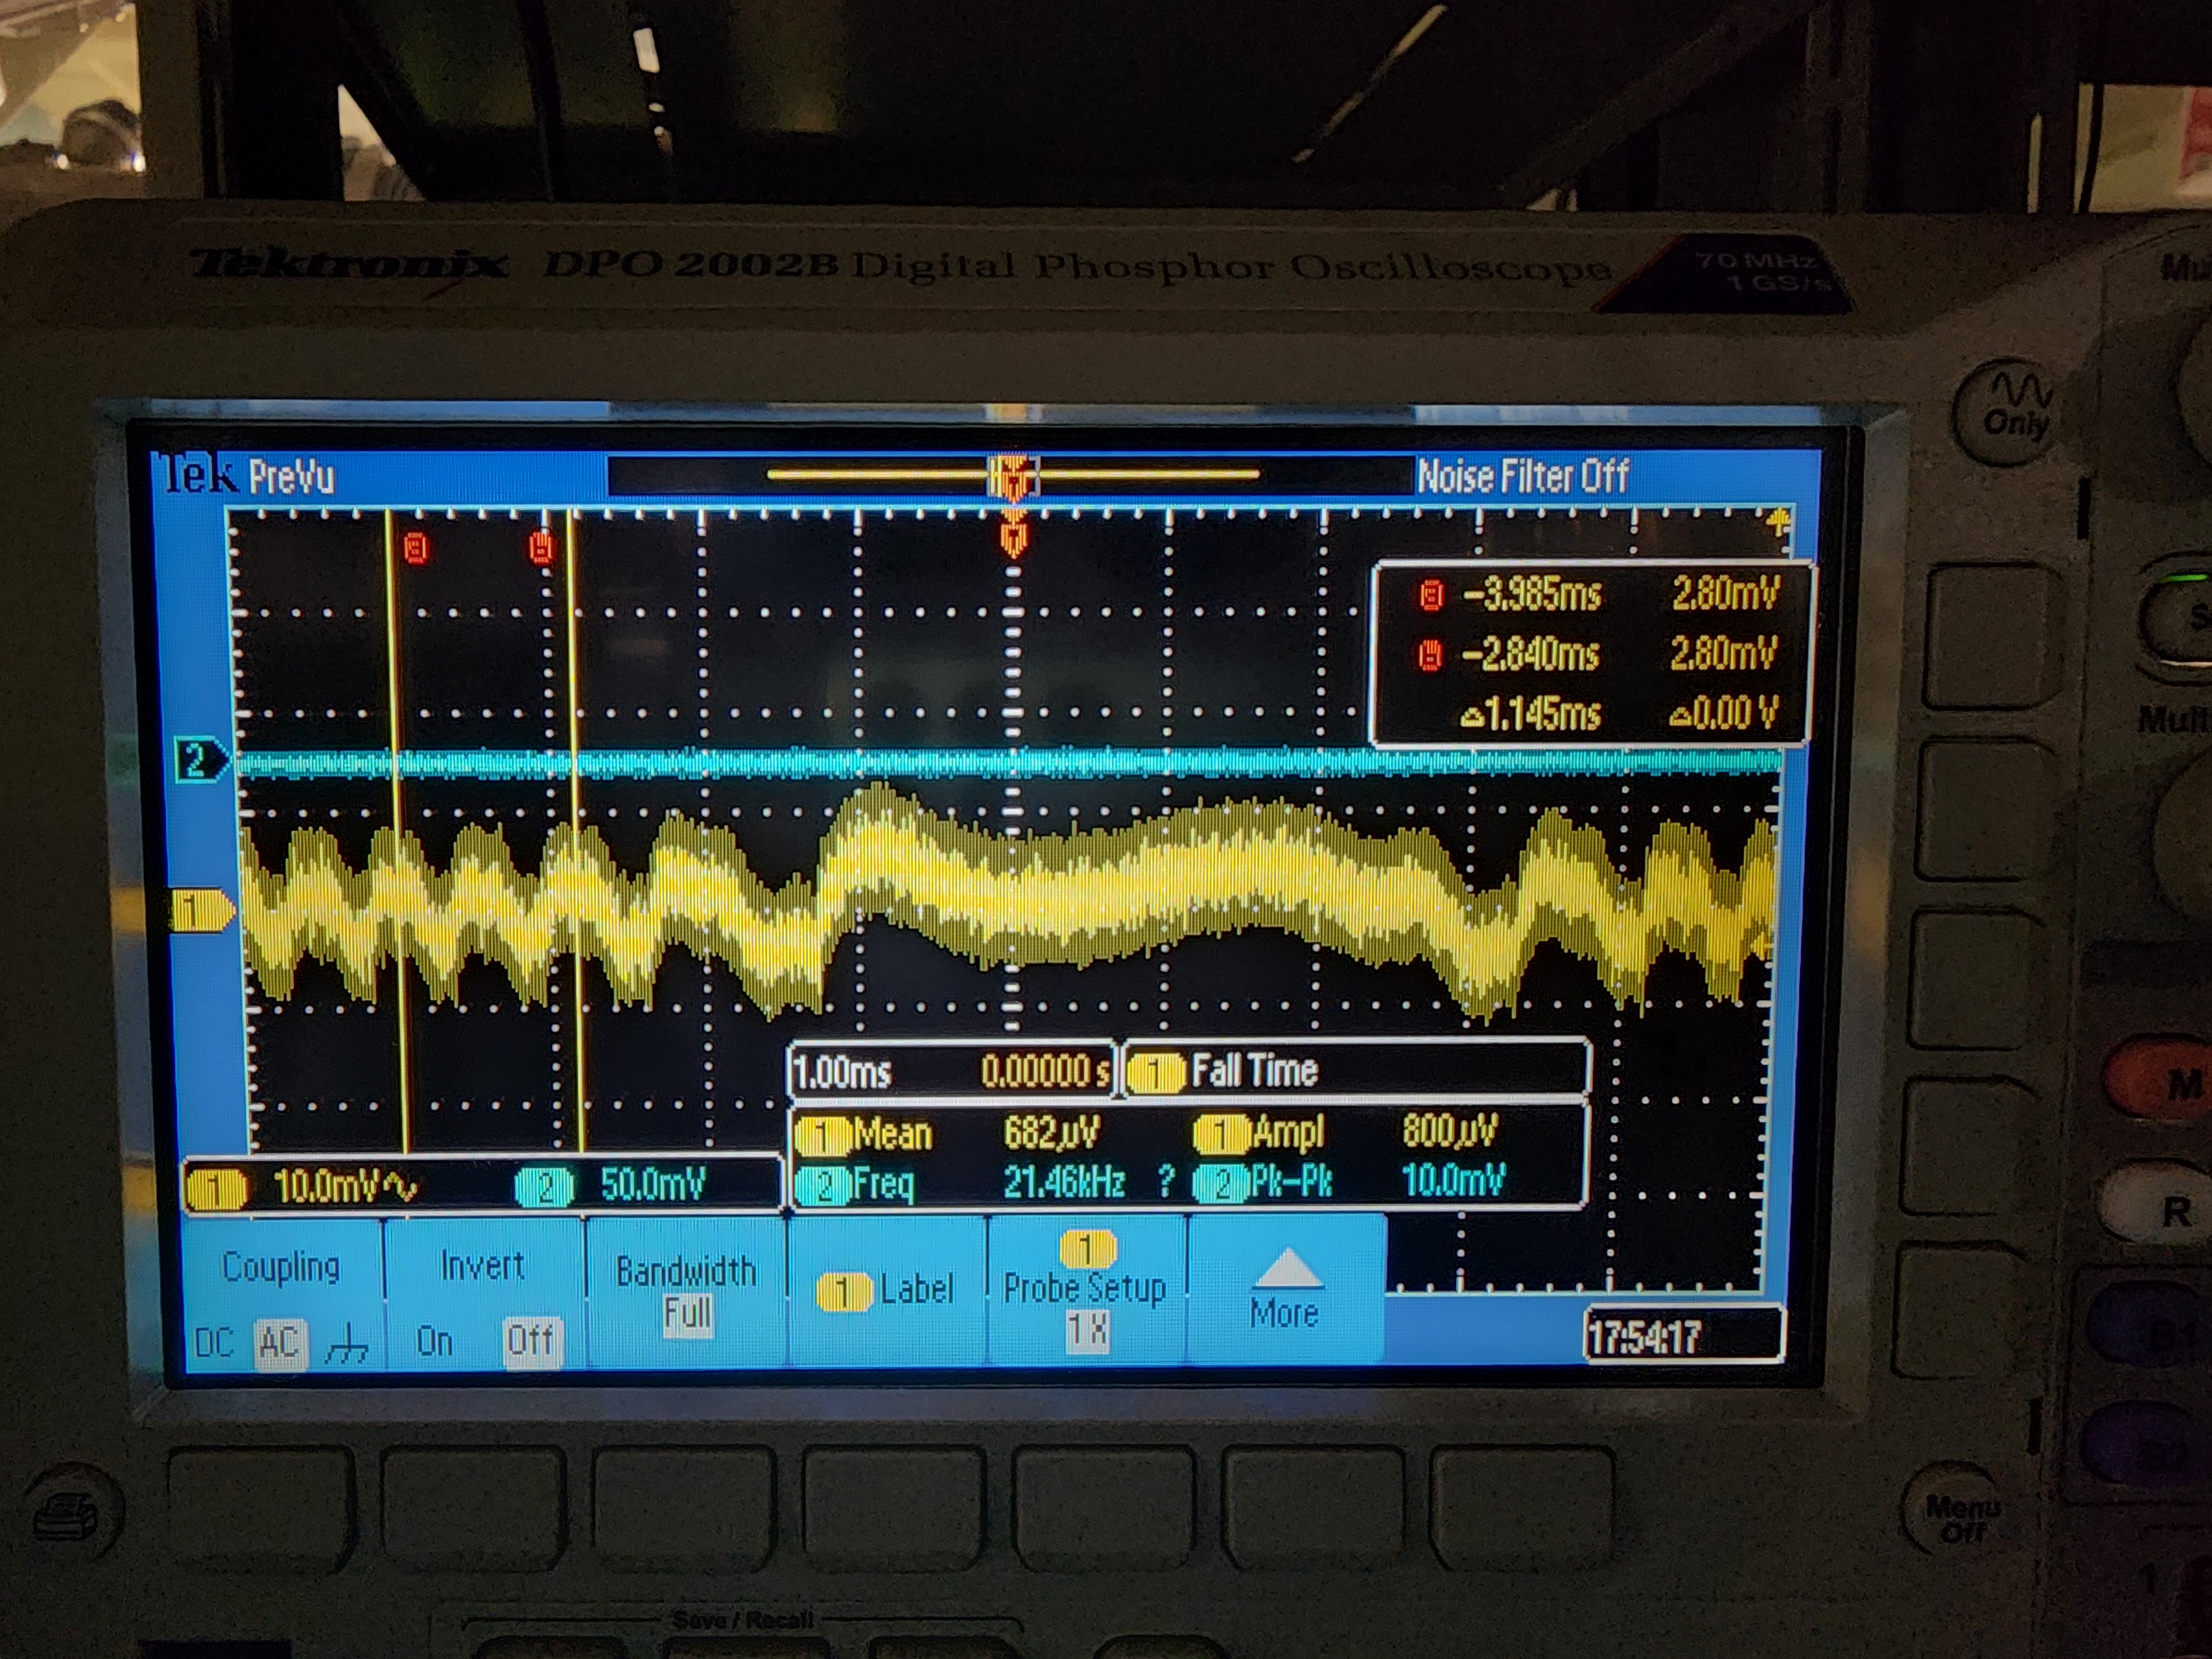
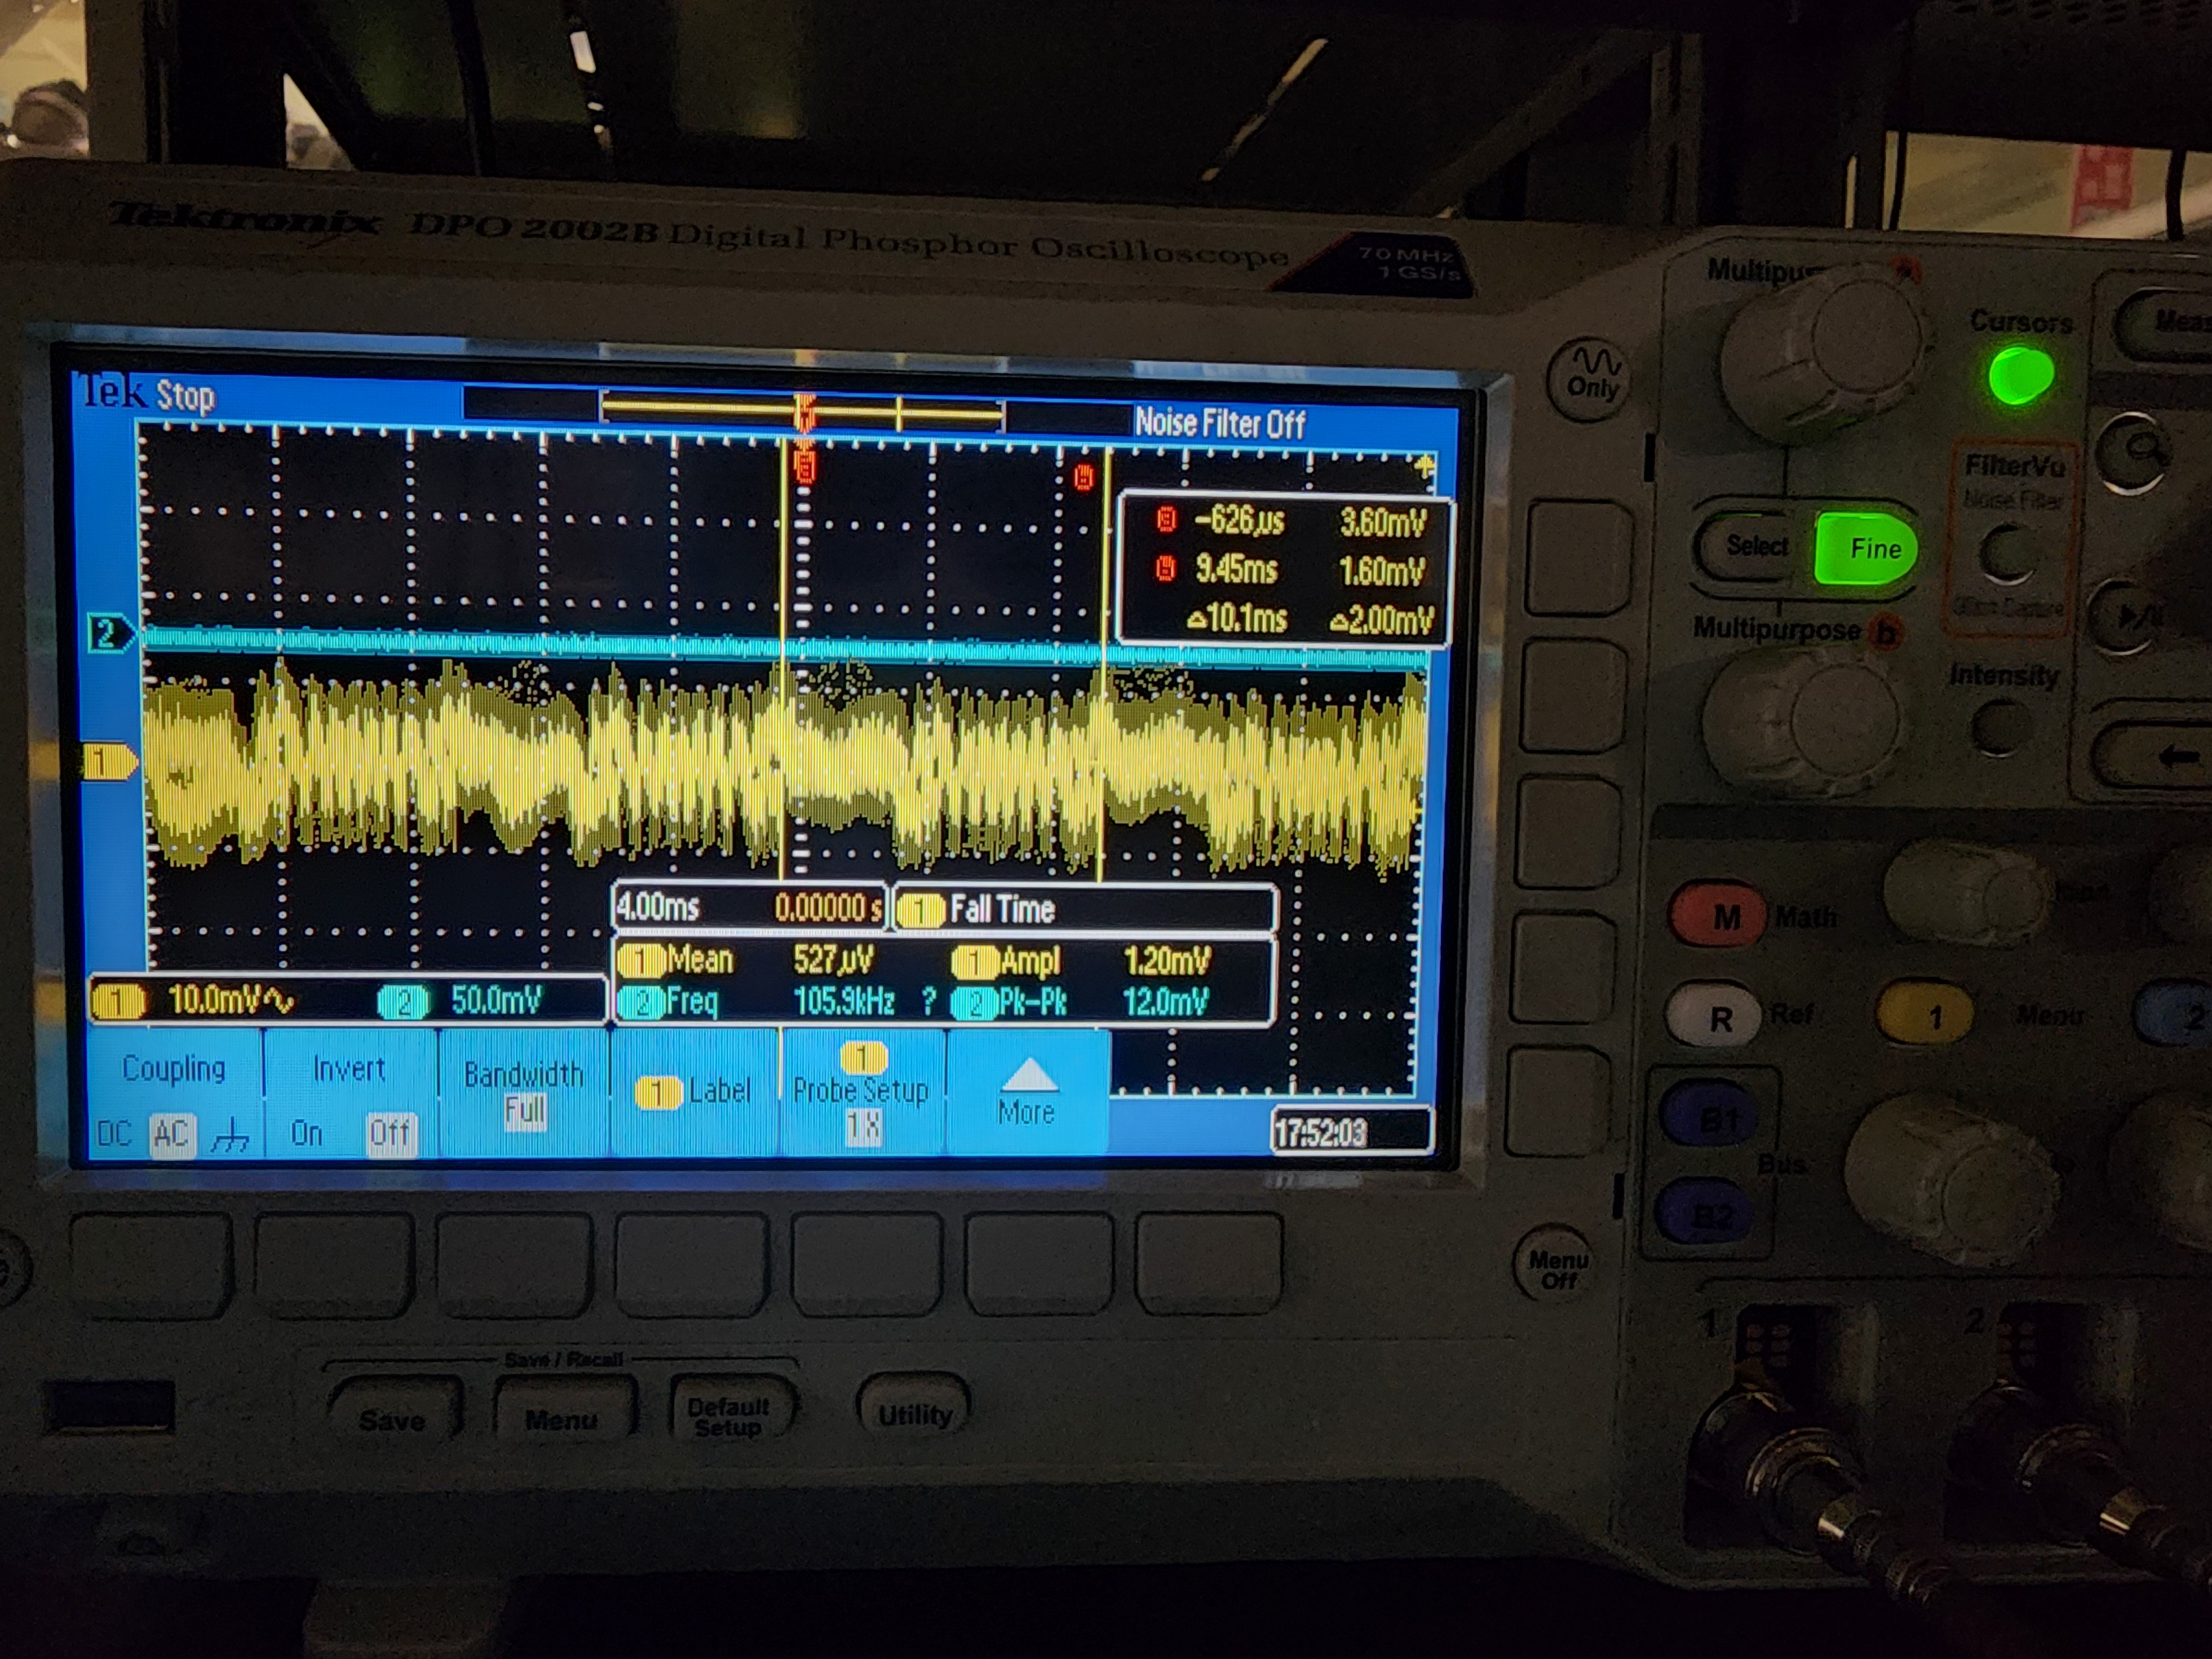
For 1 kHz deviation, I saw DC offset ~ 50 mV and a somewhat messy signal with several frequency components. One is about 1.7 kHz (fig 2) and 100 Hz is highlighted in figure 3.
Seems like the fast loop is behaving a bit strangely
I also stared at the fast and slow loop oscilloscope signal for a few minutes each but didn't see much glitch behaviour. Probably not a conclusive test though.
[Marc, Shalika]
Labview modifications :
A new sub-vi has been created 'step voltage' that scan LC1 voltage from min to max voltage with user defined step. Once it reaches the maximum, the LC2 voltage is increased by the same step.
The time of each iteration was defined to have 1 data / step.
There is some little issue sometimes where Vlc2 > Vmax... Maybe du to our exit condition that does not take into account the finite numerical resolution we might have...
Controller issue
We found out that when the Kinessis software is started after Labview, the voltage controller of LC1 can not be used..
This is indicated in our vi front panel if the 'controller' LED is off.
This was the case for previous measurement and is now corrected.
First polarization state generation!!
Figures 1 and 2 are respectively measurement and simulation.
They agree quite well with each others!
We need to improve the fit by taking more measurement (was done every 10 deg rotation) and improve the simulation by taking the temperature and extinction ratio of LC1.
The step voltage sub vi was fixed (misplaced connection) so I will spend the week end trying to generate and analyze 40 000 polarization states.
I'm scanning each LC voltage from 0 to 10V with 0.05V increment, at 30degC.
The output polarizer angle conversion is so that 298.25deg is our 0deg (ie cross polarizers configuration). The output polarizer will be rotated by 5deg increment.
Note that for tprevious measurement there is a -5deg offset with cross polarizer angle as it was assumed to be 293.25 deg.
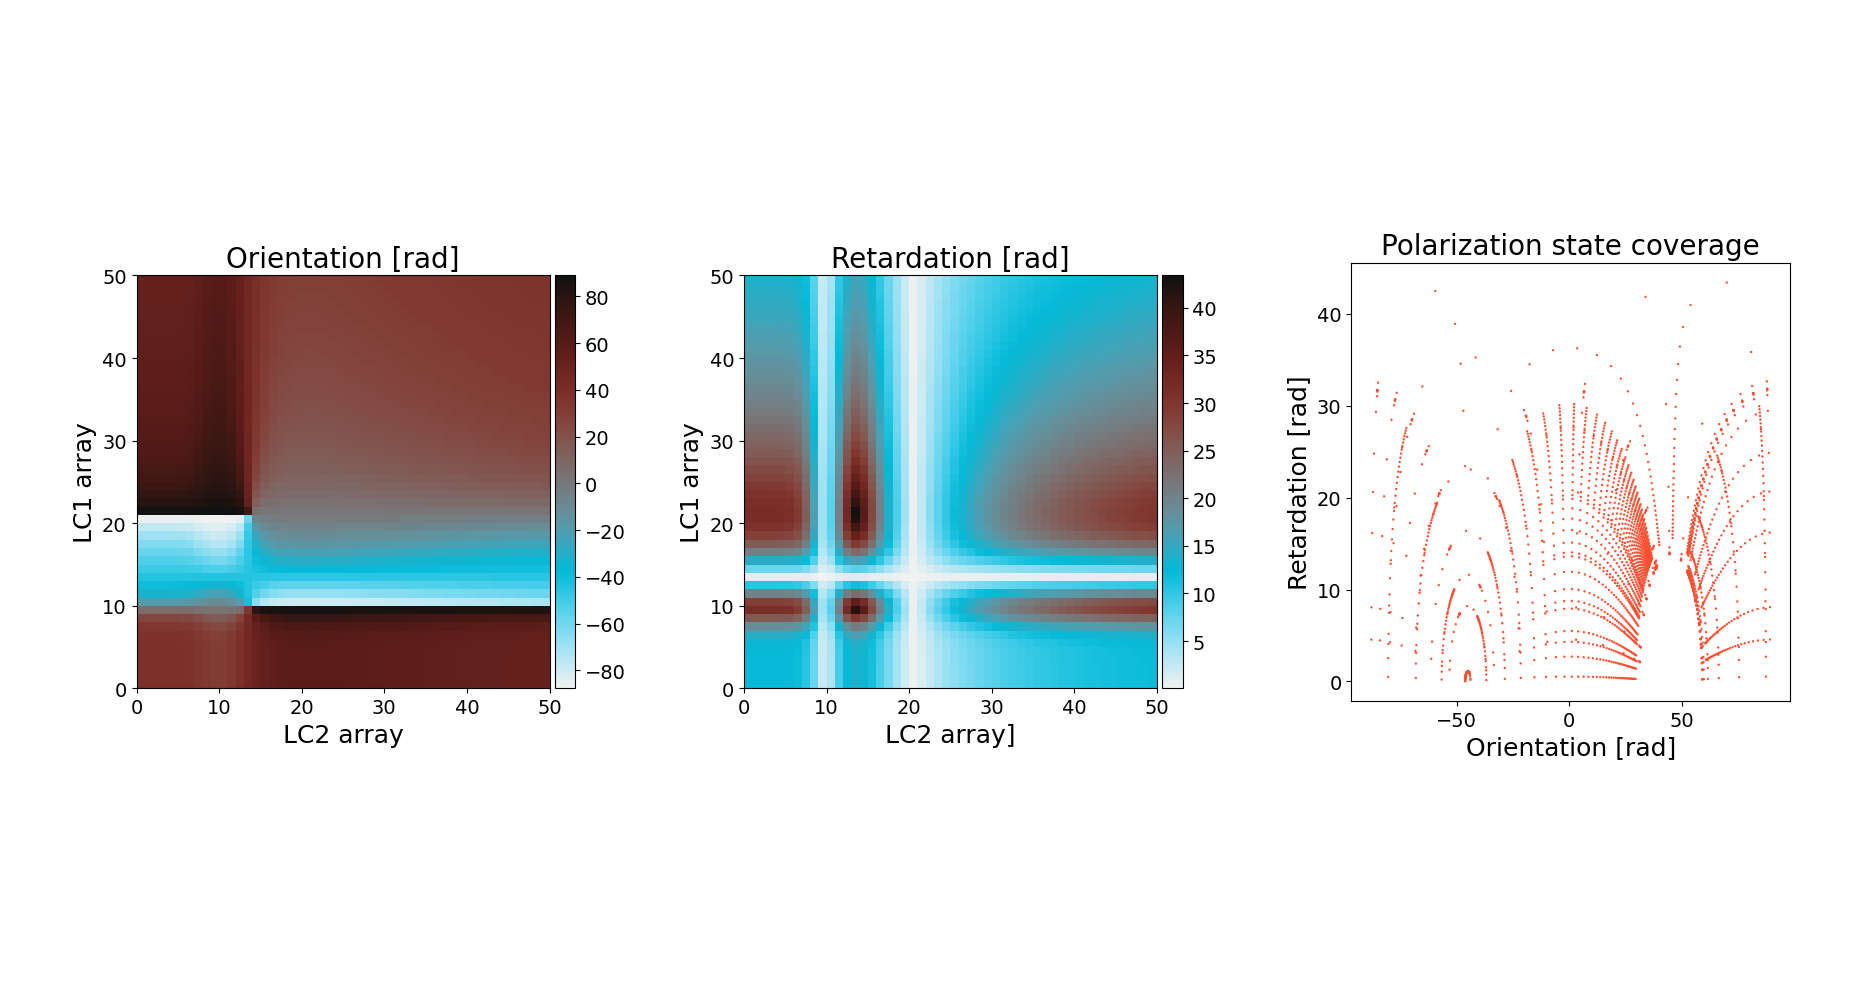
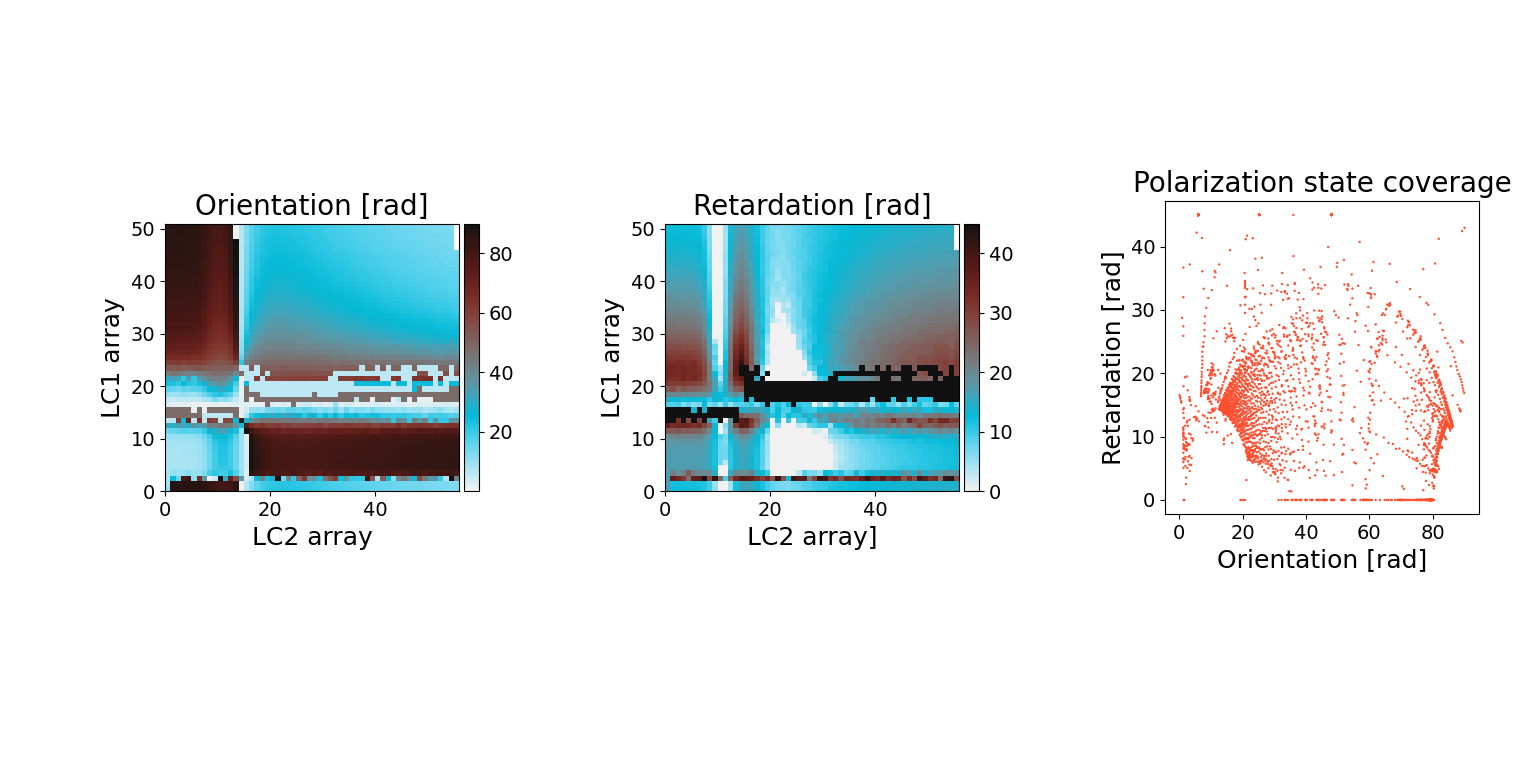
The goal is to scan the voltages of LC1 and LC2 and monitor the generated polarization state for each voltages couple.
LC1 fast axis is at 45deg of input polarizer and LC2 fast axis is at 0 deg of input polarizer.
The polarization state is scanned by rotating the output polarizer rotation by 5 deg increment from 0 deg (cross polarizer configuration) to 180 deg.
Labview modifications :
In order to somewhat efficiently scan our voltage space parameters, we modified the 'Sawtooth Formula Voltage Theta' subvi to scan our parameter space.
We can apply 1 sawtooth to each LC voltage controller with a user defined phase shift and frequency ratio. Below we used a 11:12 frequency ratio with 0.5 Hz frequency applied to LC1 (11/12*0.5Hz for LC2).
They are each doing 10 periods and then the output polarizer is rotated by 5 deg.
Analysis :
The data are stored in 2 files : one from rotation angle of 0 to 90 deg and one from 95 to 180 deg.
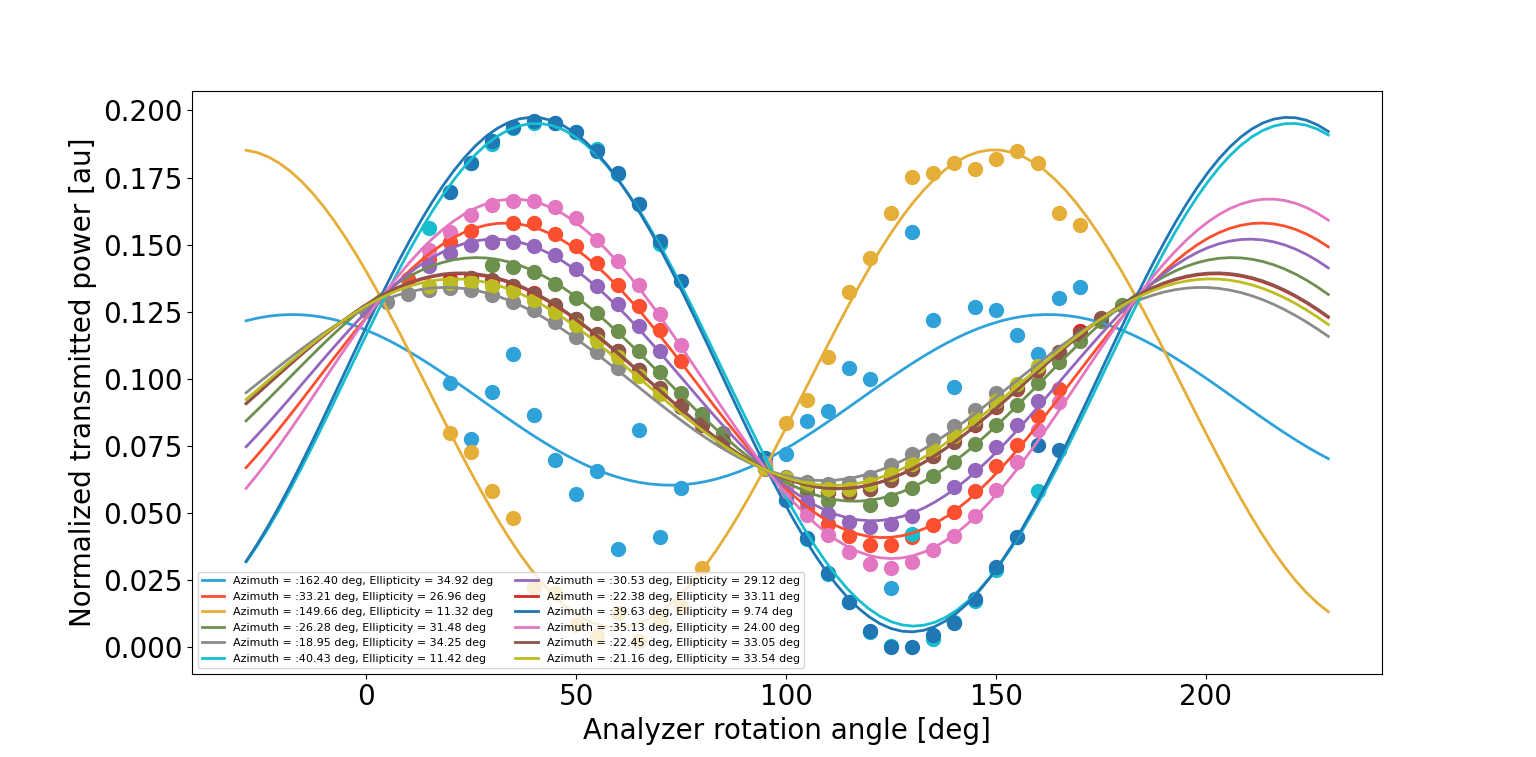
All the data are combined, voltages are rounded to 0.1V and for every couples (V_LC1,V_LC2) if there are at least 25 rotation angles values, the data are further processed. More precisely, the normalized transmitted power is fitted by P(theta) = a/2 * ( 1 + cos (2*ellipticity) + cos (2 * (theta - azimuth))
In the fit, the initial guess of the azimuth is given by the rotation angle with maximum transmitted power.
You can see some results in the attached figure (in total we have 1161 couples that meet our requirements).
next steps
I would like to replace the sawtooth scan by a step function scan to avoid the 0.1V rounding.
It could be useful to optimize our Lissajous scanning coefficients
In order to characterize the polarization states generated by our LCs, we can rotate the output polarizer while applying different voltages to our LC.
As our motorized rotator is from Thorlabs, we had to switch the position of our input and output polarizers.
We estimated the extinction ratio of our polarizers to be about 25 000 each.
Then, we calibrated again each LCs as shown in fig 1 and 2 for LC1 and 3 and 4 for LC2.
Their respective fast axis direction is 45.74 deg and 69.00 deg.
From figures 2 and 4, the maximum retardation at these angles is below 6 nm offset from 532 nm which indicates a misalignment of about 0.01 deg from the fast axis from simulation.
[Marc, Hirata, Sato, Takahashi]
This morning we opened PR chamber to take measurement of the in-vacuum Faraday Isolator. Indeed, the base plate has to be modified to be compatible with the new rotator.
Sato-san took precise measurements but it is something like 80mm along the beam direction and 90 mm in the transverse direction. In addition, we might have to move output polarizer holder. We have about 5 mm margin left and right (screw is at the center of the range) and the holder base is 25 mm from the edge of the FI baseplate towards the squeezer bench.
Also, because the BS oplevs are again giving strange signals, I realigned the green beam into the filter cavity before closing the chamber.
Moving PR I centered the beam on BS gate valve and got the beam on the first target (usual top-left of the hole). Then, I move both PR and BS to maintain the beam on the first target while recovering mostly the PR target.
Finally, I moved BS to get the beam on the 2nd target. At this position, I could confirm that both PR and BS coils actuators are working as expected.
The vacuum is now on-going.
[Marc Shalika]
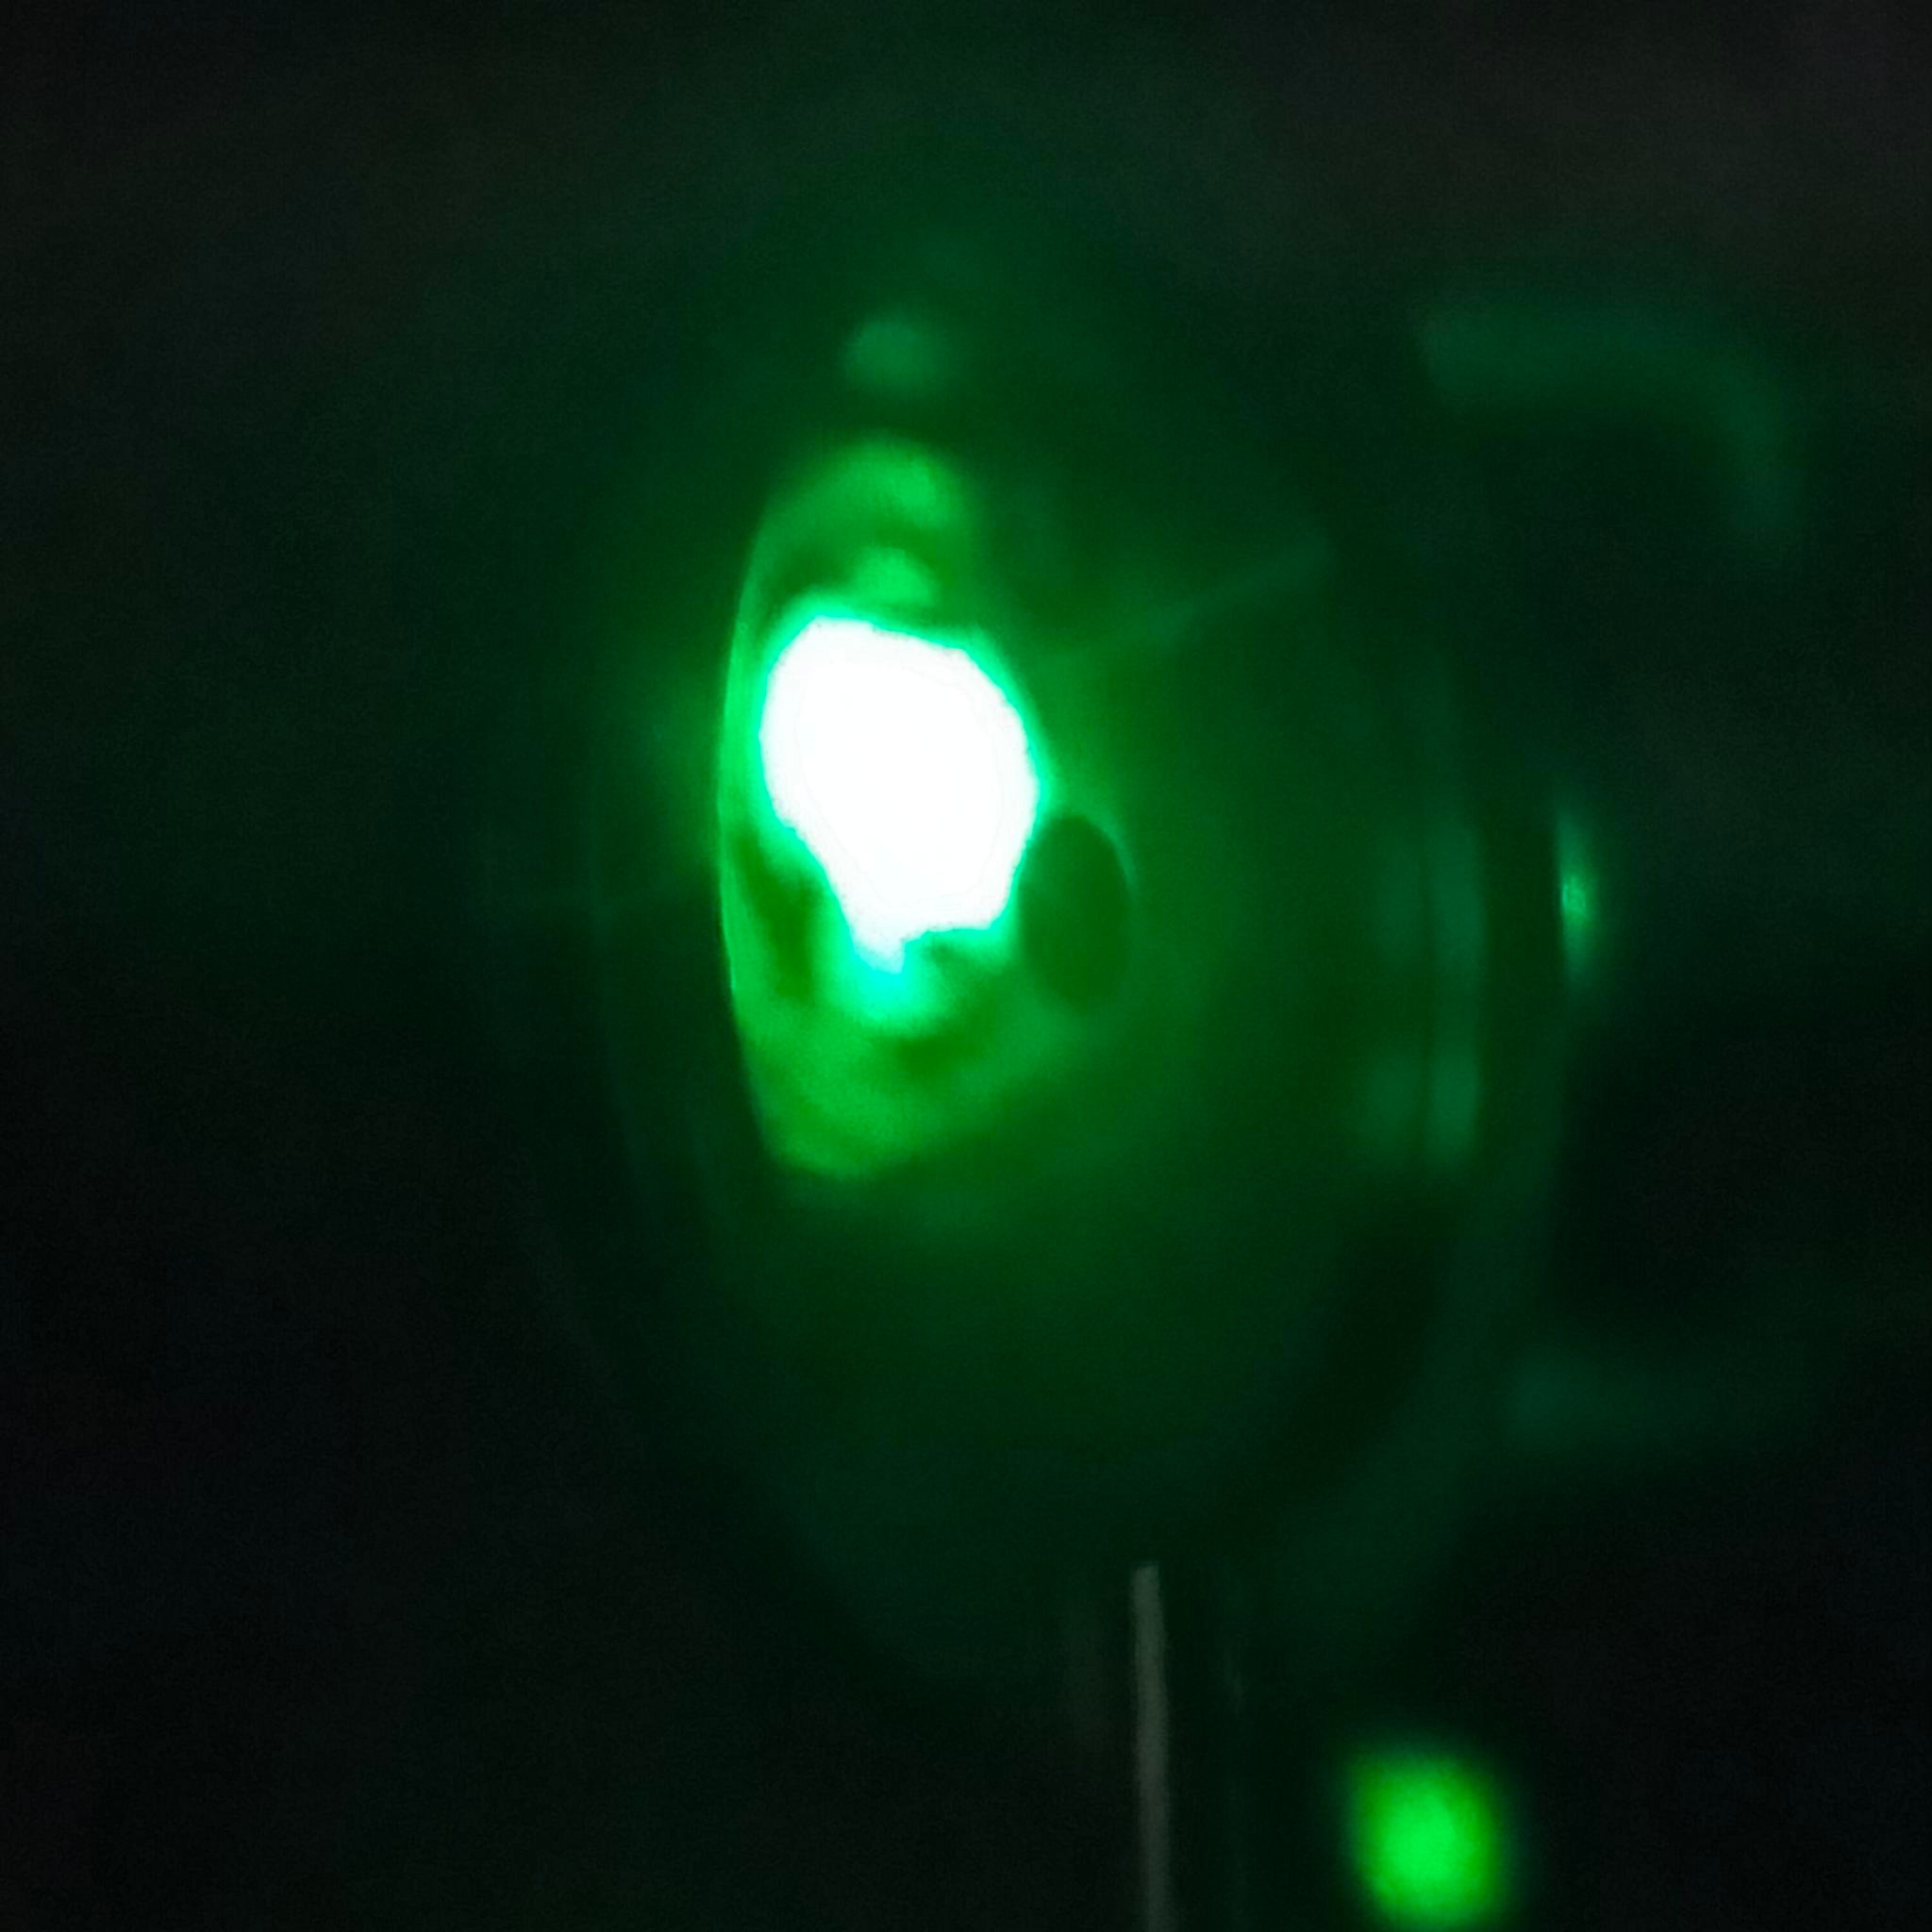
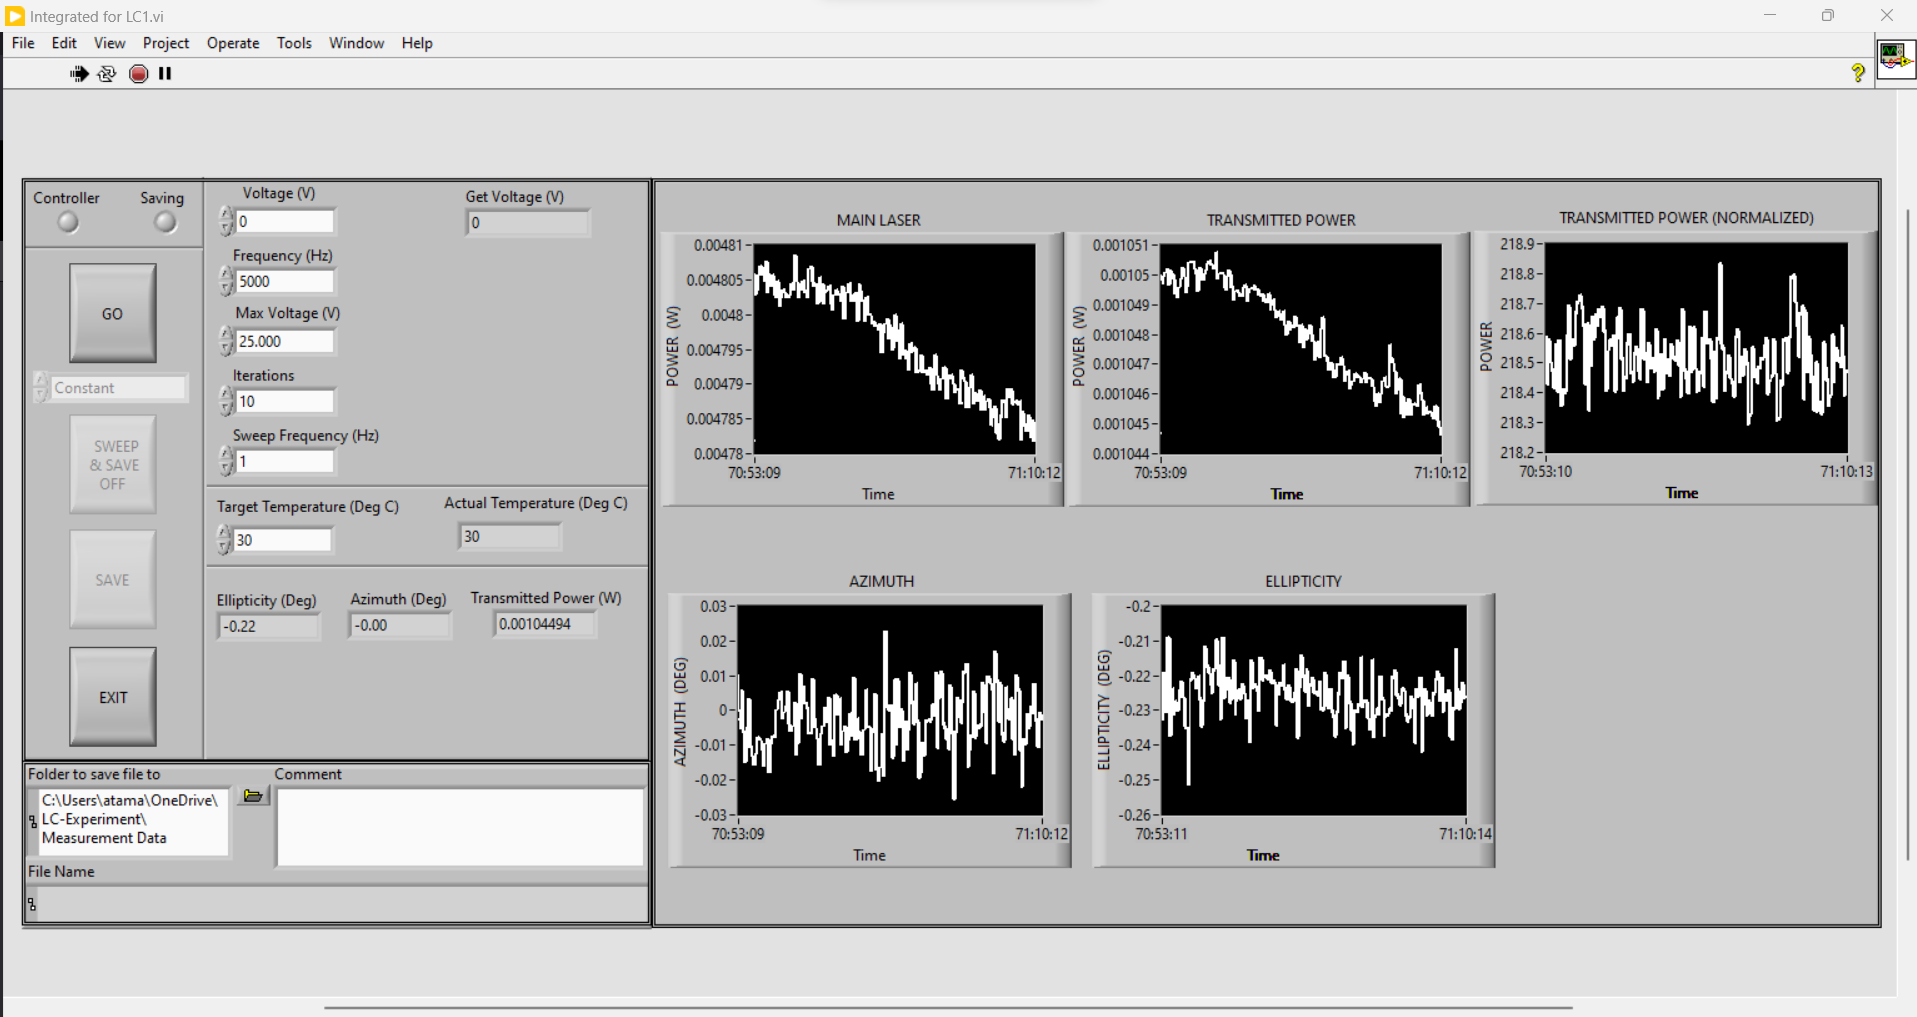
For all these measurements we set up HWP and QWP at the input beam to have as linear as possible light from our polarization camera.
Then, we placed the input polarizer aligned with this linear polarizer as in fig1. We got aximuth angle ~ - 0.05+/-0.05 deg and ellipticity ~ -0.23+/-0.02 deg.
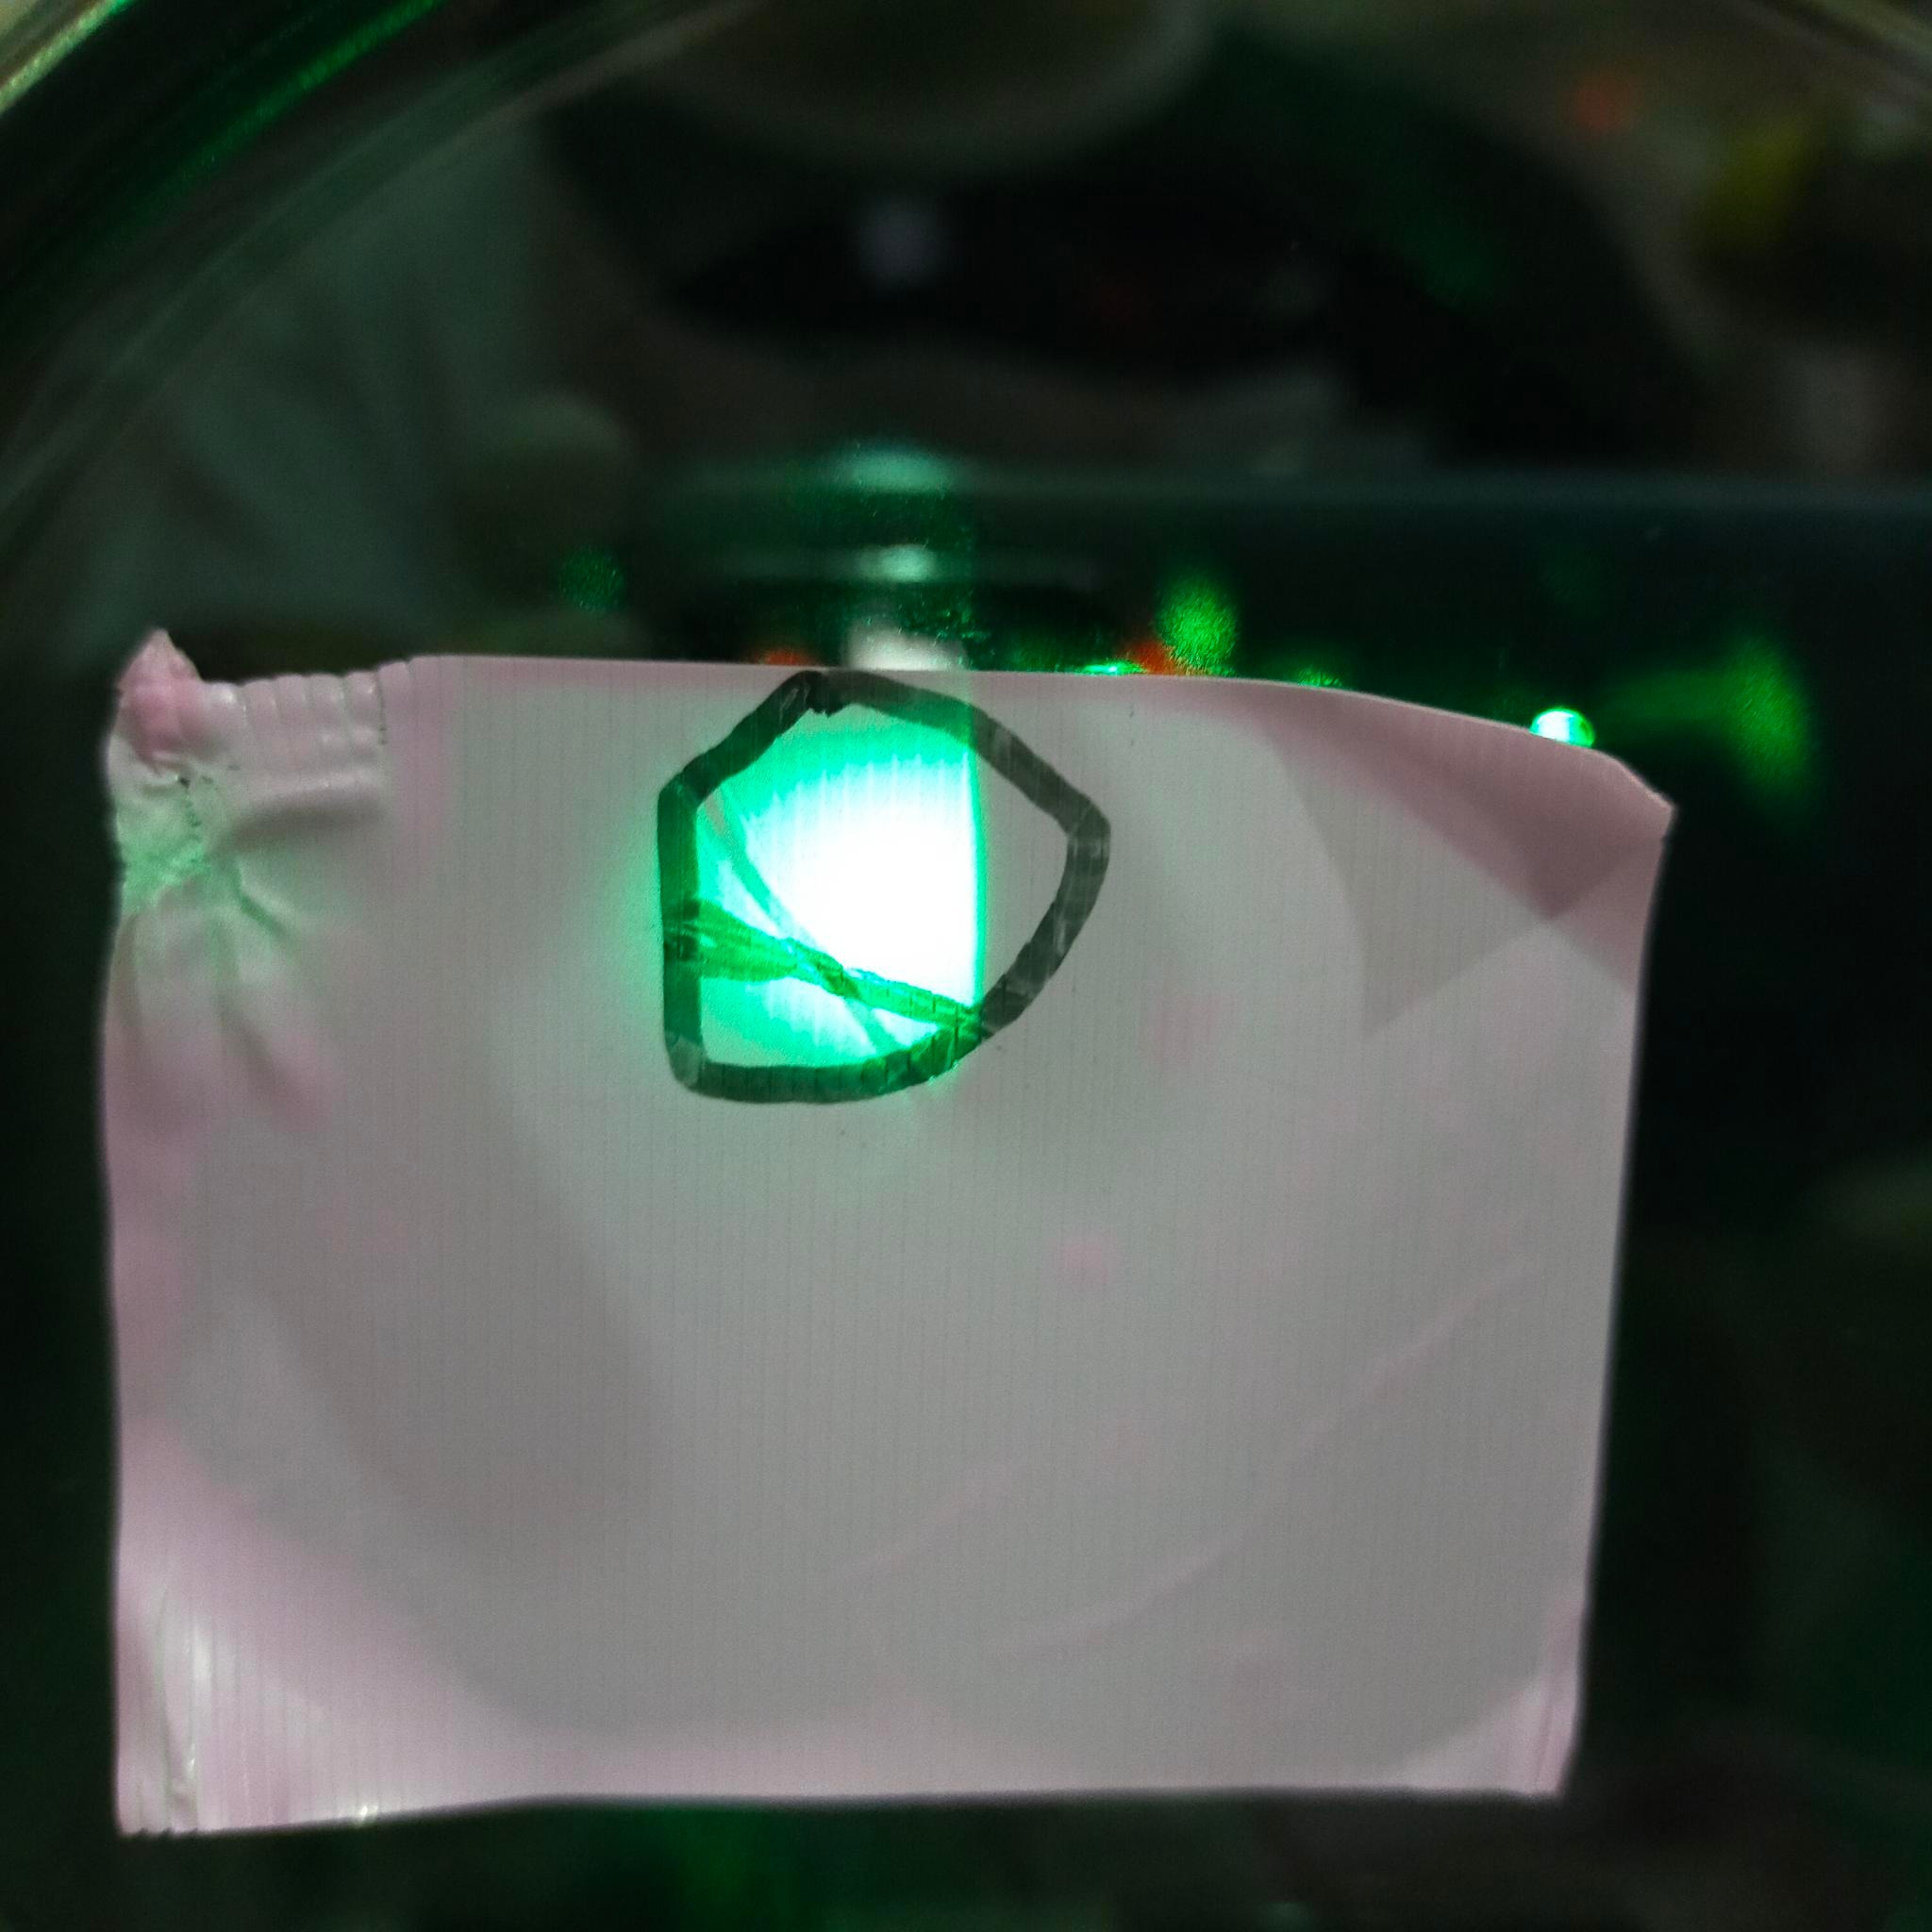
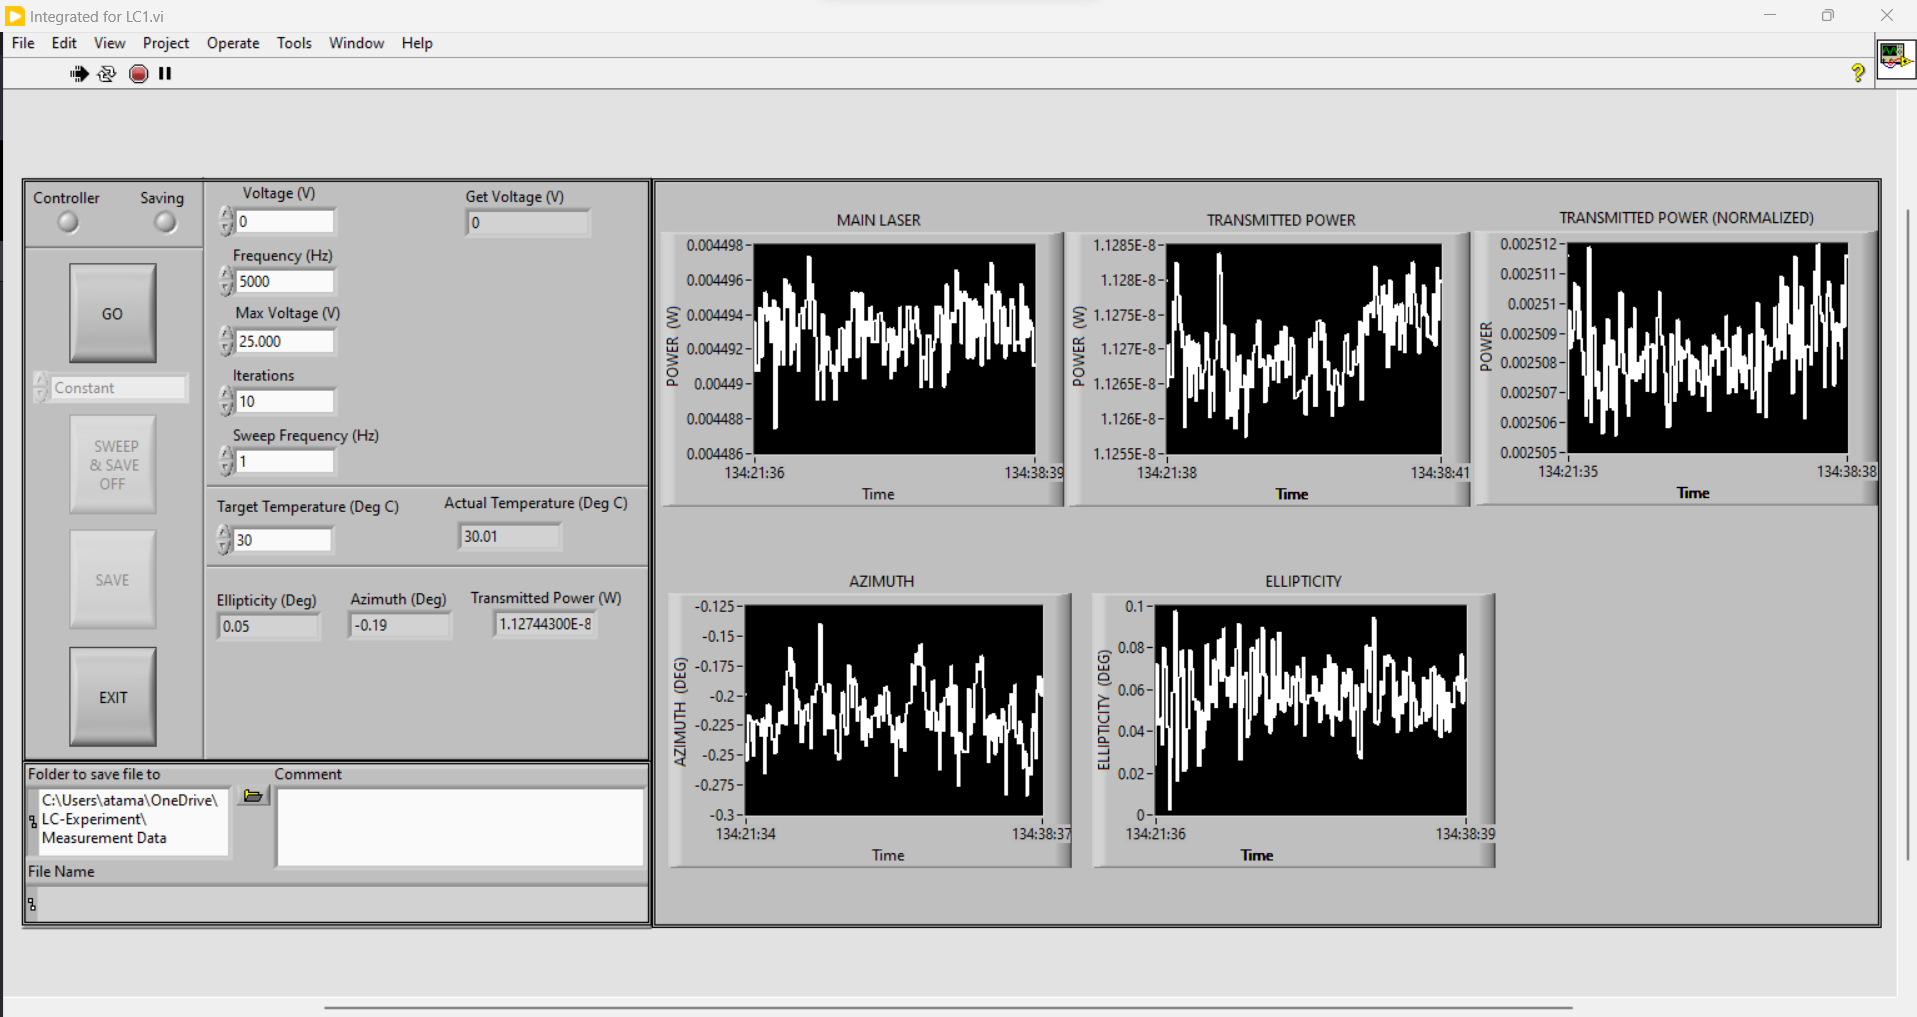
After installing the output cross polarizer we got azimuth angle ~ -0.025+/-0.05 deg and ellipticity ~ 0.06 +/-0.02 deg as in fig 2.
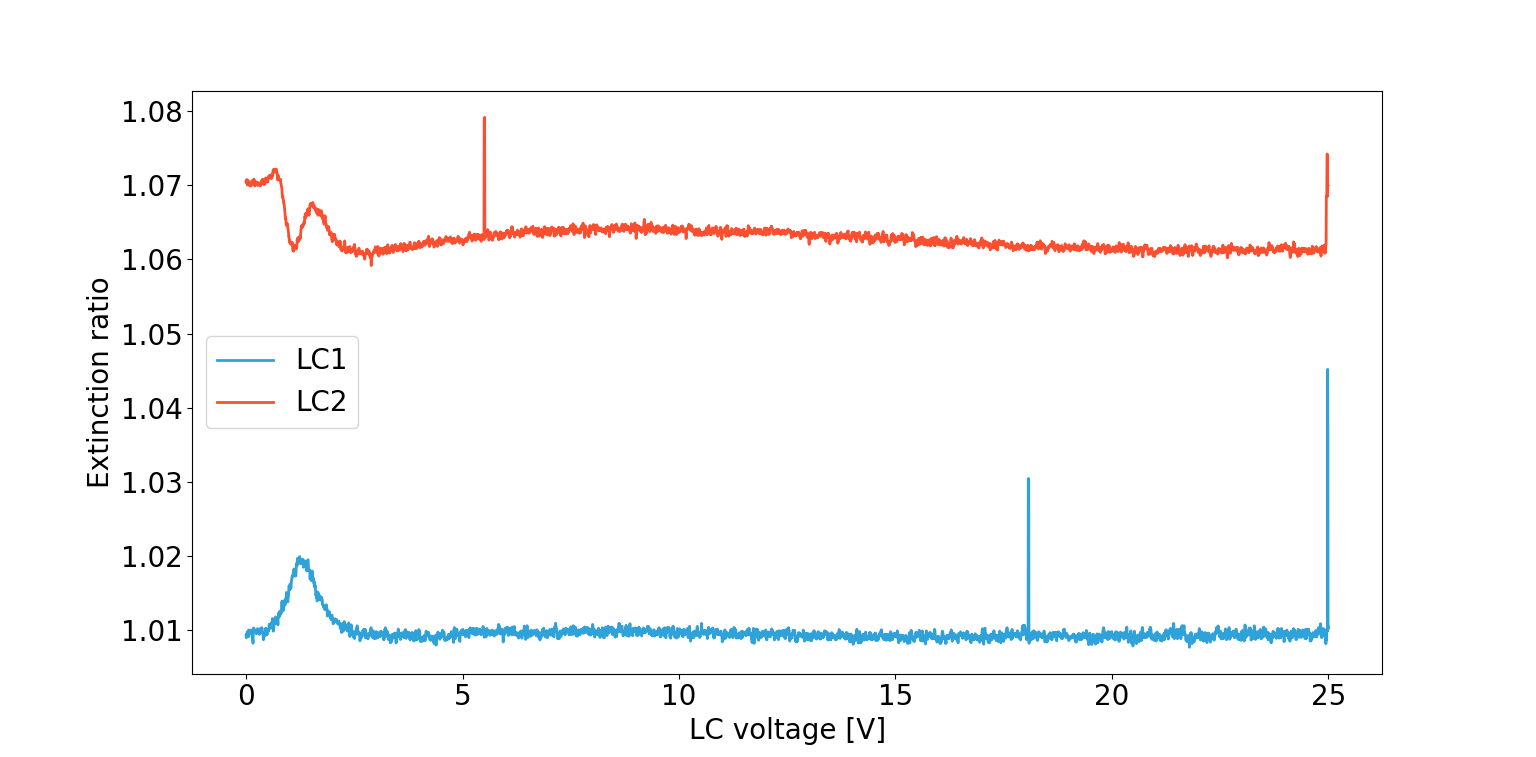
- Extinction ratio
Before installing the output polarizer we installed each LC successively. We rotated the LC to find the minimum and maximum transmission. Then we swept the LC voltage from 0 to 25V and computed the extinction ratio from the transmitted power normalized by the input power.
For LC2, we found the max and min positions were matching well the principal axes but it was not the case for LC1...
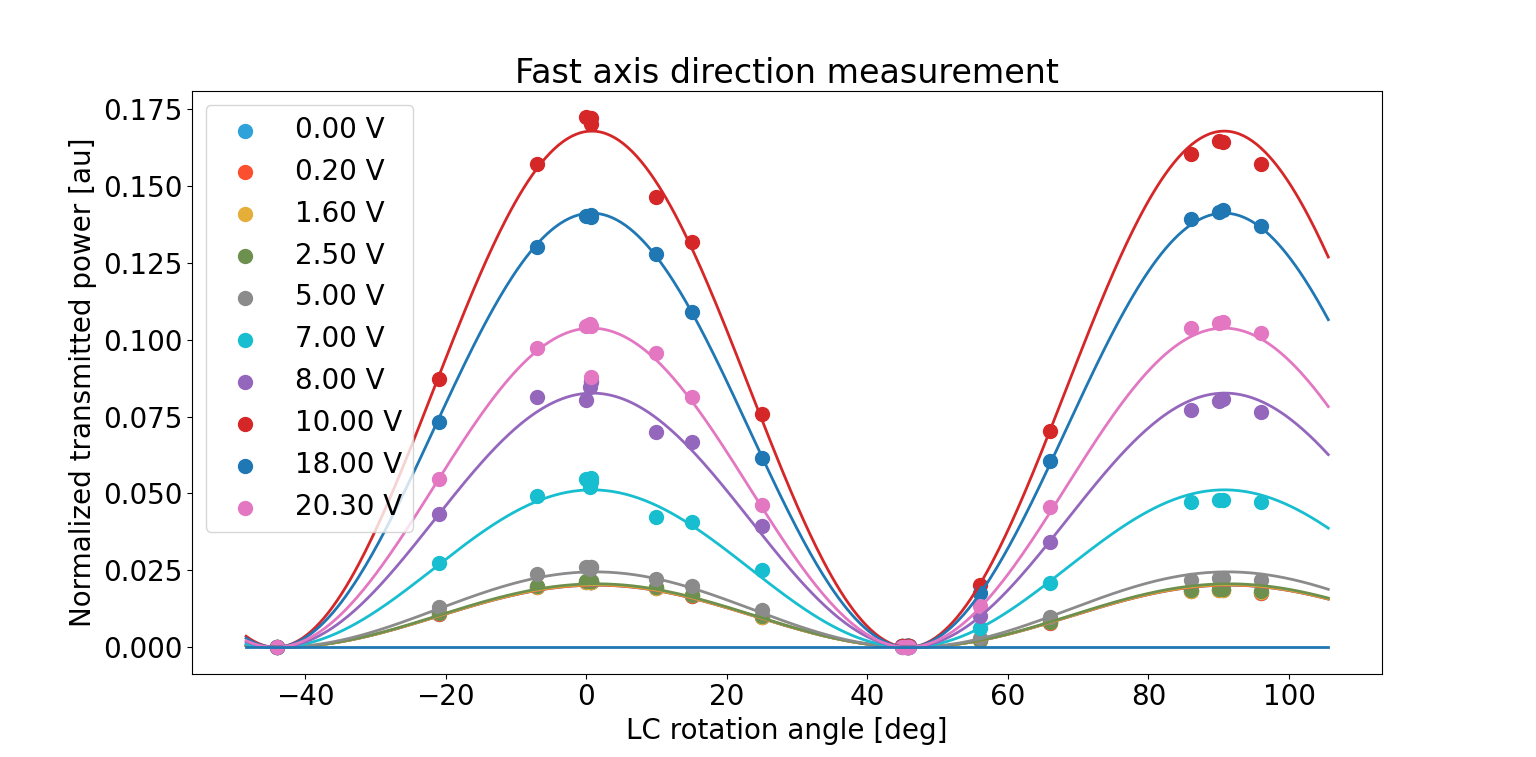
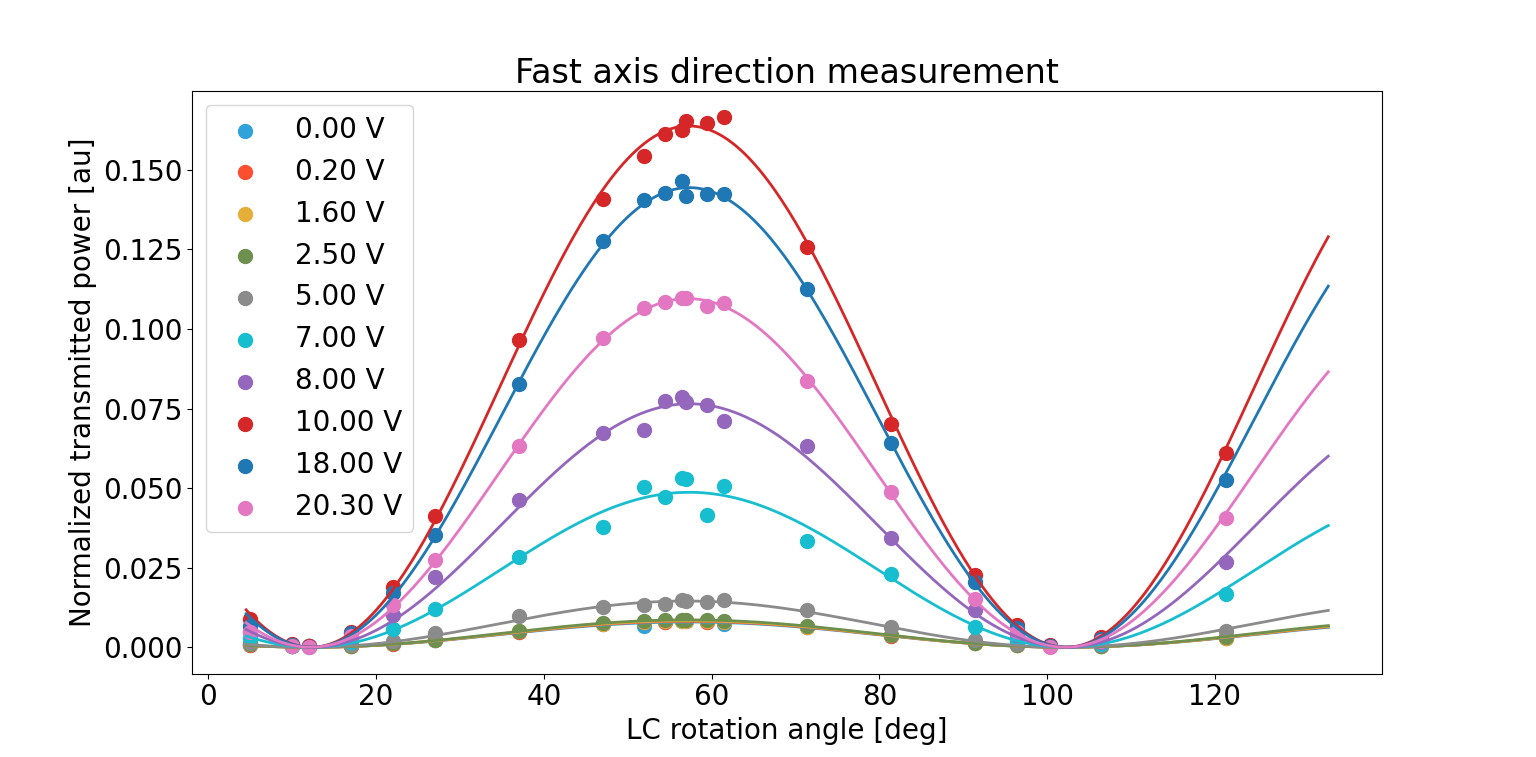
- Fast axis direction
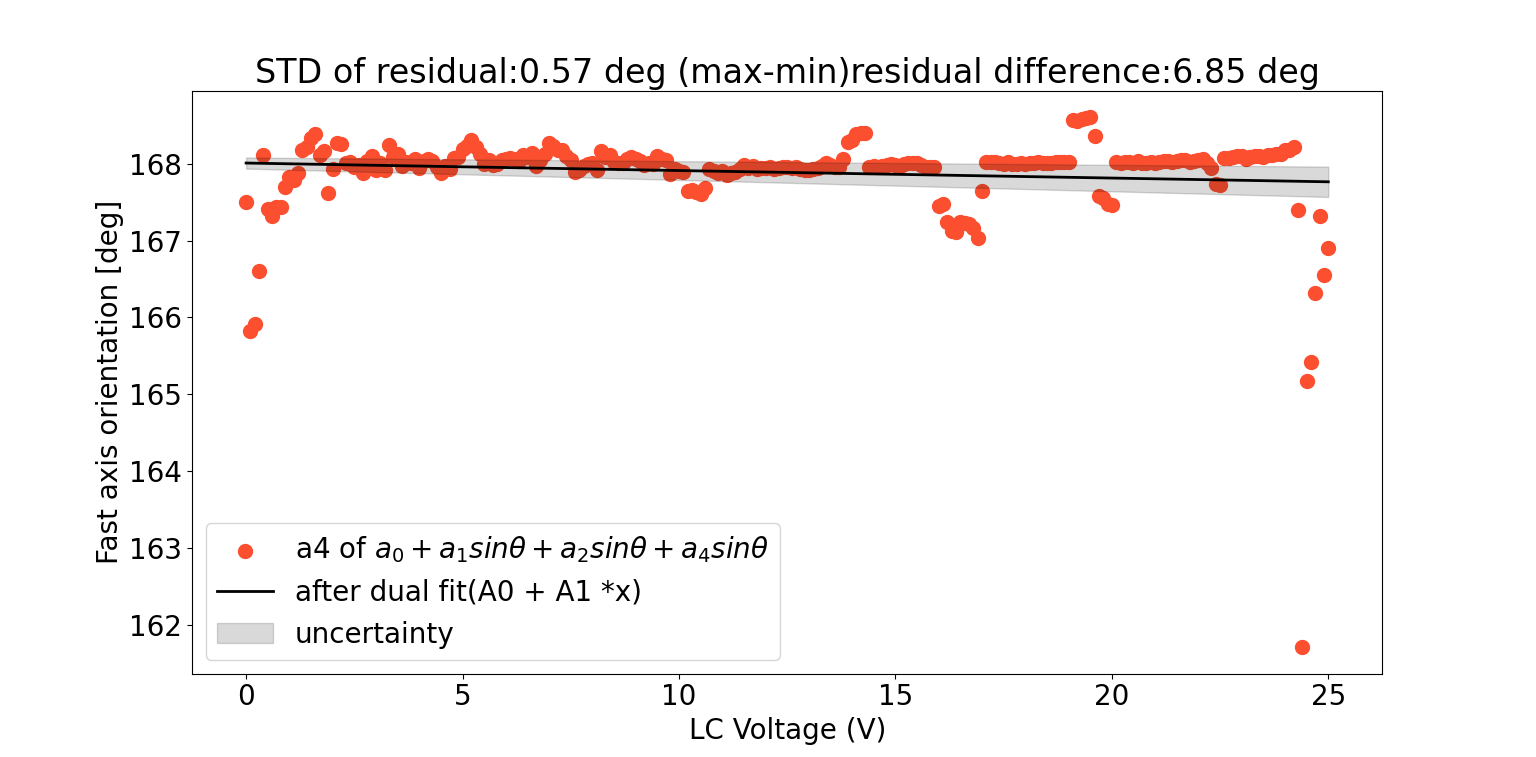
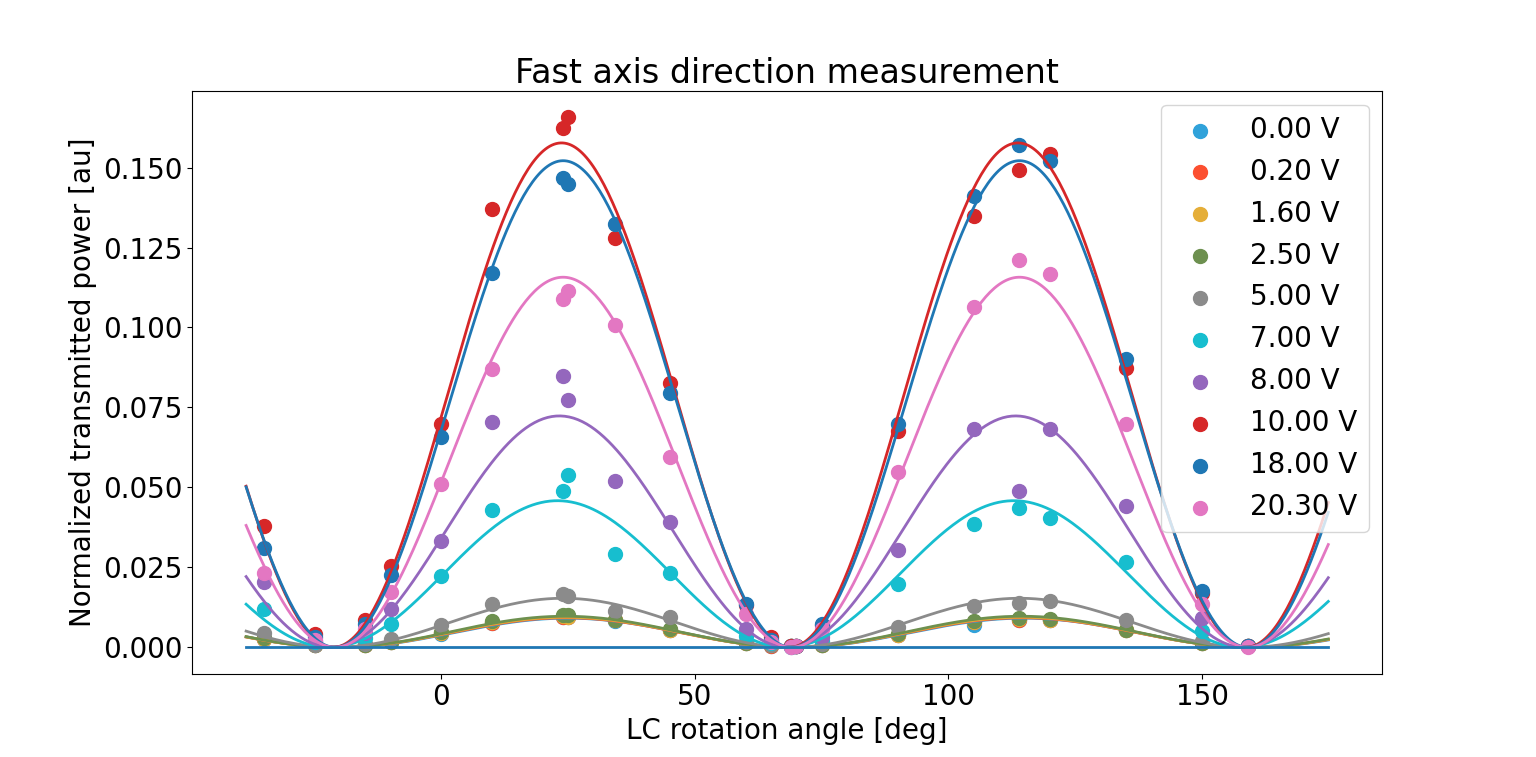
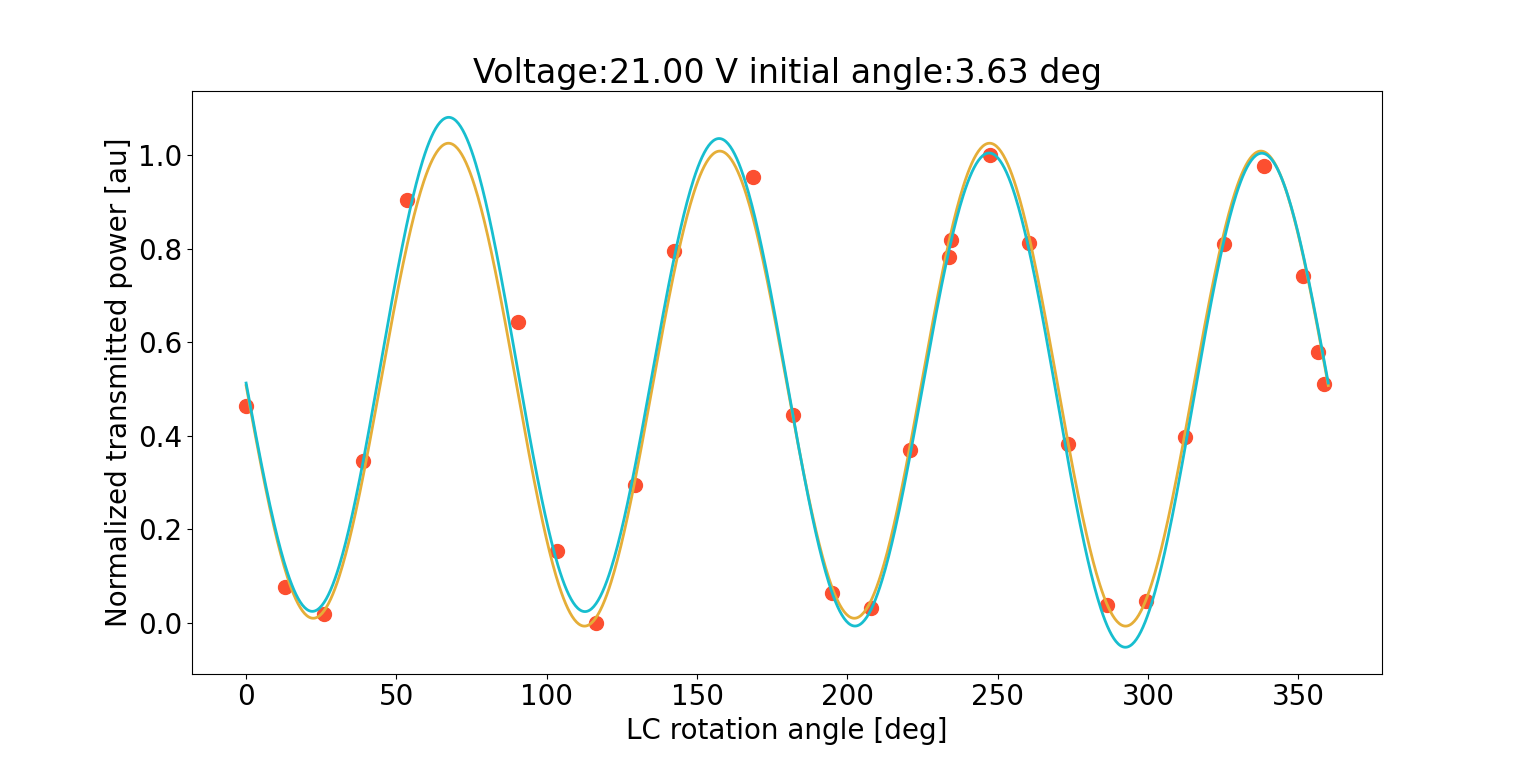
As pointed out by Shalika, our previous estimations of the LC fast axis where really dependent on the fitting parameters range. It could come from the fact that using several sine harmonics in our fit biased our estimation. We decided to use a different formula : P_trans = a * sin(2(theta-theta0))^2 with theta the rotation angle of the LC.
We swept the LC voltages at various rotation angles covering more than 90 deg as in fig4 for LC2. From the fit we could extract the fast axis direction of 12.18 deg. This is in really good agreement with our 'by hand' estimation of 11.43deg.
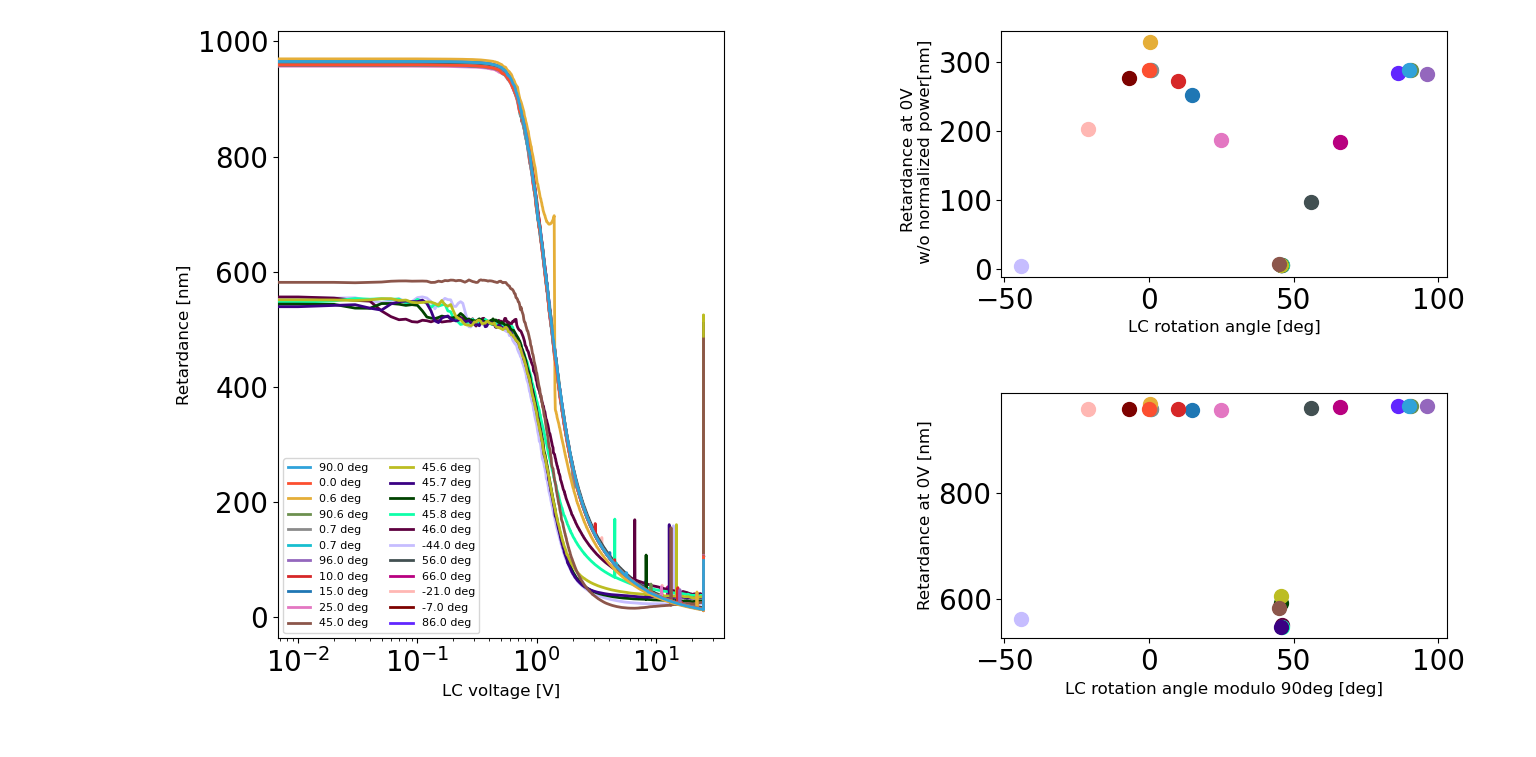
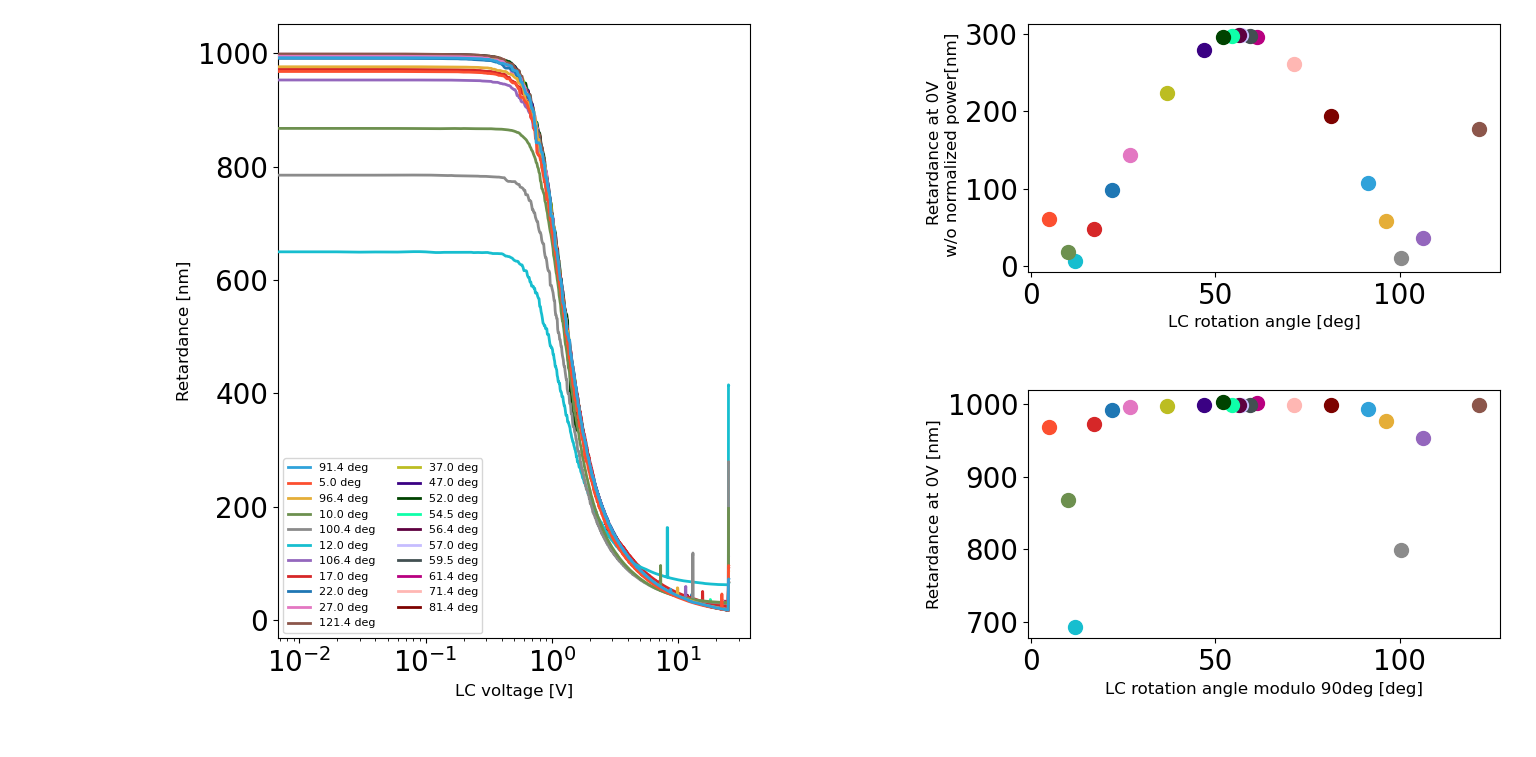
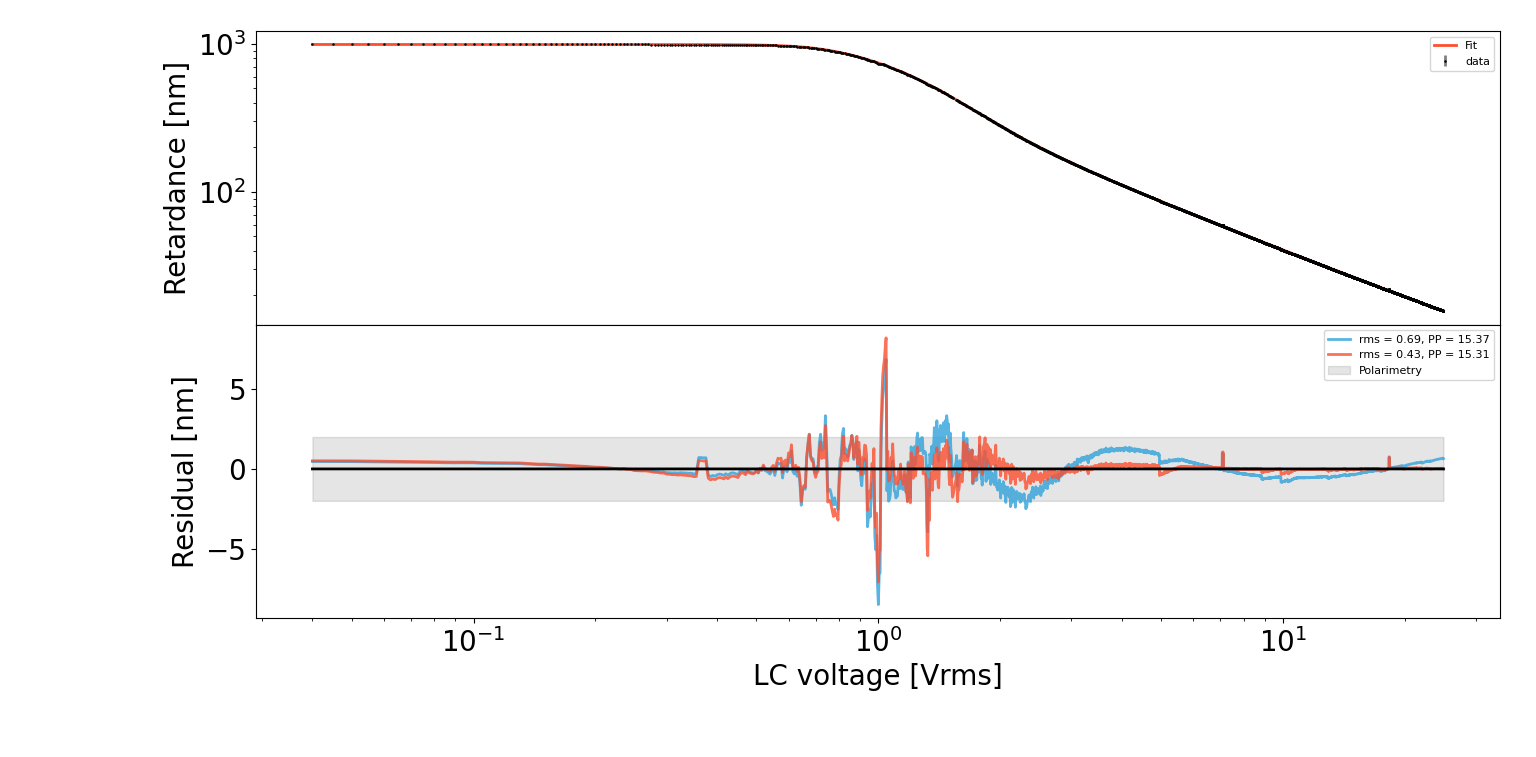
All the swept results are reported in fig5. It can be seen that we get the usual retardance varying from 17nm to 989 nm as a function of applied voltage for every rotation angle except when the LC fast axis is close to the input polarization direction. In that case the maximum retardance is only ~650 nm while smallest one is increased to ~ 60 nm.
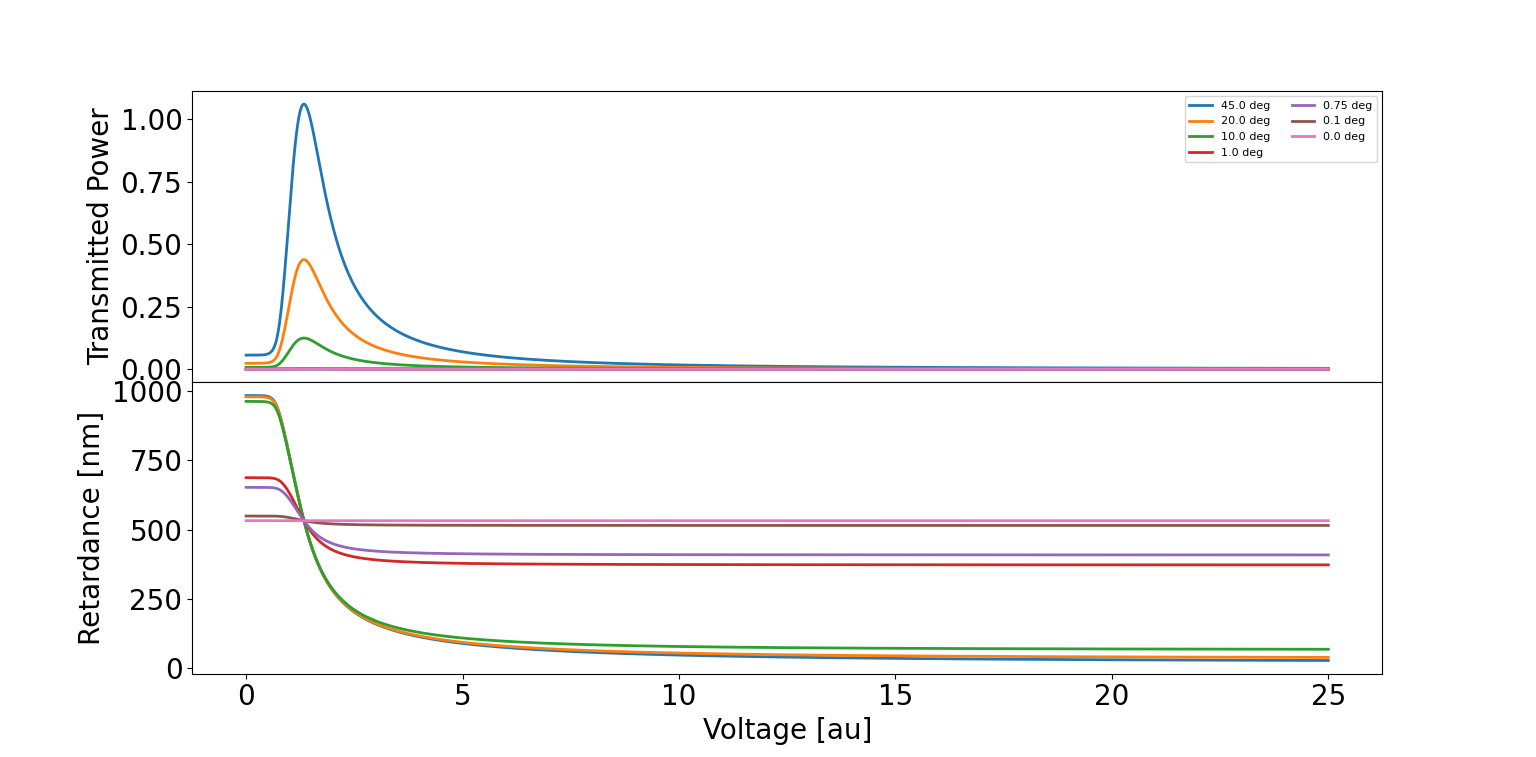
We simulated a rotating LC inside cross polarizers. Input polarization and polarizers are assumed perfect but we added by hand a backgroud power of 22.12 nW as measured in cross polarizers without LC. The LC voltage response is coming from the fit of the value at 45deg rotation wrt input polarization direction and takes into account measured extinction ratio. Results are reported in fig6 and agree really well with our measurement (especially at low voltage). An offset of 0.75 deg creates a maximum retardance of 657nm!
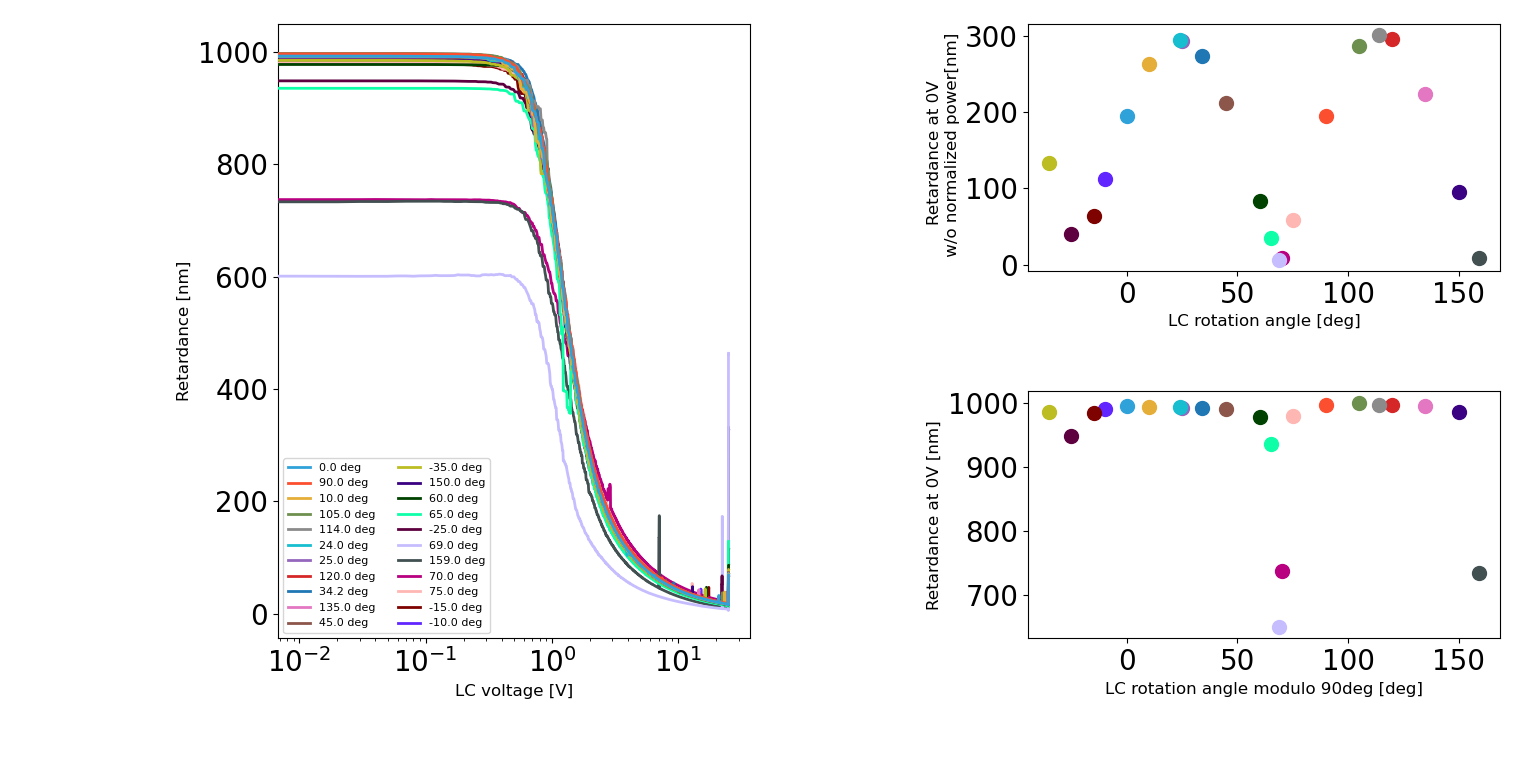
For LC1, we repeated the same measurement and measured fast axis direction of 145.05 deg.
- Temperature effect
All these measurements are performed at 30 degC nominal value and we typically see variation of less than 0.1 degC.
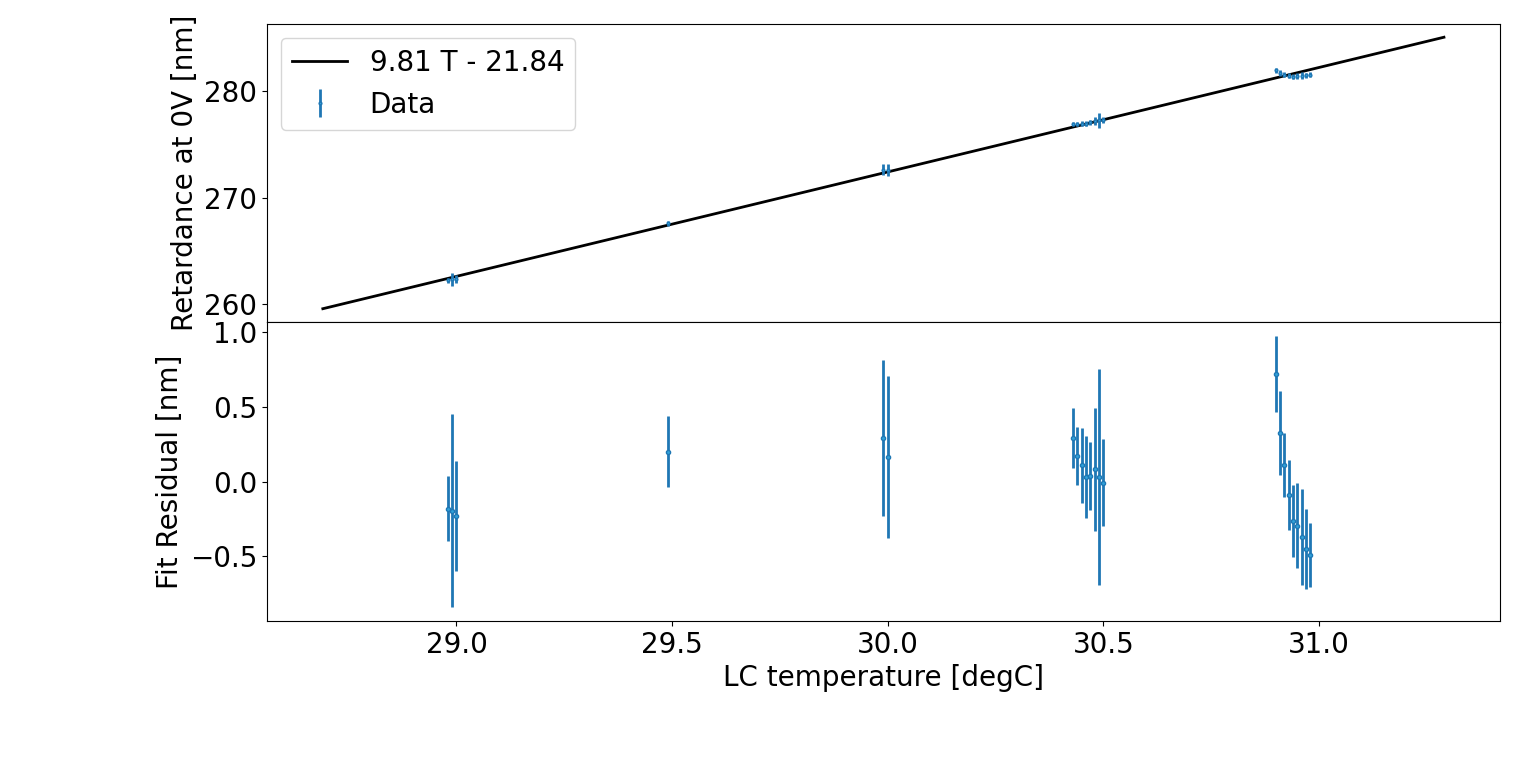
We measured the retardance at 0V while changing the LC temperature and results are attached in fig 7.
For LC2 we measured a change of 9.81 nm / degC while for LC1 7.84 nm/degC.
I looked at the CC PLL again. It still seems to be quite unstable. There was one occasion where I could get it to lock for more than 10 minutes. During phase noise measurement I saw that the noise was glitch type rather than stationary, where the noise floor could be at the level of previous measurements but quickly gets pushed up by an impulse excitation.
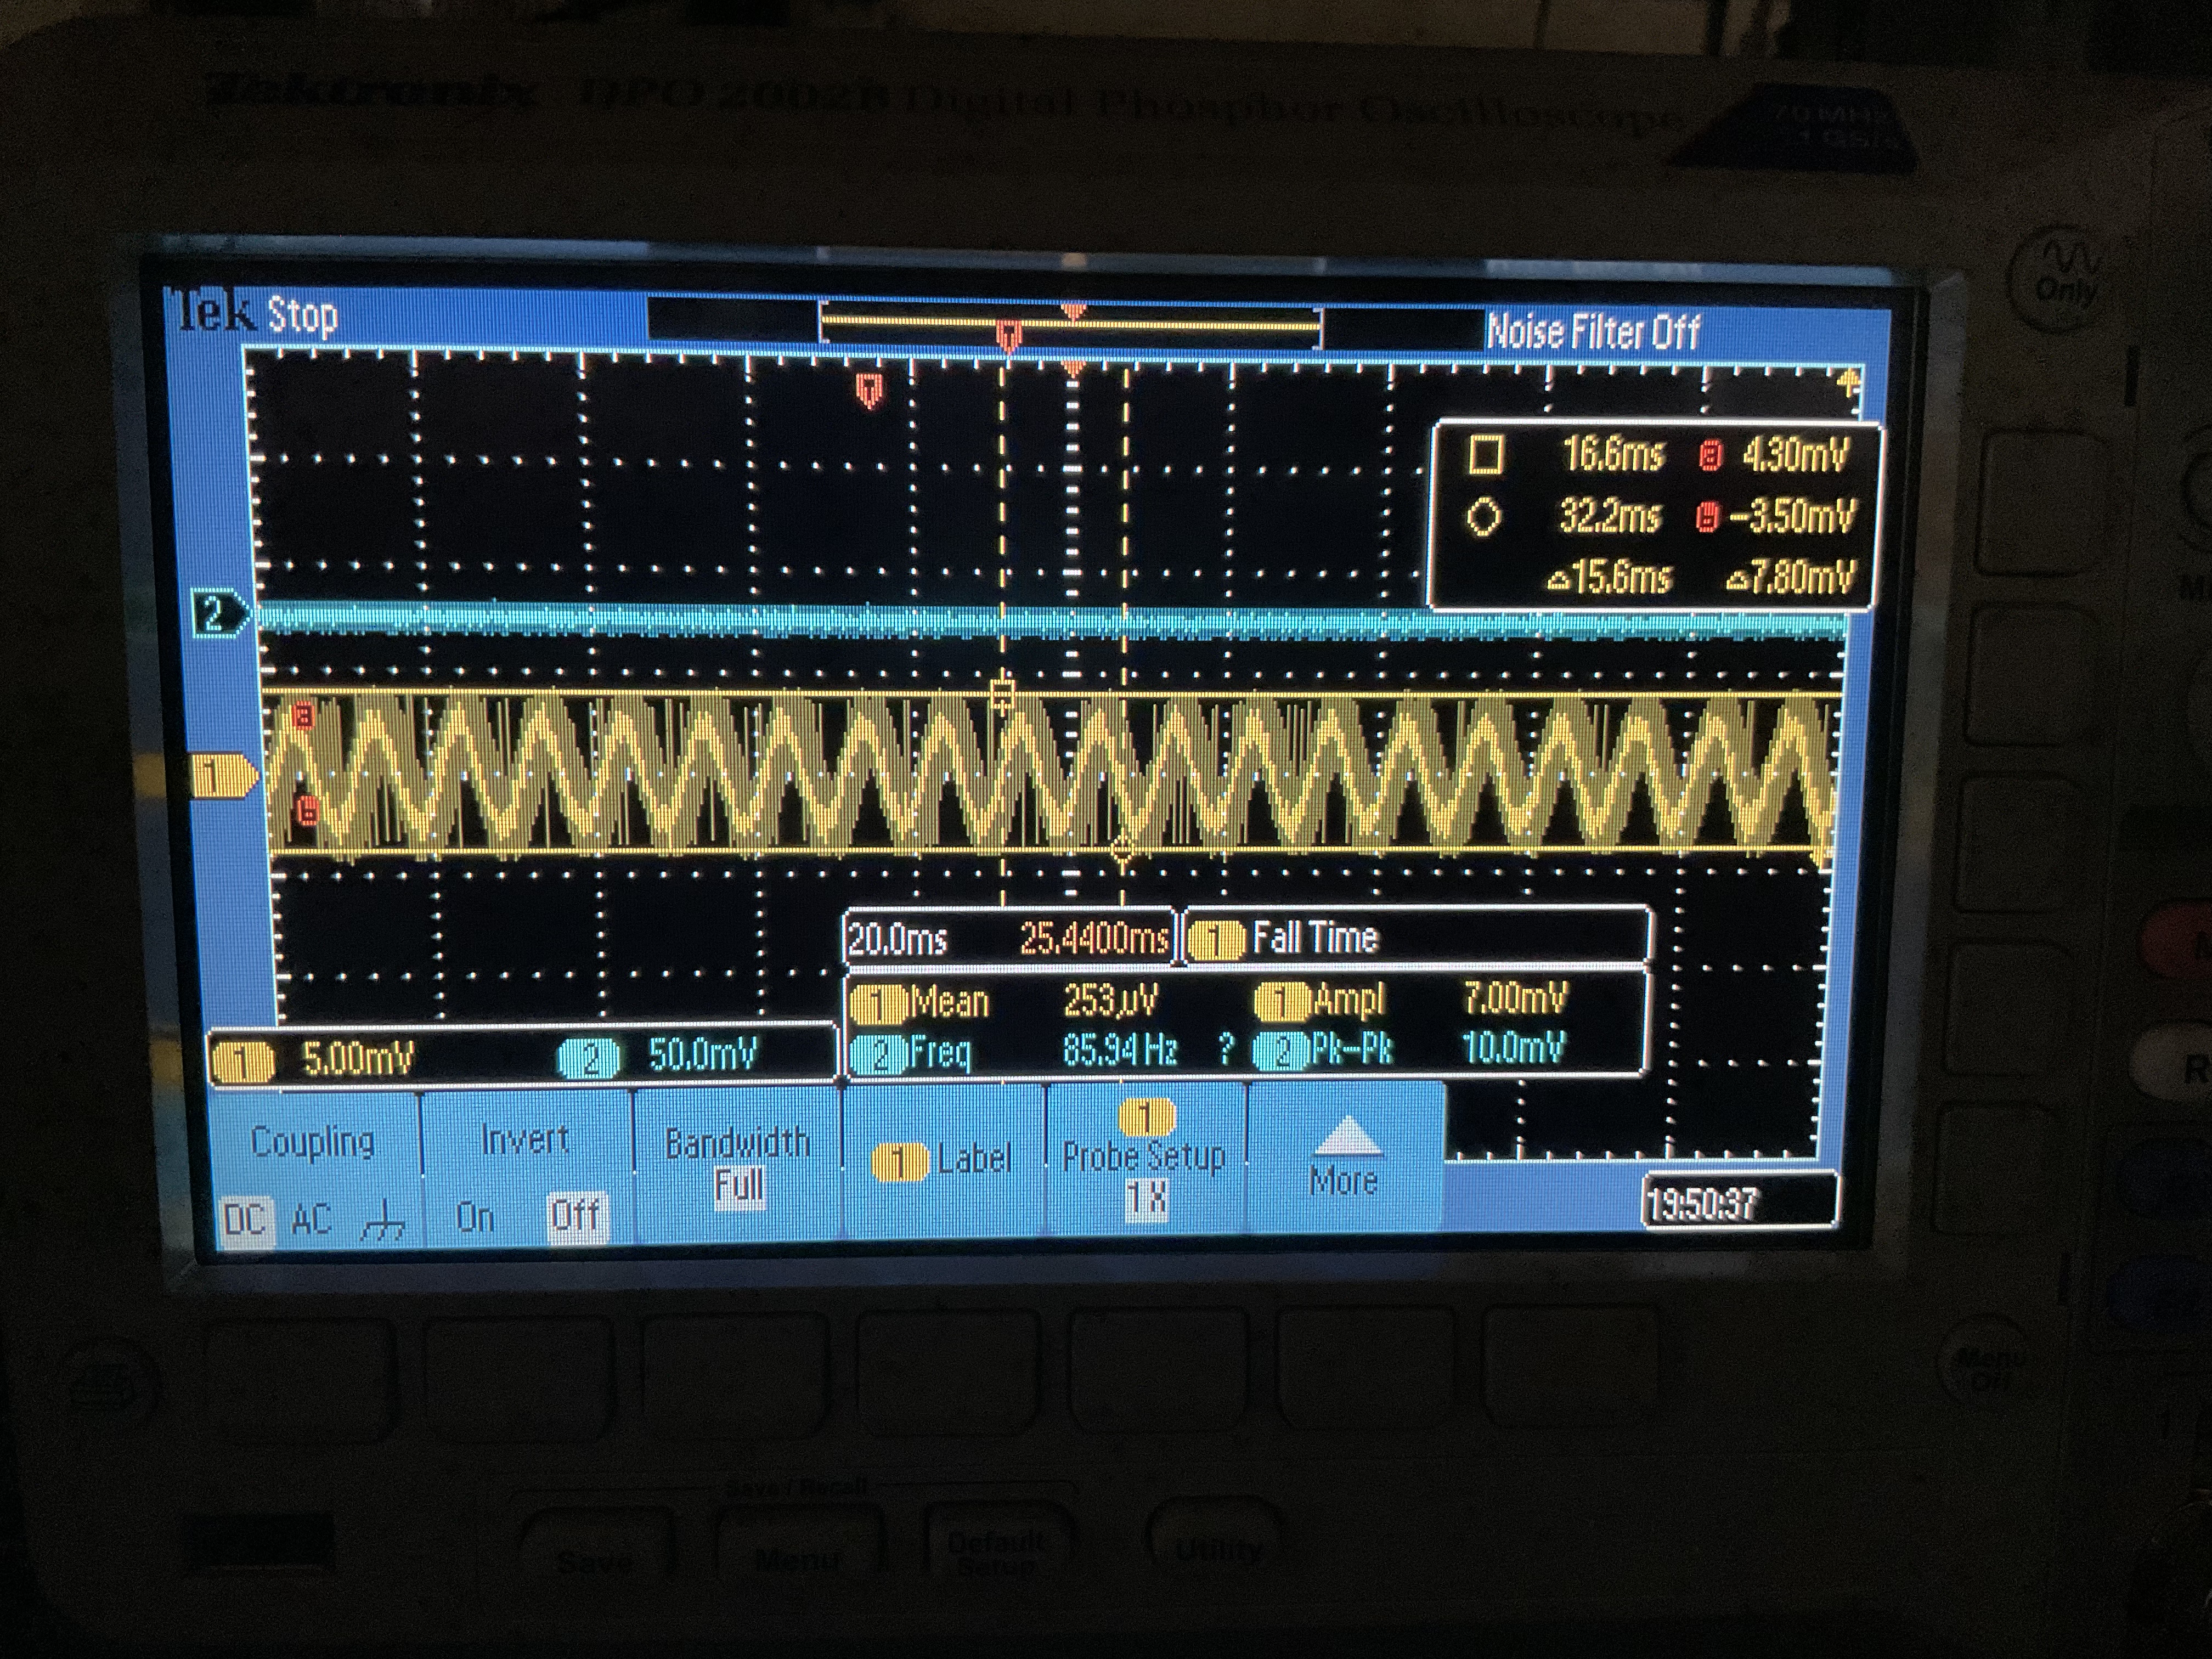
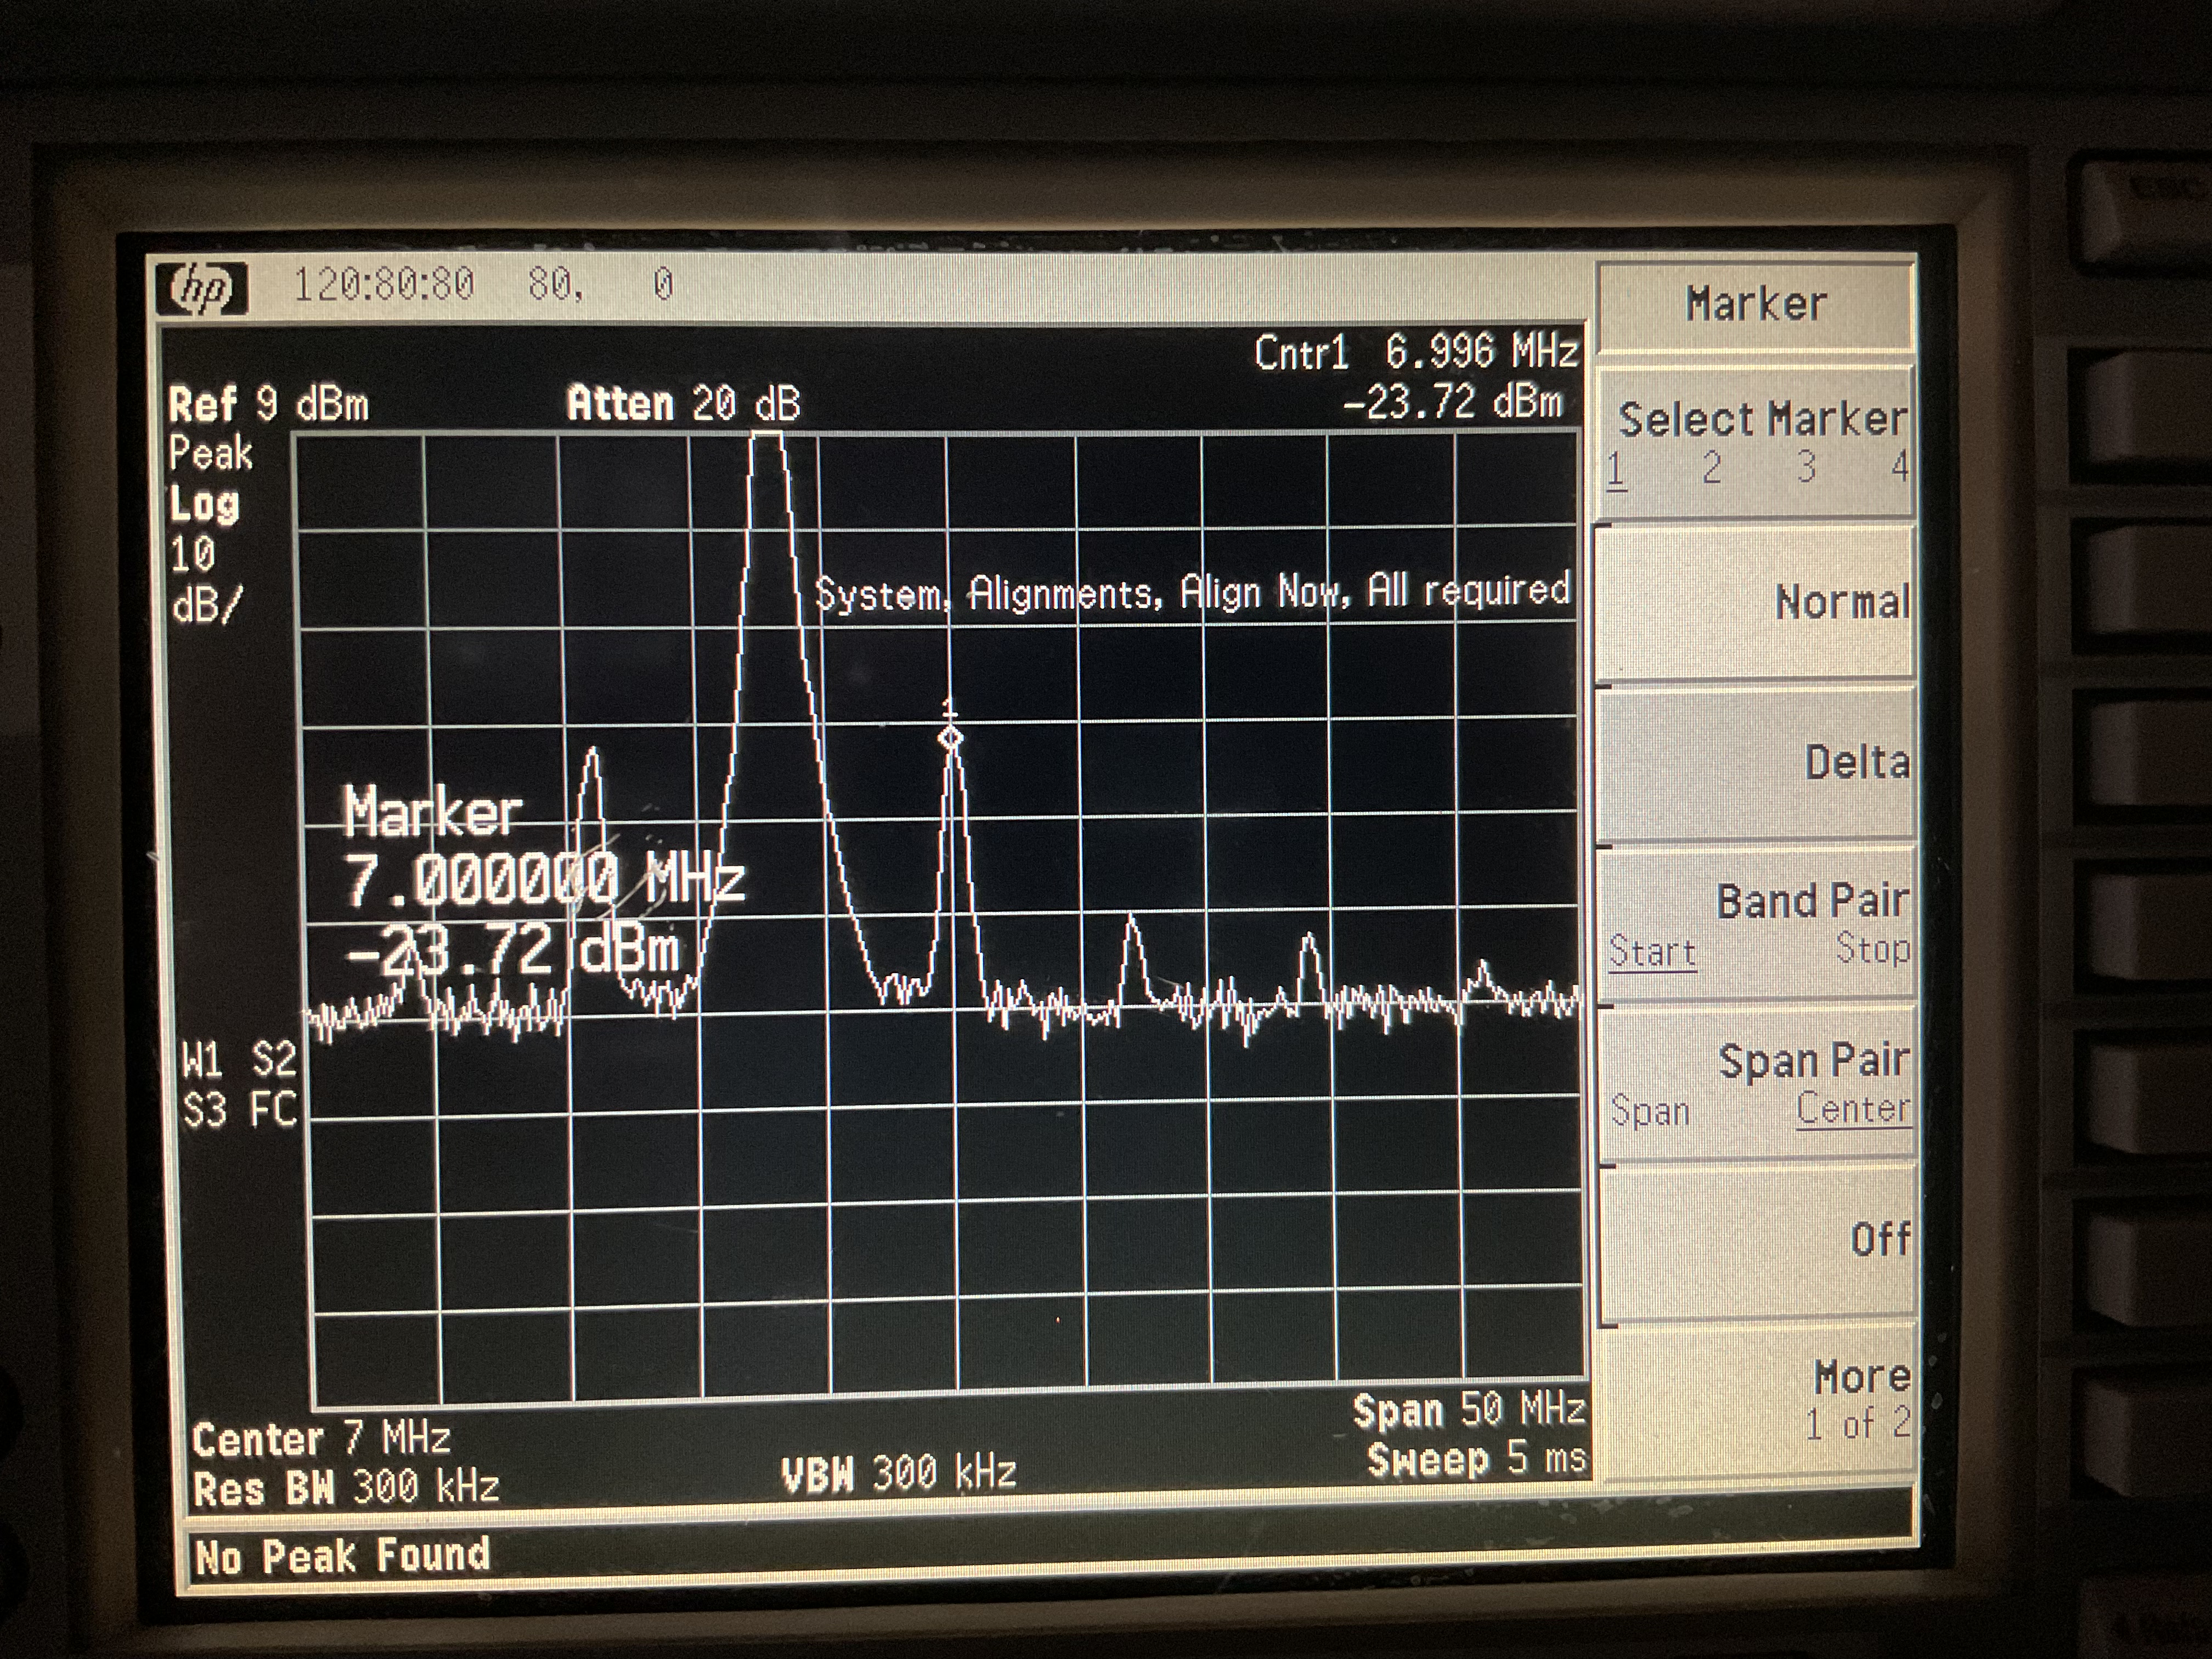
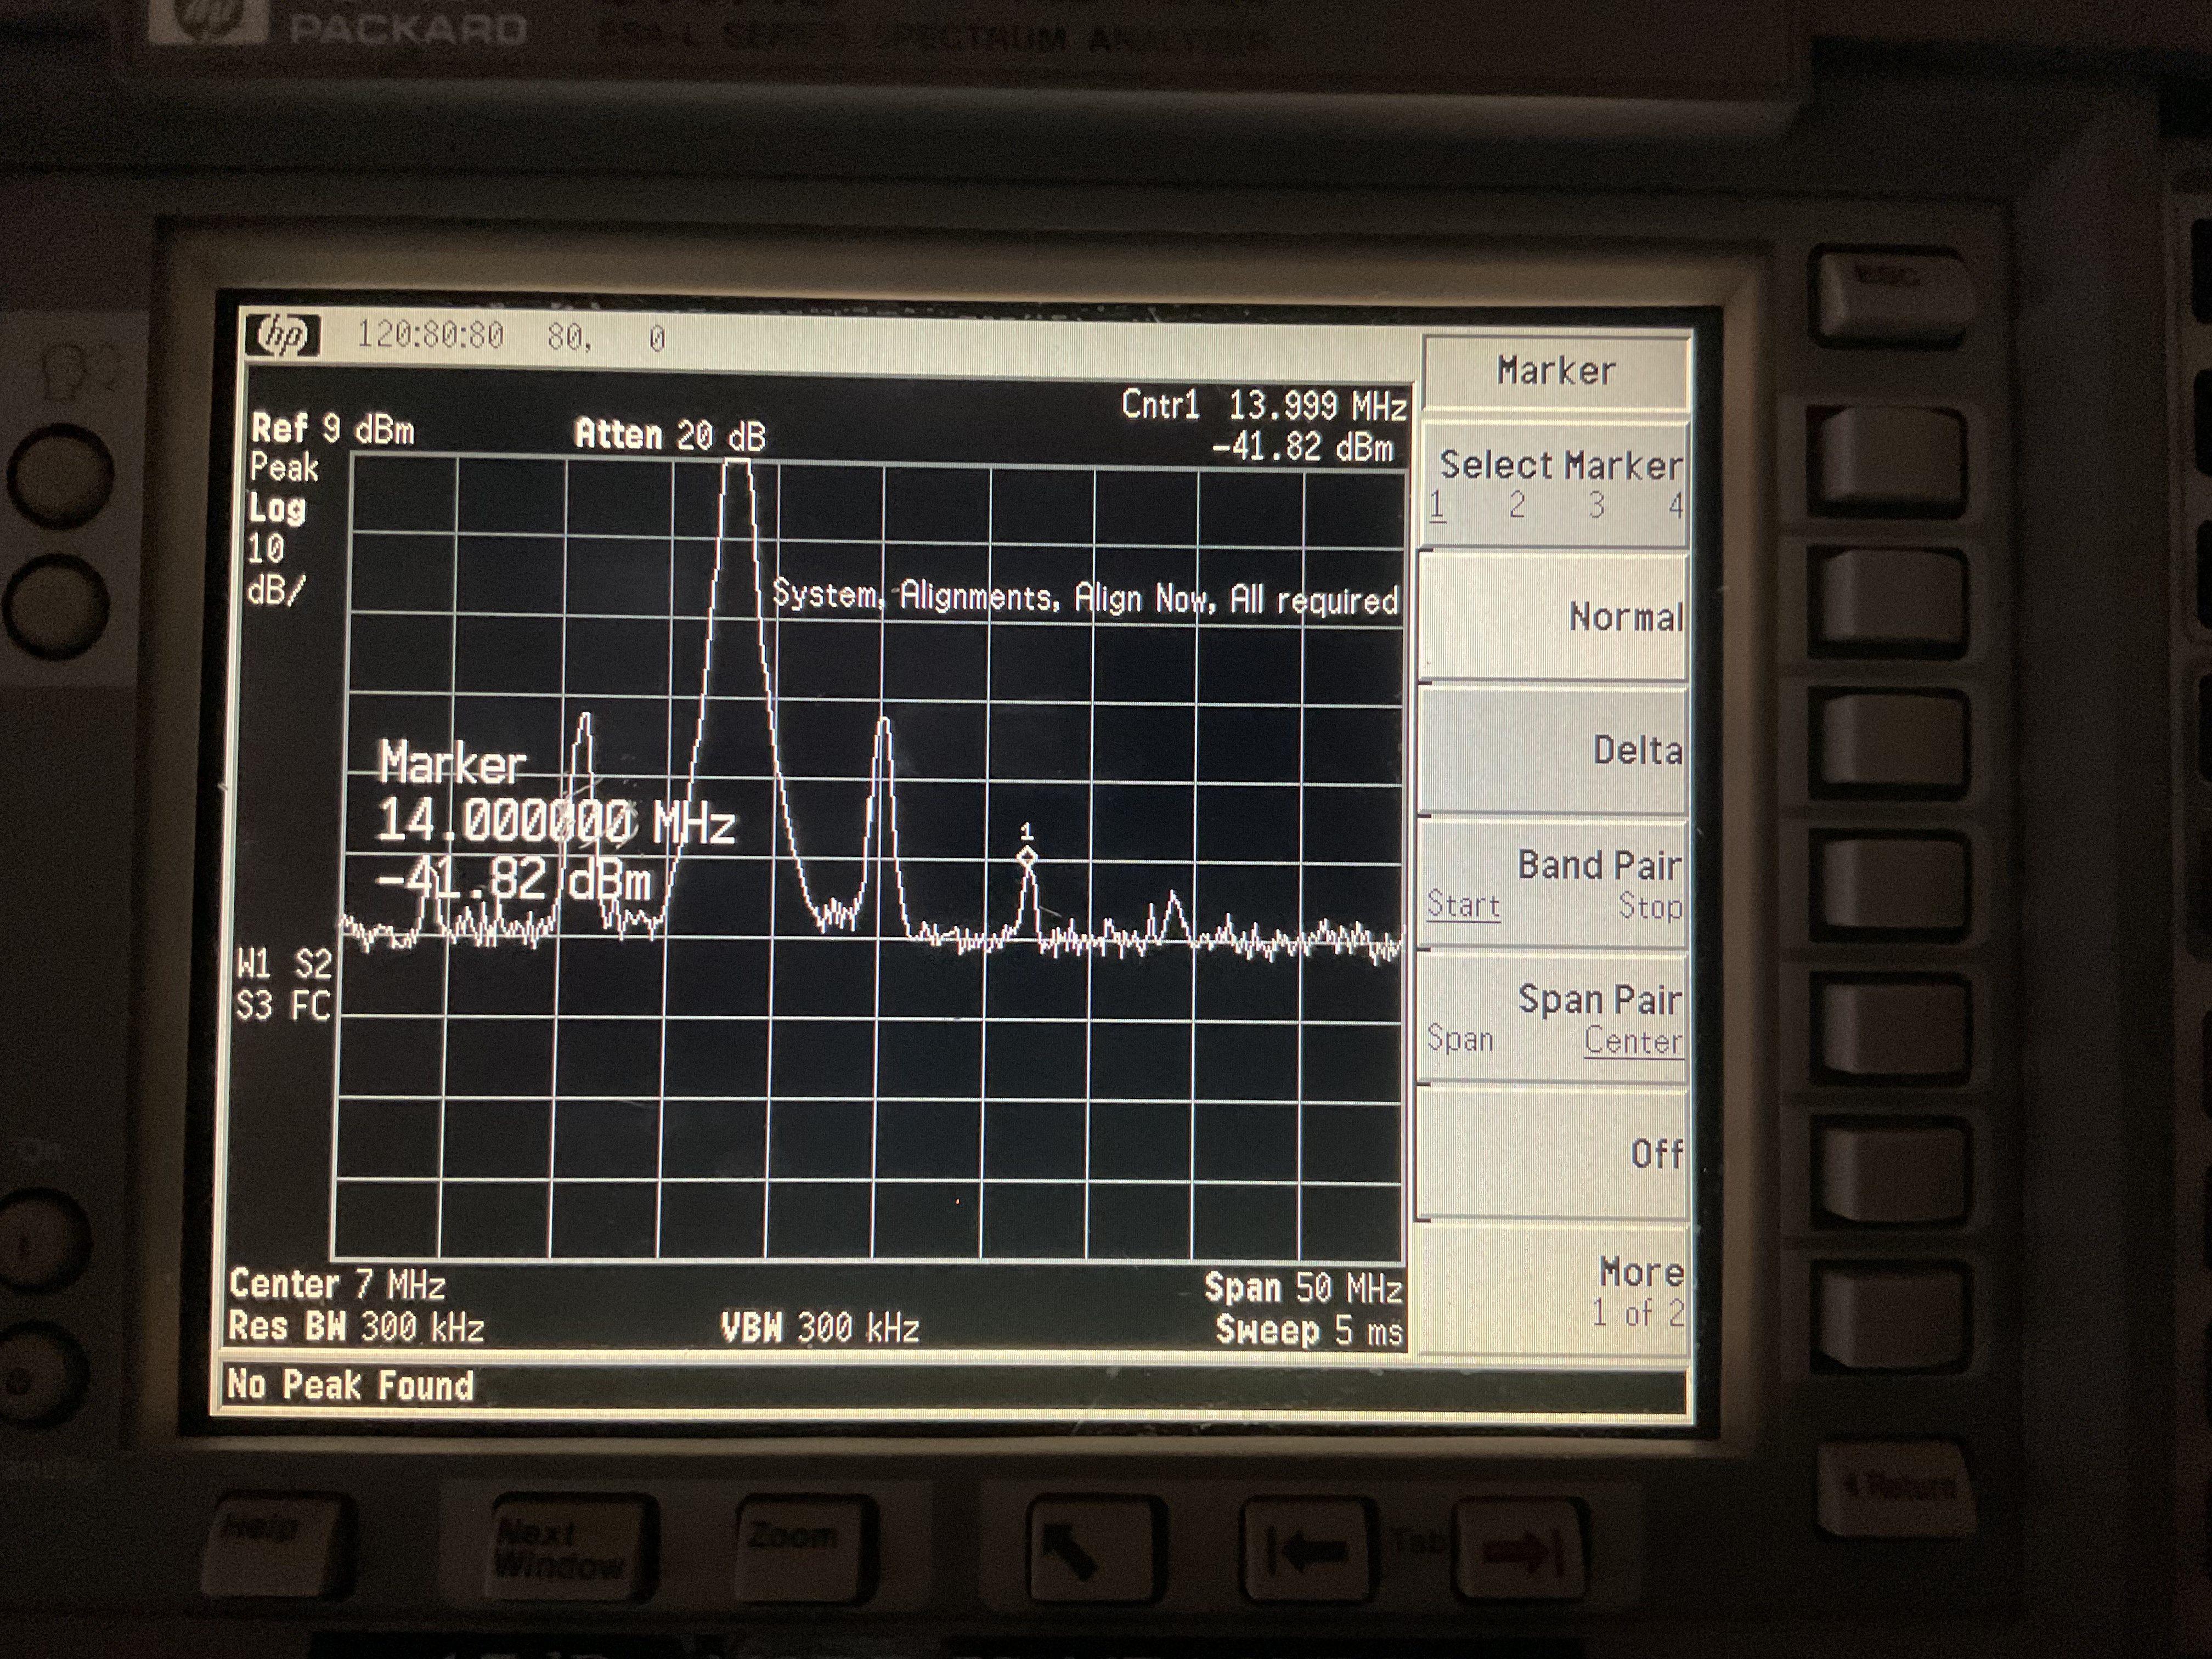
This time I measured the phase noise by providing 7 MHz as the local oscillator from DDS3 DAC0 (PPol LO @ 9 dBm), which corresponds to the usual operation frequency of the CC PLL beat note (7MHz at "-23.5" dBm on the "17dB more is measured " spectrum analyser, DDS signal to CC LO is 21 MHz). Changing the LO offset to both 6.9990 MHz and 7.0001 MHz (+/-100 Hz offset) resulted in a corresponding 100 Hz signal output from the mixer. On the oscilloscope I can still quite frequently see the signal glitches.
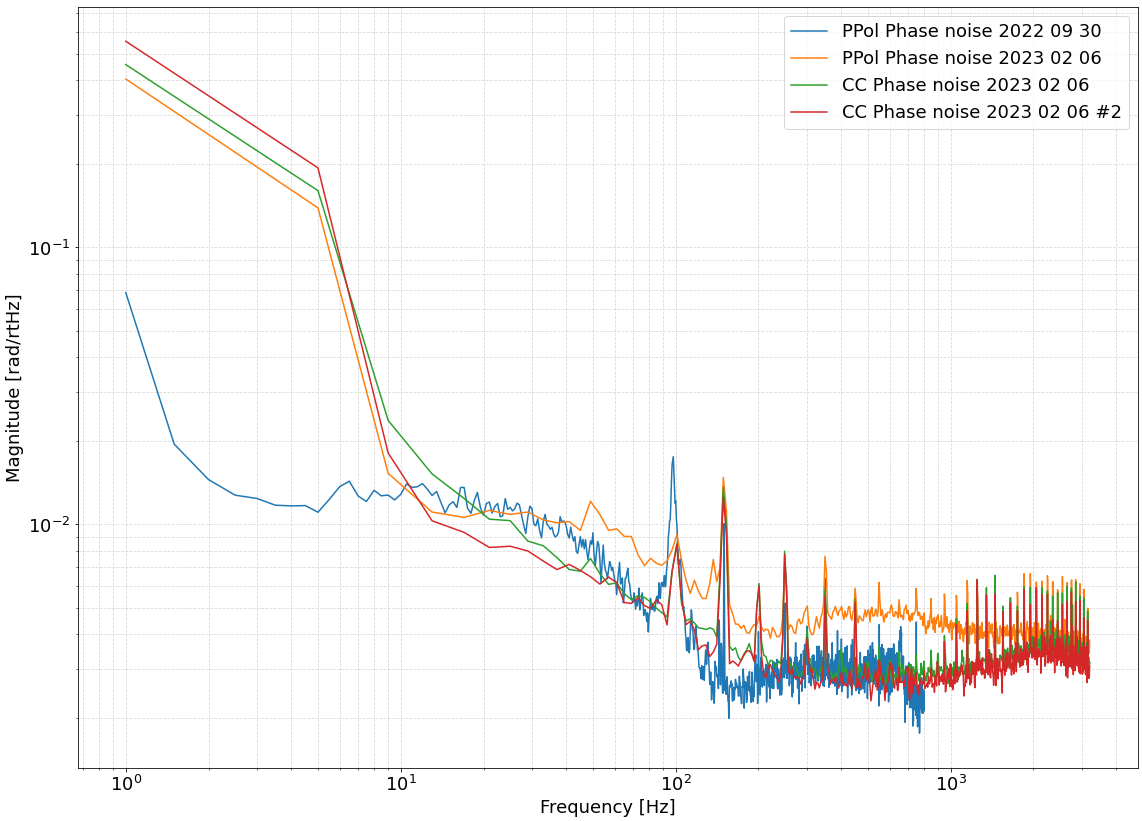
I tried twice to get the phase noise spectrum but it seems the signal is not cooperating. The noise floor gets raised quite high by random noise impulses (figure 1). Qualitatively, the noise floor should be about at the level of the other measurements.
Figure 2 shows the Apk calibration to go from Vrms to rad/rtHz. Last time it was 0.0086 mV, now it is 0.0078.
Figure 3 and 4 show some feedback on the CC spectrum analyser at 14 and 28 MHz. The CC PLL is going to a T attached on the spectrum analyser. The other exit of the T then goes to the RF port of a mixer. When disconnect the mixer the 14/28... peaks go away.
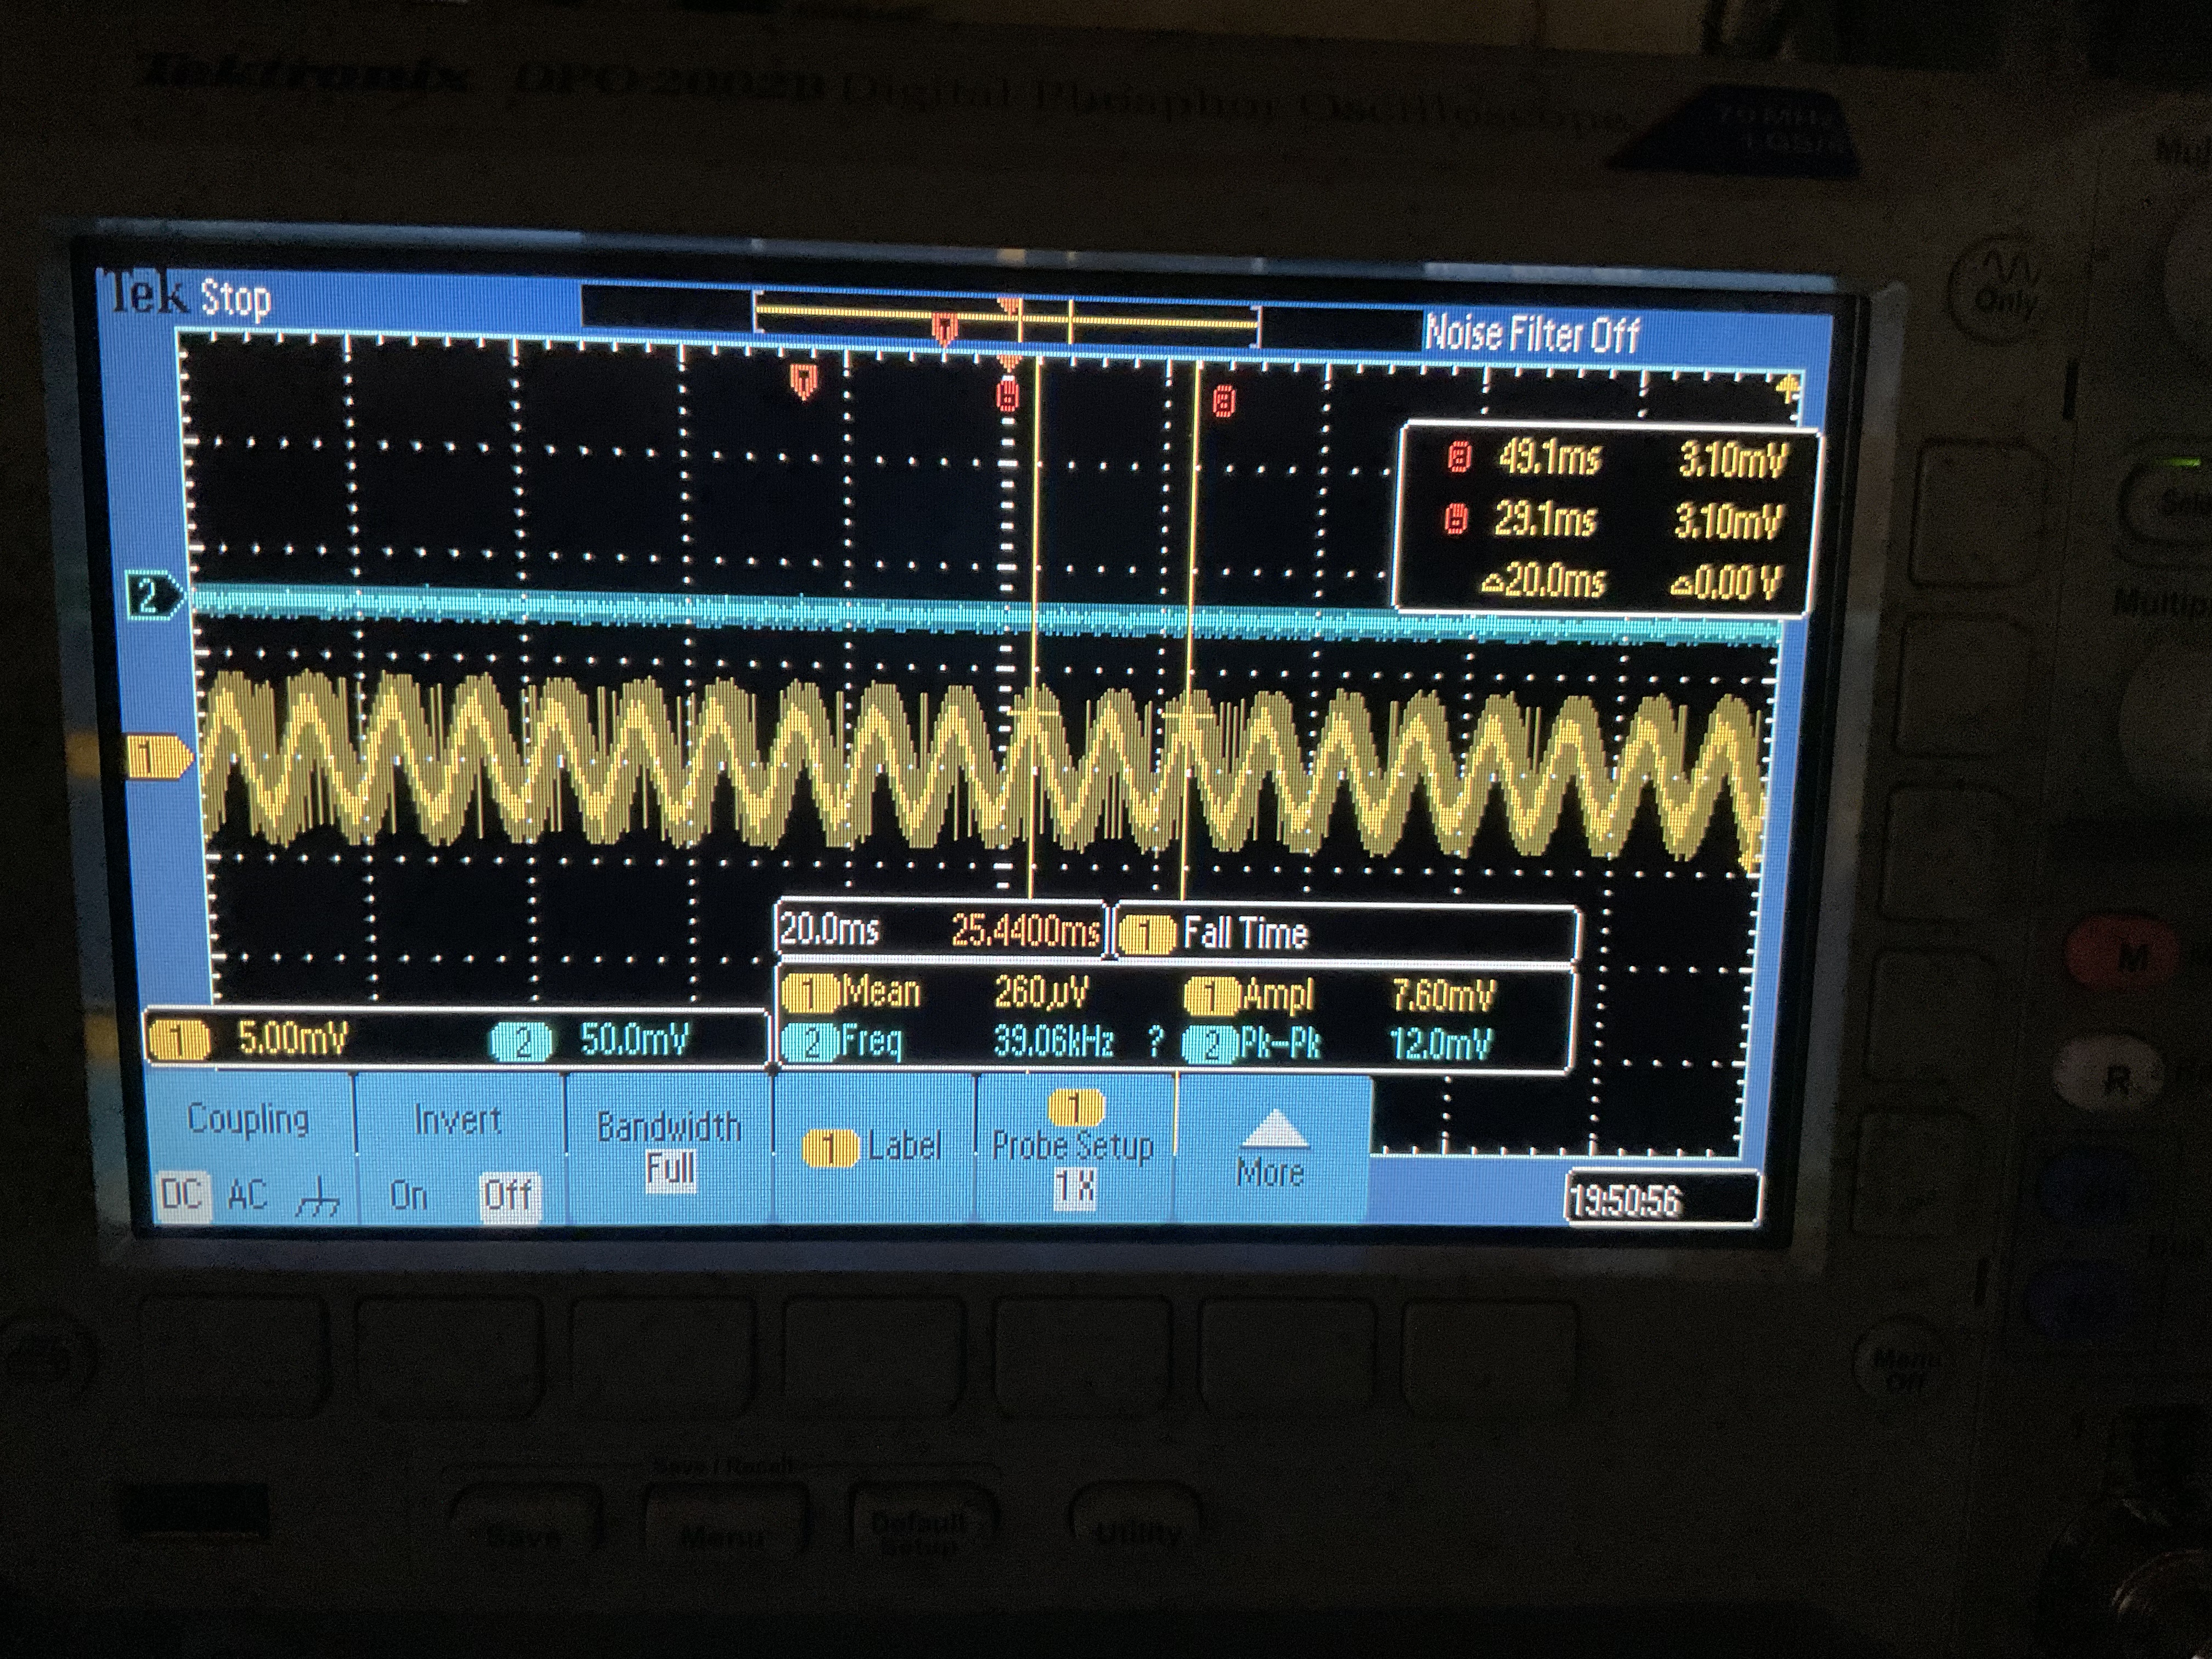
Figure 5 shows the period of 2 wavelengths when the local oscillator frequency is offset to 7.000 100 MHz in DDS3 DAC3. So a 100 Hz difference between DDS and beatnote produces the 100 Hz signal as expected.
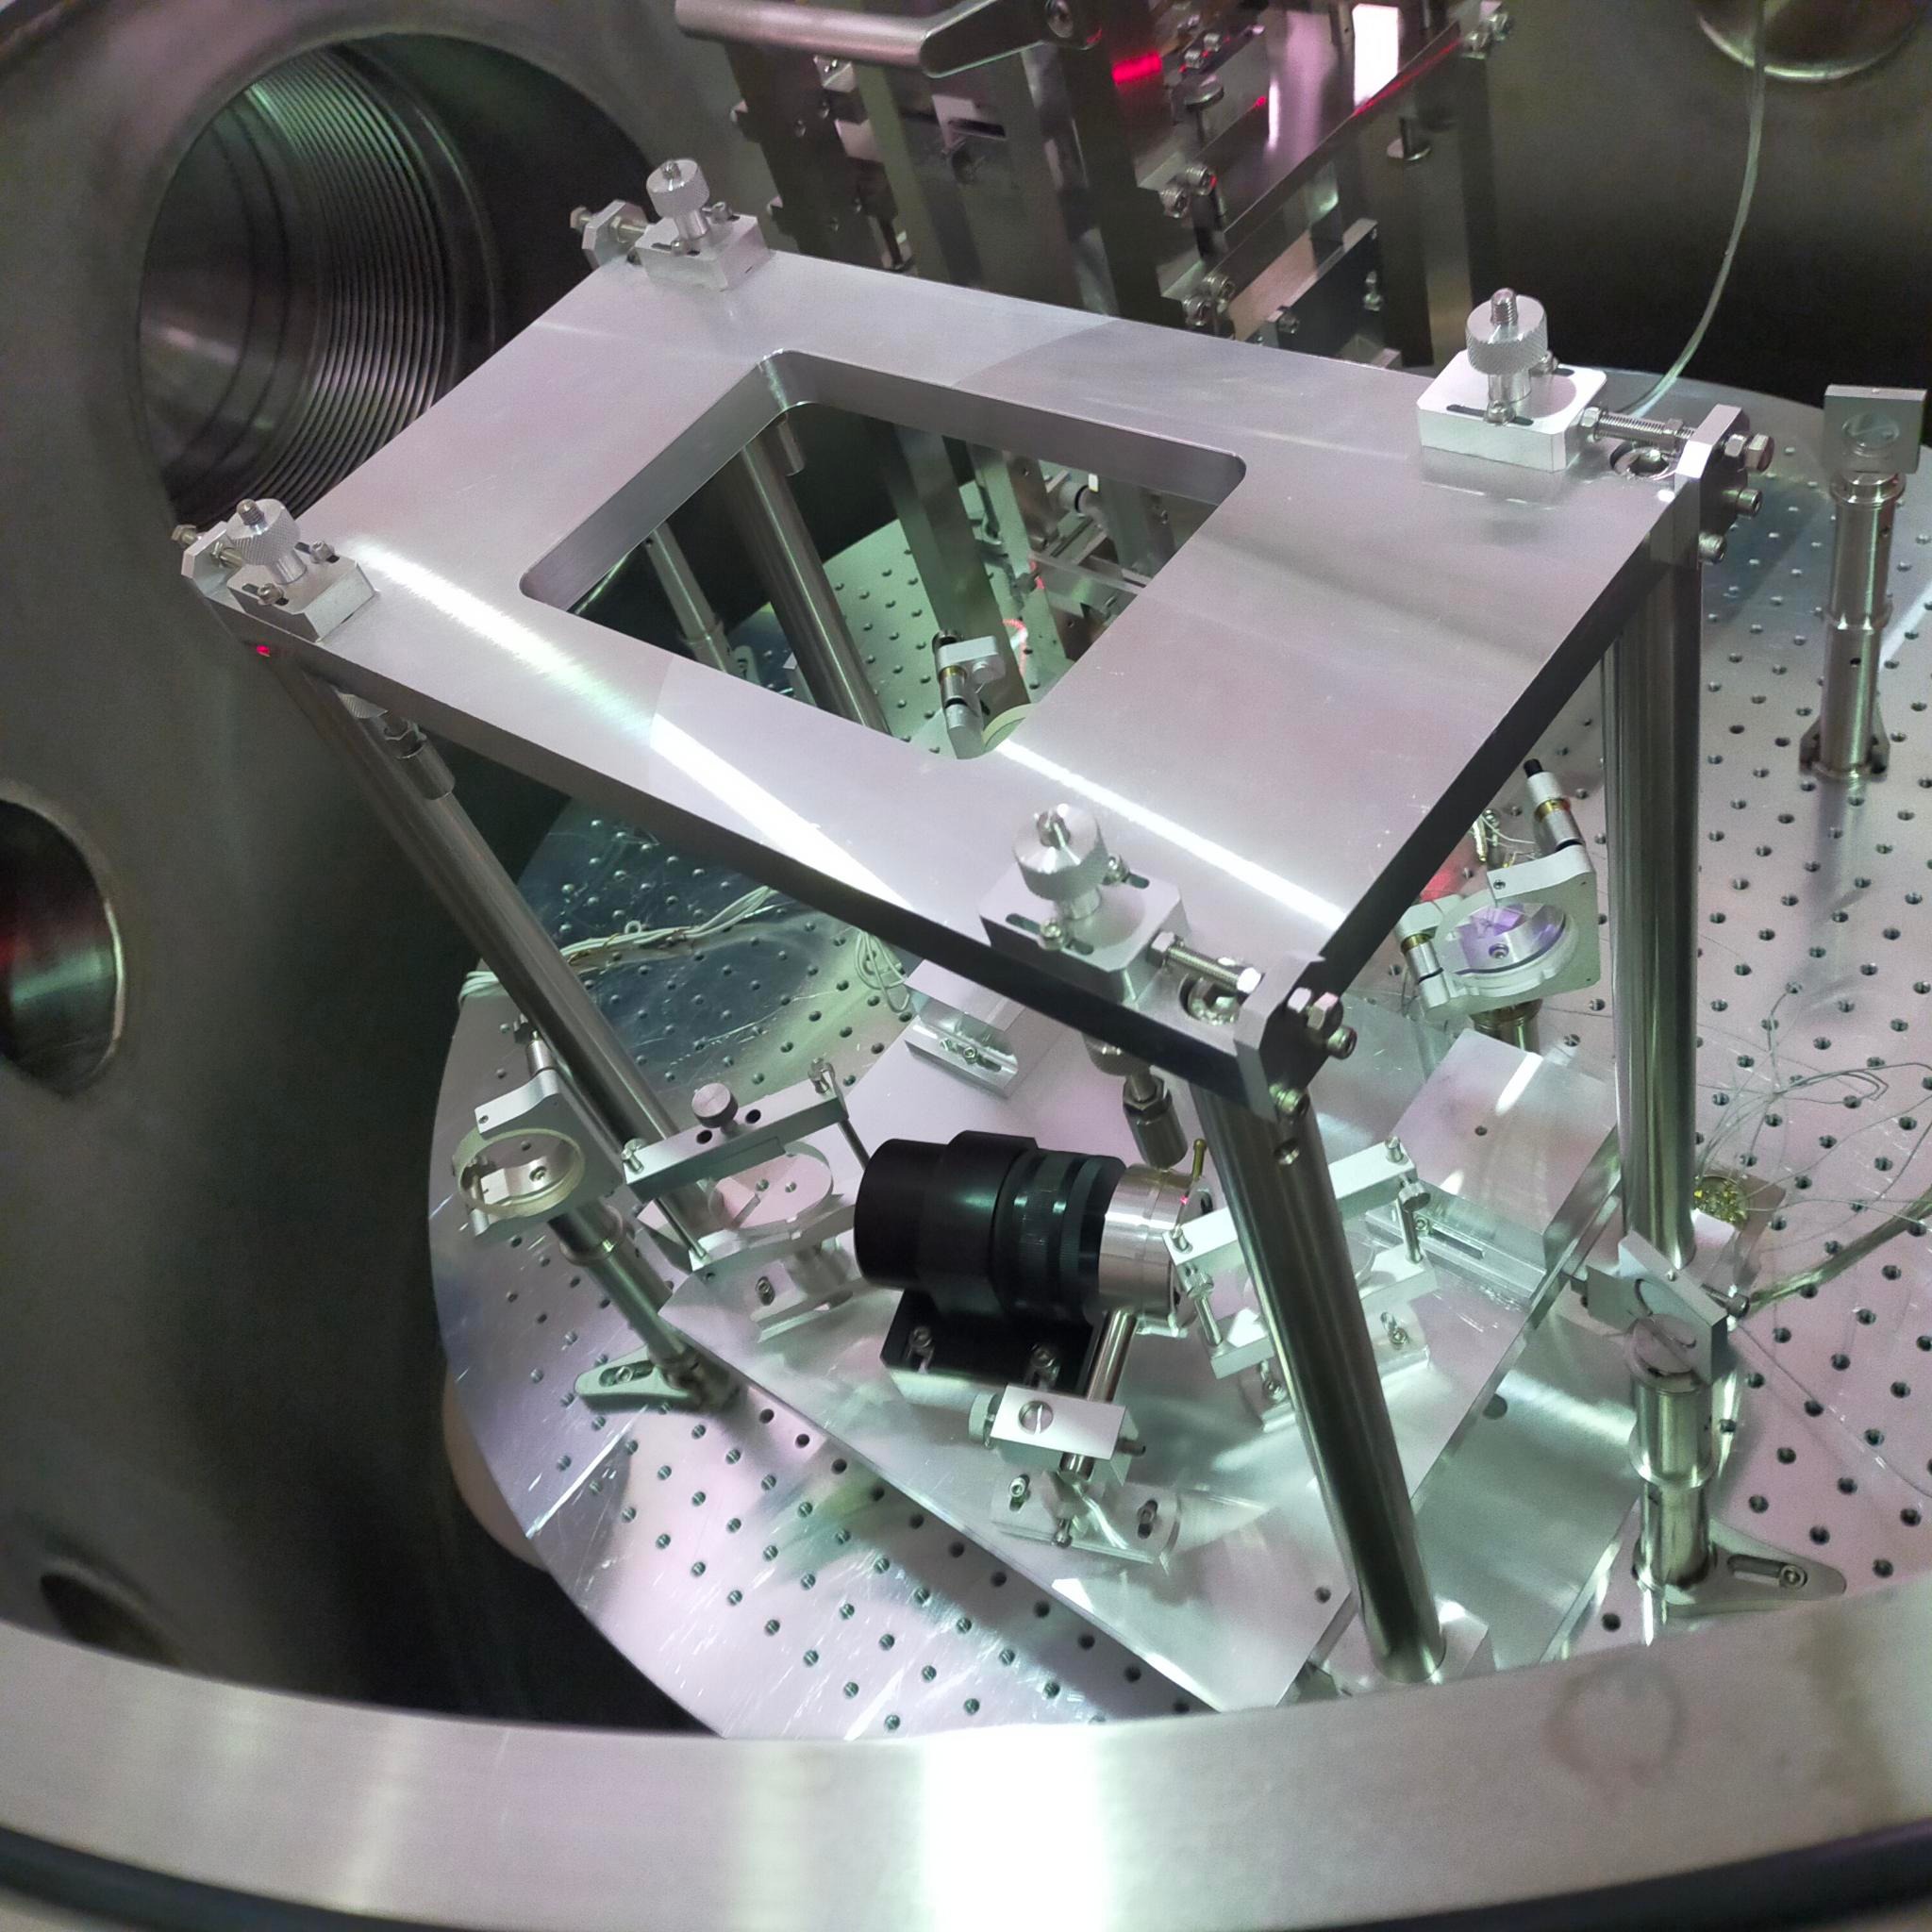
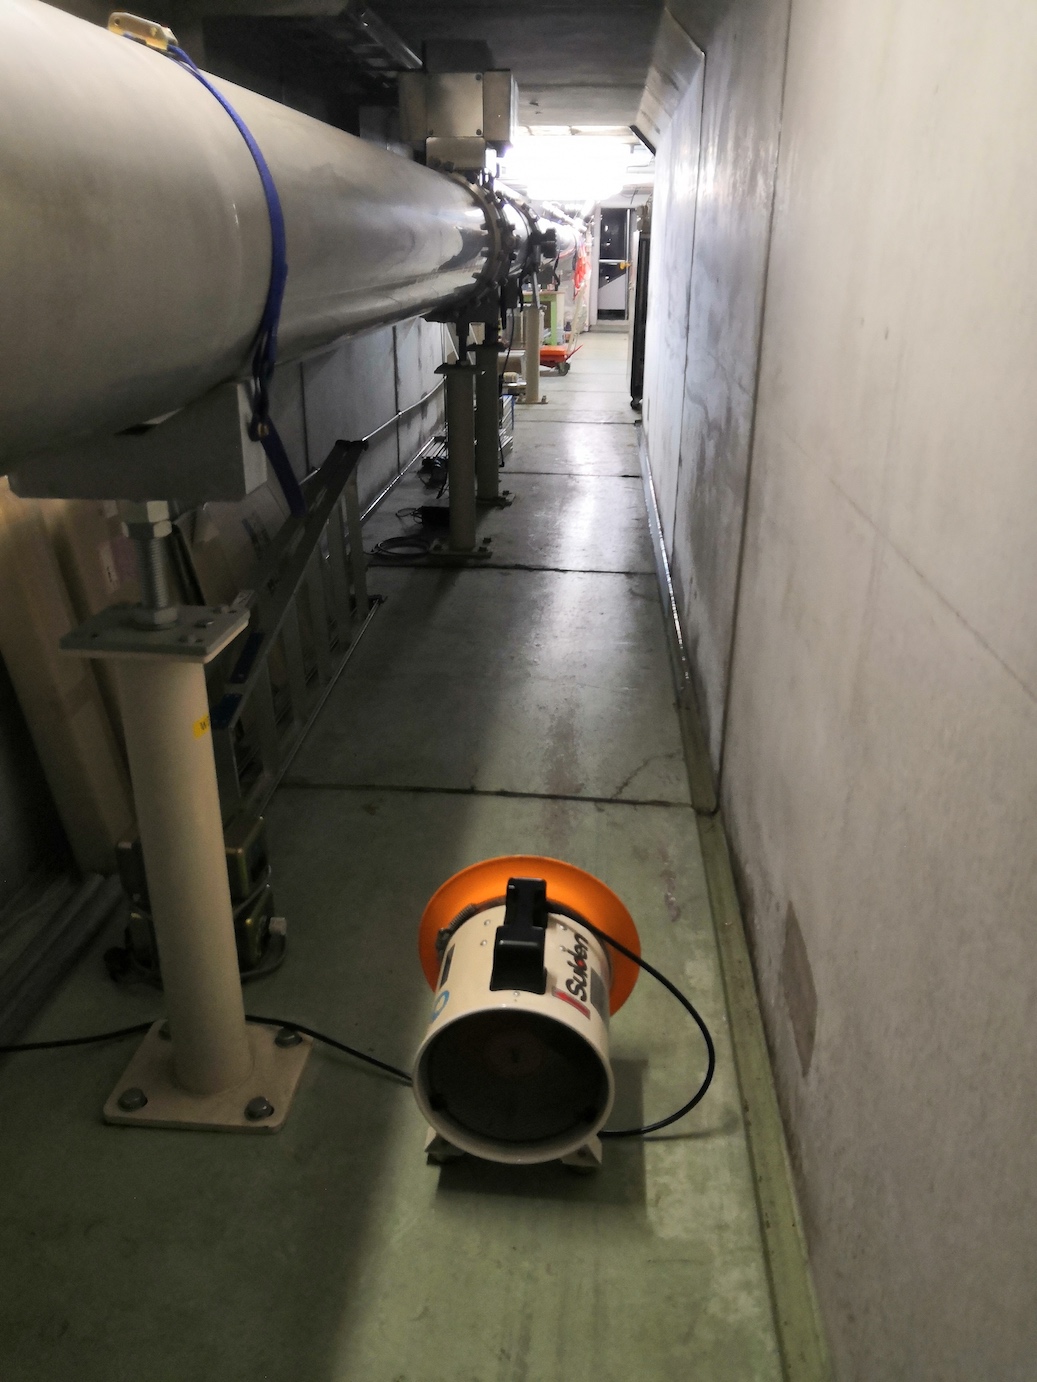
The humidity in the west side of the tunnel is increasing (85%). I set the fan in the tunnel (photo). It is working during this rain season.
A parameter for a phase shifted voltage waveform between the two LCs has also been added.
The VI is completely ready for use. The speed of VI (with all data saving) is 40Hz.
The retardance of the second LC (oriented along its fast axis) was observed
We were able to align LC perfectly to its axis.
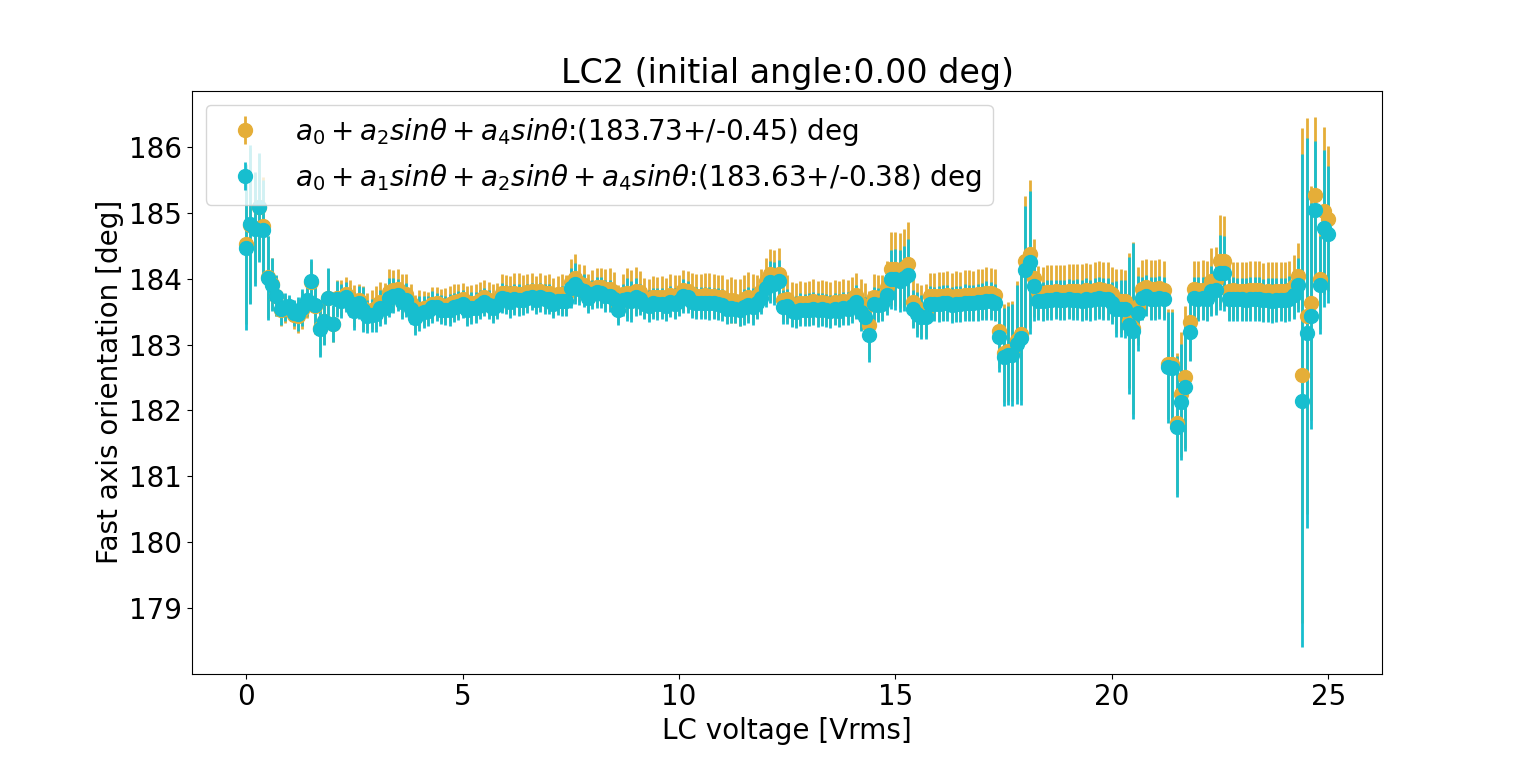
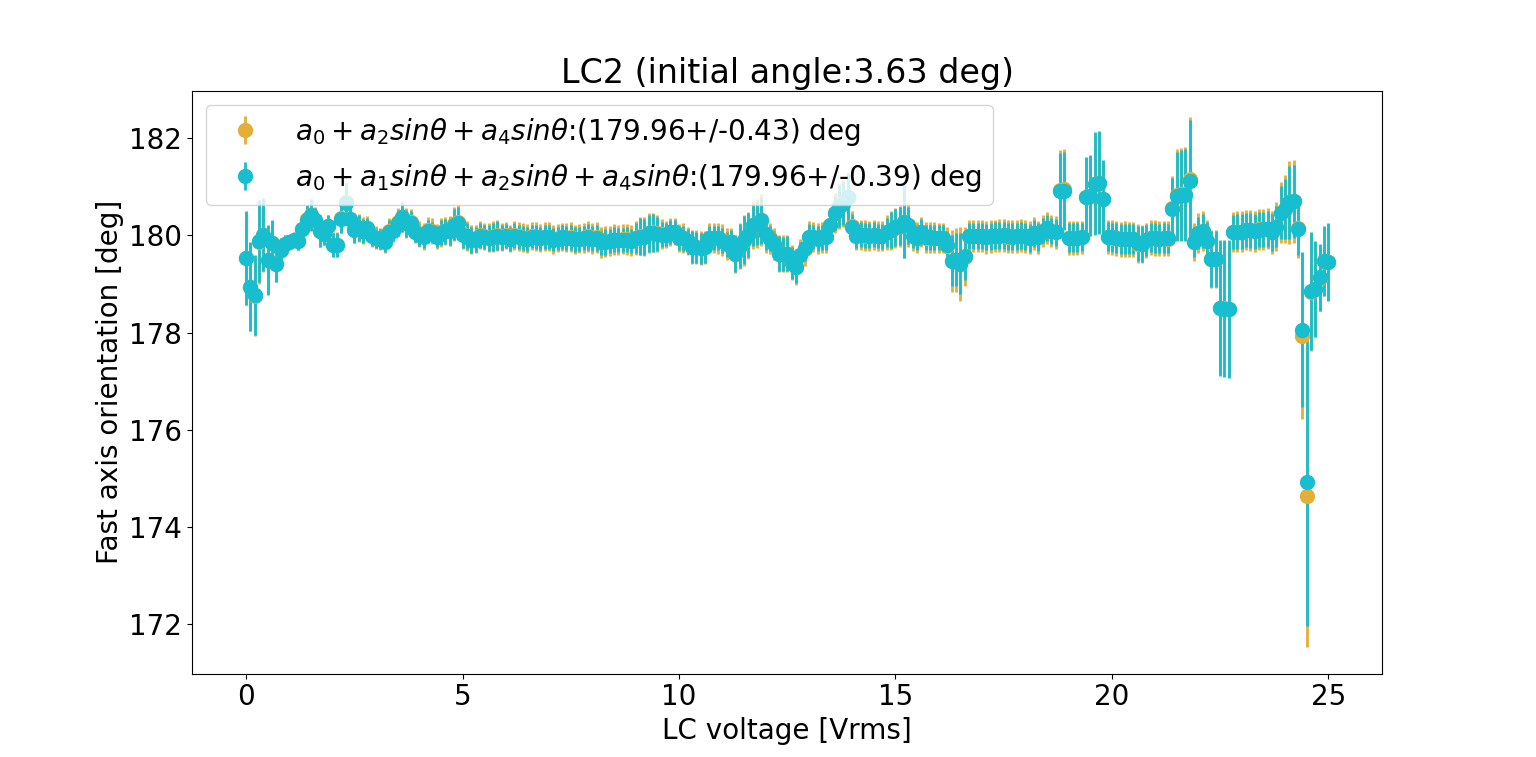
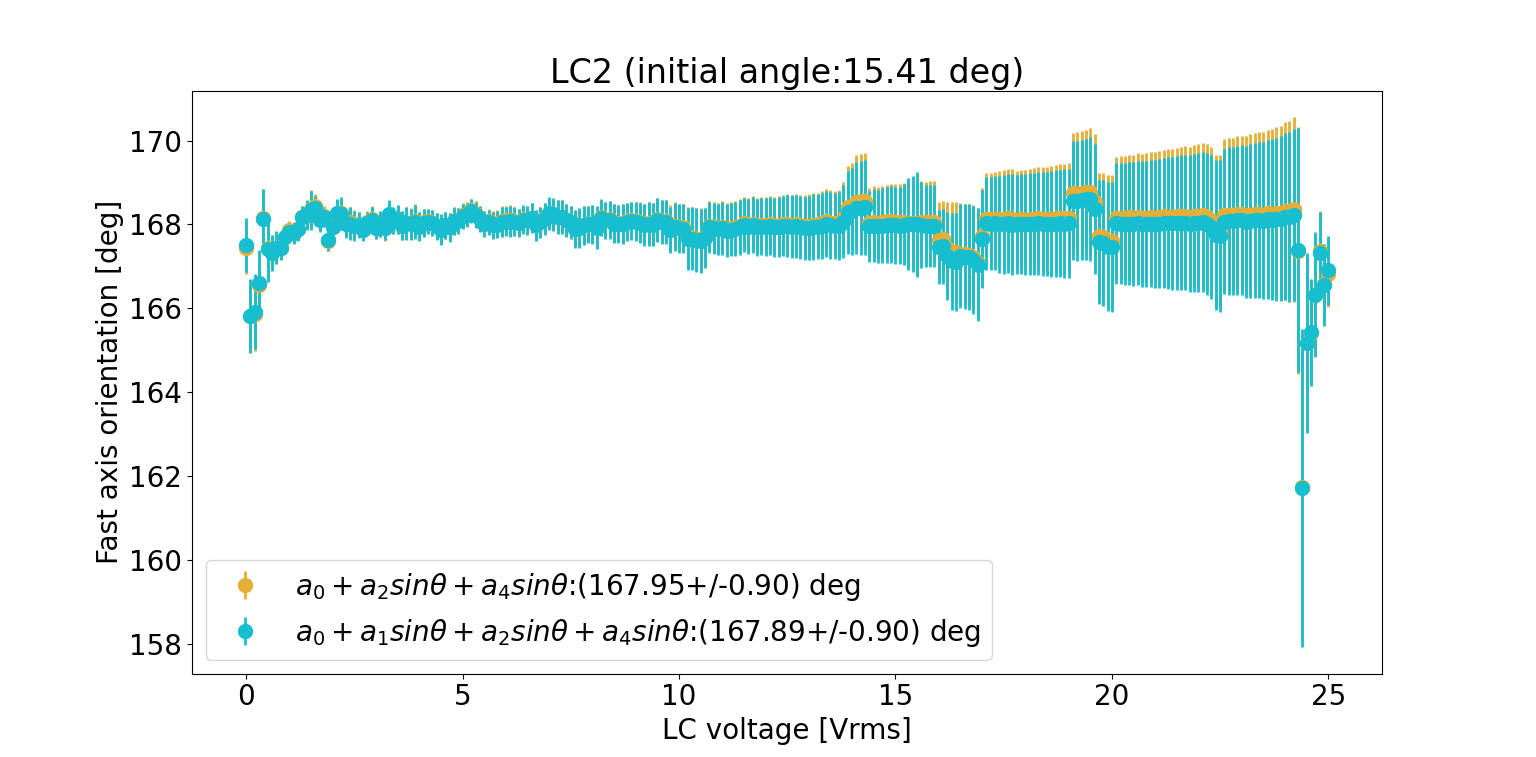
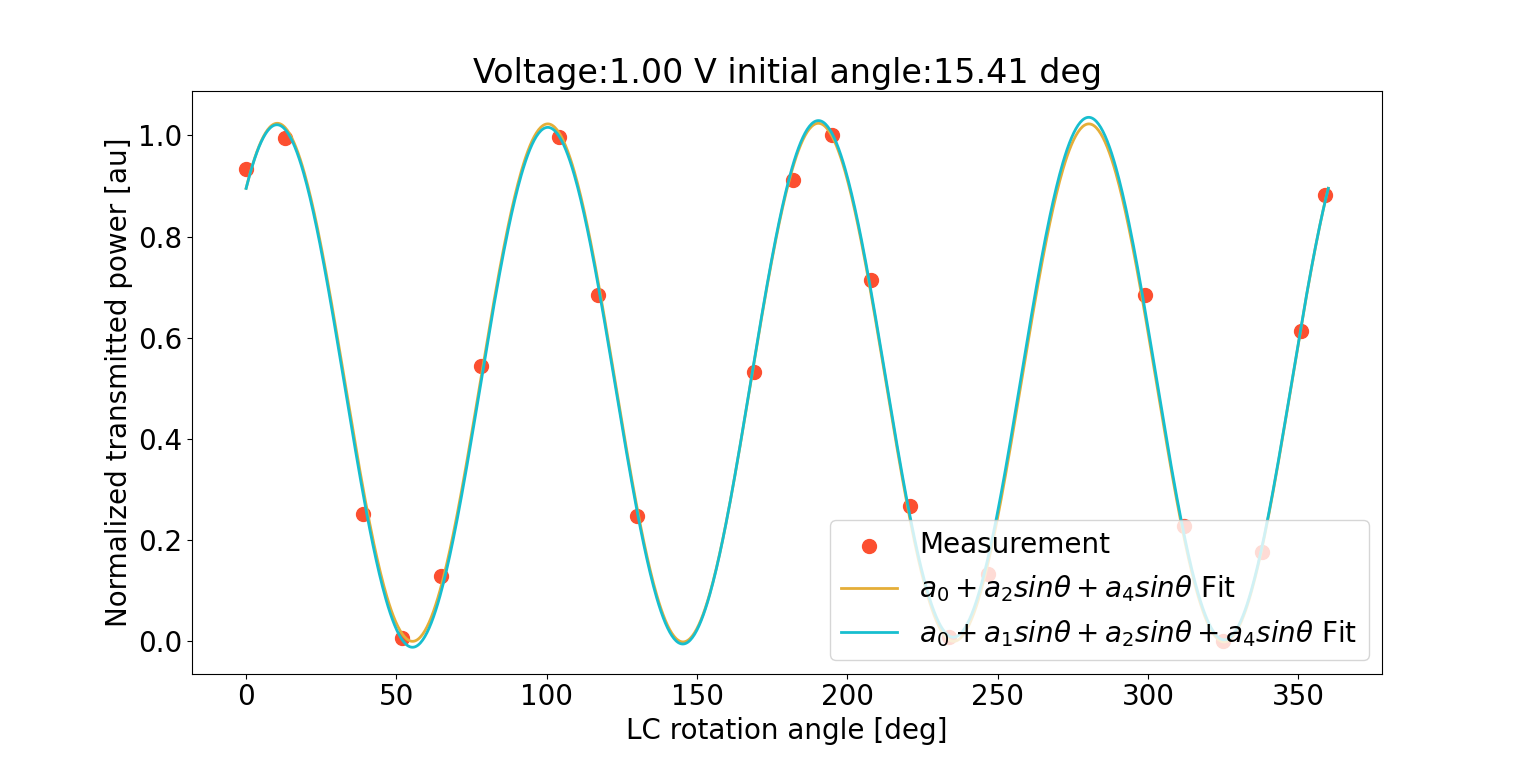
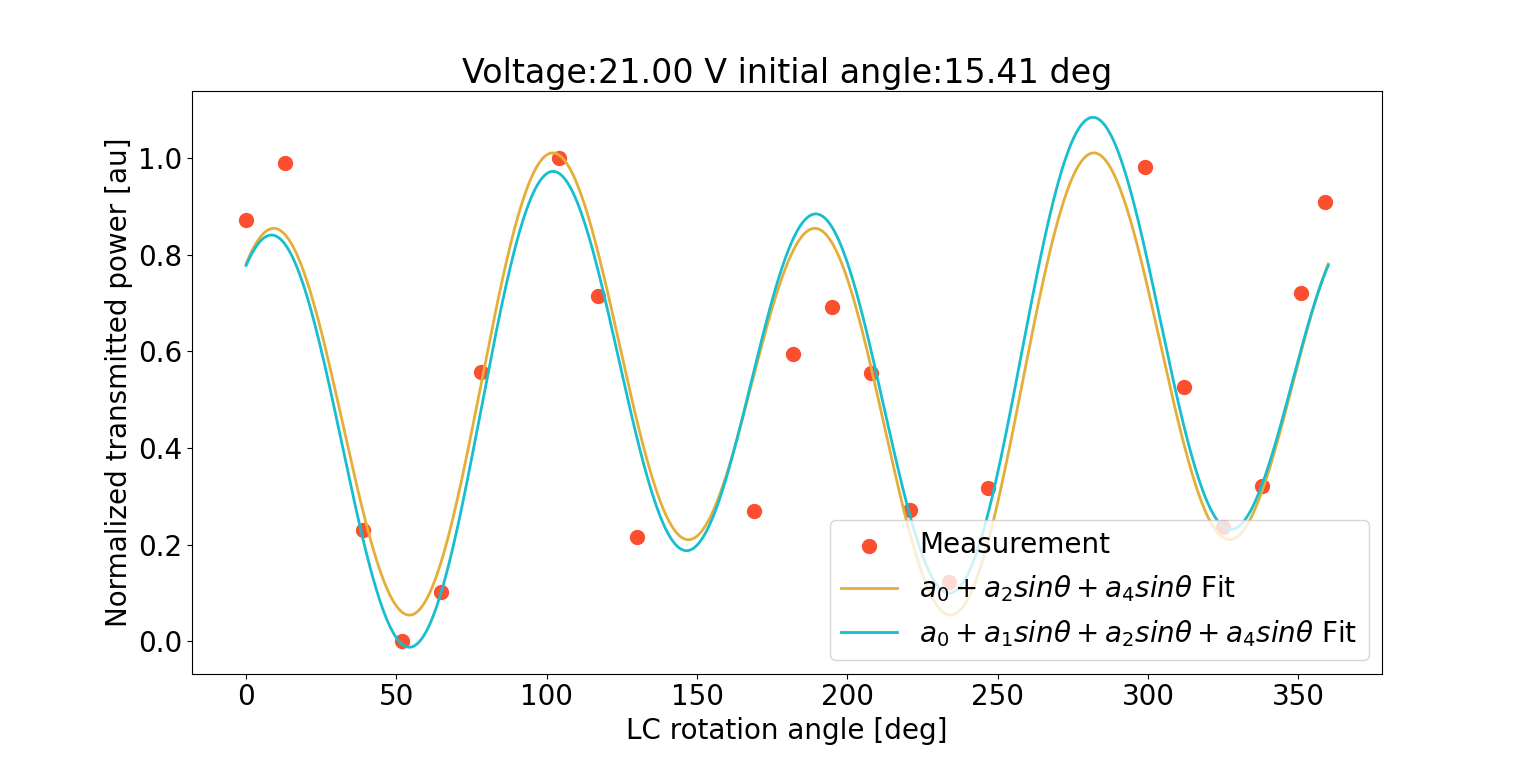
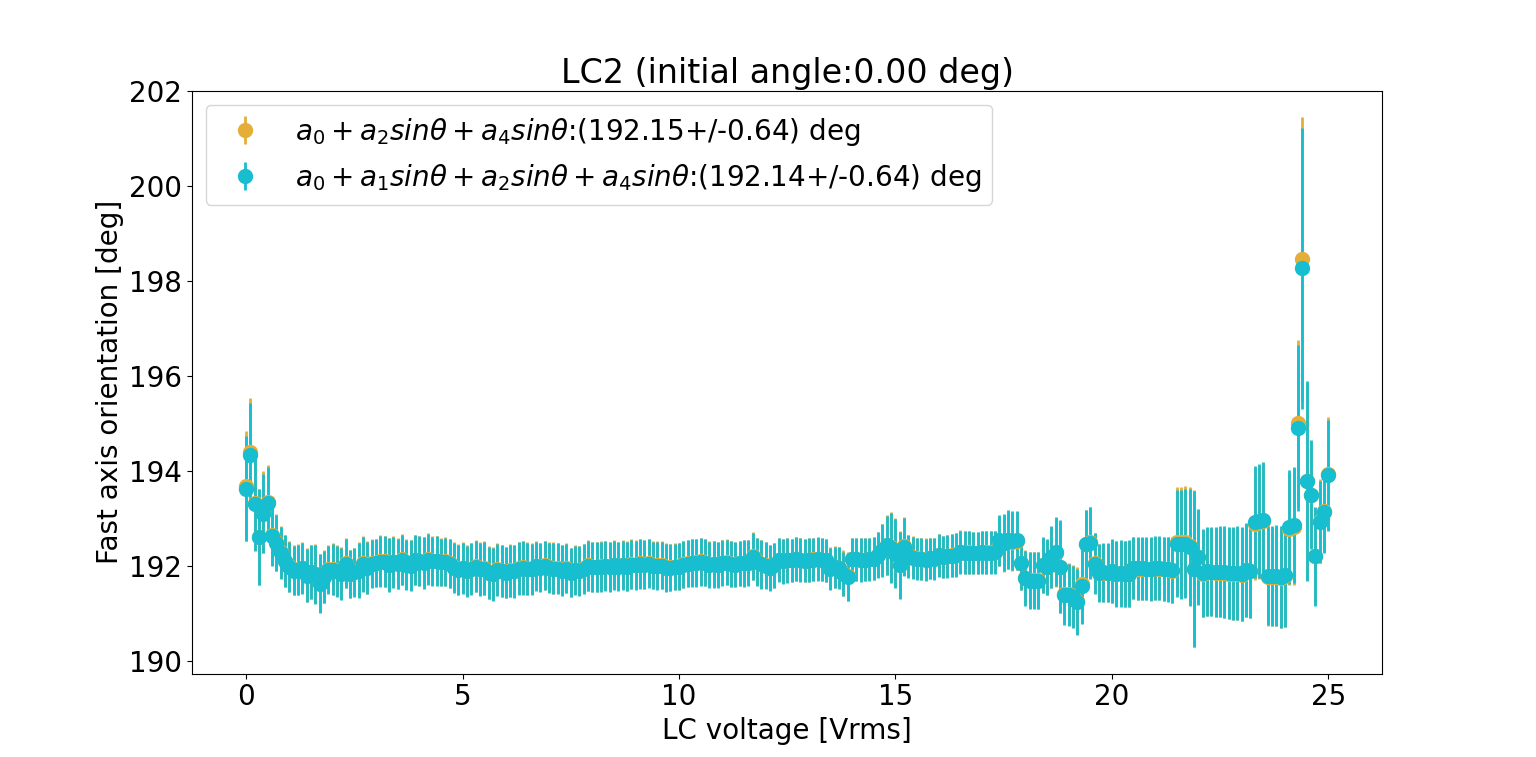
Fast axis measurement of LC2.
Investigating issues mentioned in 3269, I removed the LC and found that somehow the hwp and qwp before lc were not transmitting linear polarization. The beam was displaced in the yaw before even entering the box. This was corrected. This explains the absurd measurement of elog 3262.
Seeing Fig 3 from elog 3269 (where the initial position was 13.58) I moved the LC by 15.41 degrees in antiCW and so the initial position was 358.17 deg. The measurement was done with this and the fast axis orientation obtained is as shown in Fig 1. This was done by 9deg resolution for rotation.
Since the beam changed its obvious that we can't compare this present results with past one. Rotating by 12.15 degree now should align LC to the fast axis.
This fast axis measurement is becoming Mission Impossible.
folder_name = r'C:\Users\atama\OneDrive\LC-Experiment\Measurement Data\LC2_calibration data\fast axis 12'
Summary
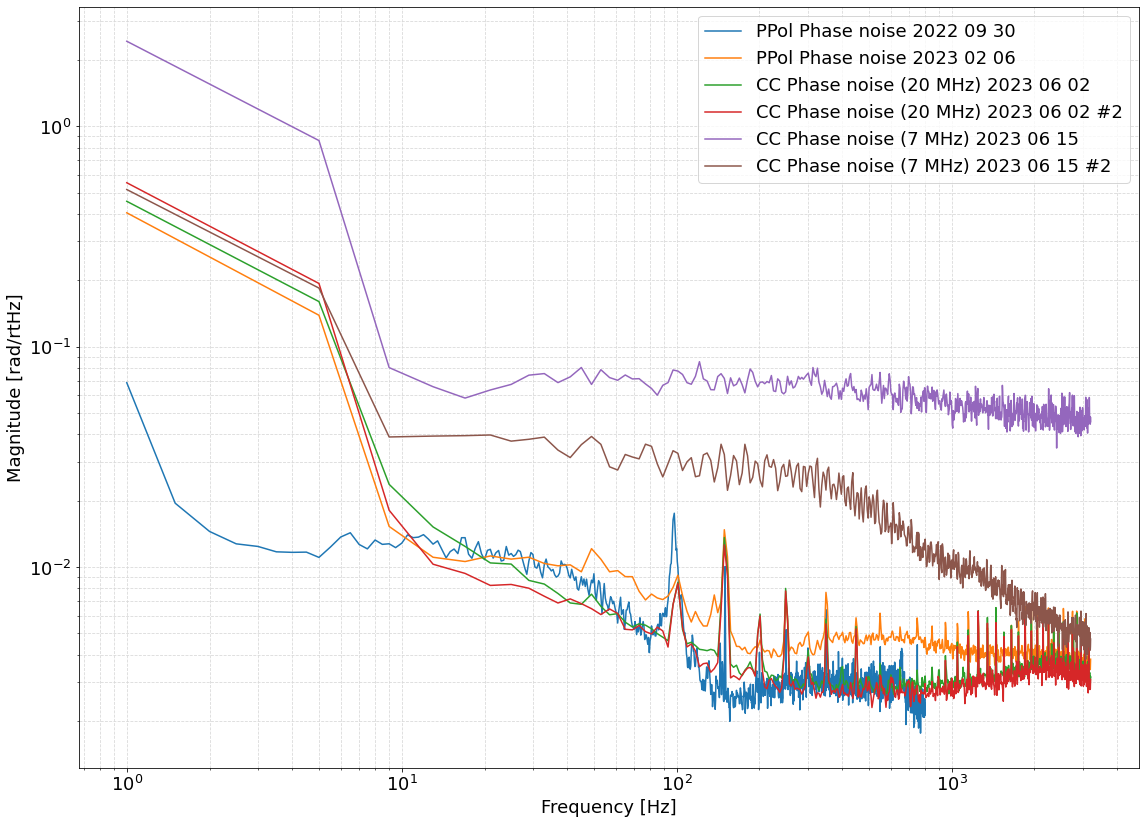
I measured the phase noise of the P-Pol PLL at 50 MHz (normal operation ~200 MHz) and of the CC PLL at 20 MHz (normal operation 7 MHz). Despite the CC PLL instability, the phase noise measurement is not so bad and basically consistent with previous measurements of PLL phase noise. I am guesing that there is an issue of glitches at the normal CC operation frequency because it is much more unstable at 7 MHz than the test frequency of 20 MHz.
Details
I measured the PLL phase noise of both the CC and PPol controls using the method outlined previously. Normally, these loops operate at 7 MHz and ~ 200 MHz, respectively, but this is for the output of the PLL control loop. In the digital system, we input 3x F for CC into DDS3 DAC0, i.e. 21 MHz -> 7 MHz, and (1/5)x F for PPol into DDS3 DAC1, i.e. 35 MHz -> 175 MHz (currently). However, the DDS3 board is mis-wired so DAC3 controls the PPol LO while DAC1 controls the homodyne. For measuring the PLL phase noise, the DDS system is cleanest below 100 MHz, so instead I measured the PPol phase noise using at 50 MHz and the CC at 20 MHz.
The principle behind the PLL phase noise measurement is described in Yuhang's thesis, pg 102. When we input a PLL beatnote and a local oscillator to a mixer at the same frequency we will be left with PLL phase noise. The power spectrum is measured in Vrms/rtHz, so to convert to rad/rtHz we must divide by a calibration factor Apk^2, where Apk is the peak to peak amplitude of the oscillating output of the mixer when the beatnote and LO are offset by some small frequency ~ 100 Hz. I use a small mixer MiniCircuits ZX05-1L-S+ which has a damage threshold of 17 dBm (50 mW at 50 Ohm). A local oscillator (either DAC0 or DAC3) goes into the LO port while the PLL [name] MON signal goes into the RF port. An SMA screw-on low pass filter is used at the output.
For the measurements I have the following inputs into the mixer:
CC 50 MHz LO 8.0 dBm, 50.000000 MHz on DDS and spectrum analyzer
PPol 50 MHz beatnote -17 dBm, 10.000000 MHz on DDS, 50.000000 MHz on spectrum analyzer
PPol 20 MHz LO 9.0 dBm, 20.000000 MHz on DDS, 19.913043 MHz on spectrum analyzer
CC 20 MHz beatnote -6 dBm, 60.000000 MHz on DDS, 20.030000 MHz on spectrum analyzer
The spectrum analyzer seems to be a bit inaccurate on peak finding. Oscillatory behaviour at the output of the mixer depends on frequency offset as set on the computer to the DDS and can be seen on the oscilloscope, rather than "as measured" on the spectrum analyzer peak finder.
For the spectral measurement I use PSD units Vrms/rtHz. I then convert to rad/rtHz using the Apk calibration factor, 0.0568 mVpk for the PPol and 0.0086 mVpk for the CC. The phase noise spectrum is shown in figure 1. They are compared with a previous measurement in September last year. It seems the CC phase noise at 20 MHz is not too bad. Both the PPol and CC loops remained locked for a long time during the test. However, the PLL lock for the CC was seen to be quite unstable at its normal operating frequency. Perhaps it is glitch noise rather than stationary noise, or maybe there is some cross coupling when operating at 7 MHz. PPol has about 50% extra noise in the range 500-2000 Hz. The difference at the lowest frequency is due to the frequency resolution of the measurement rather than the system.
Angle correction in analysis
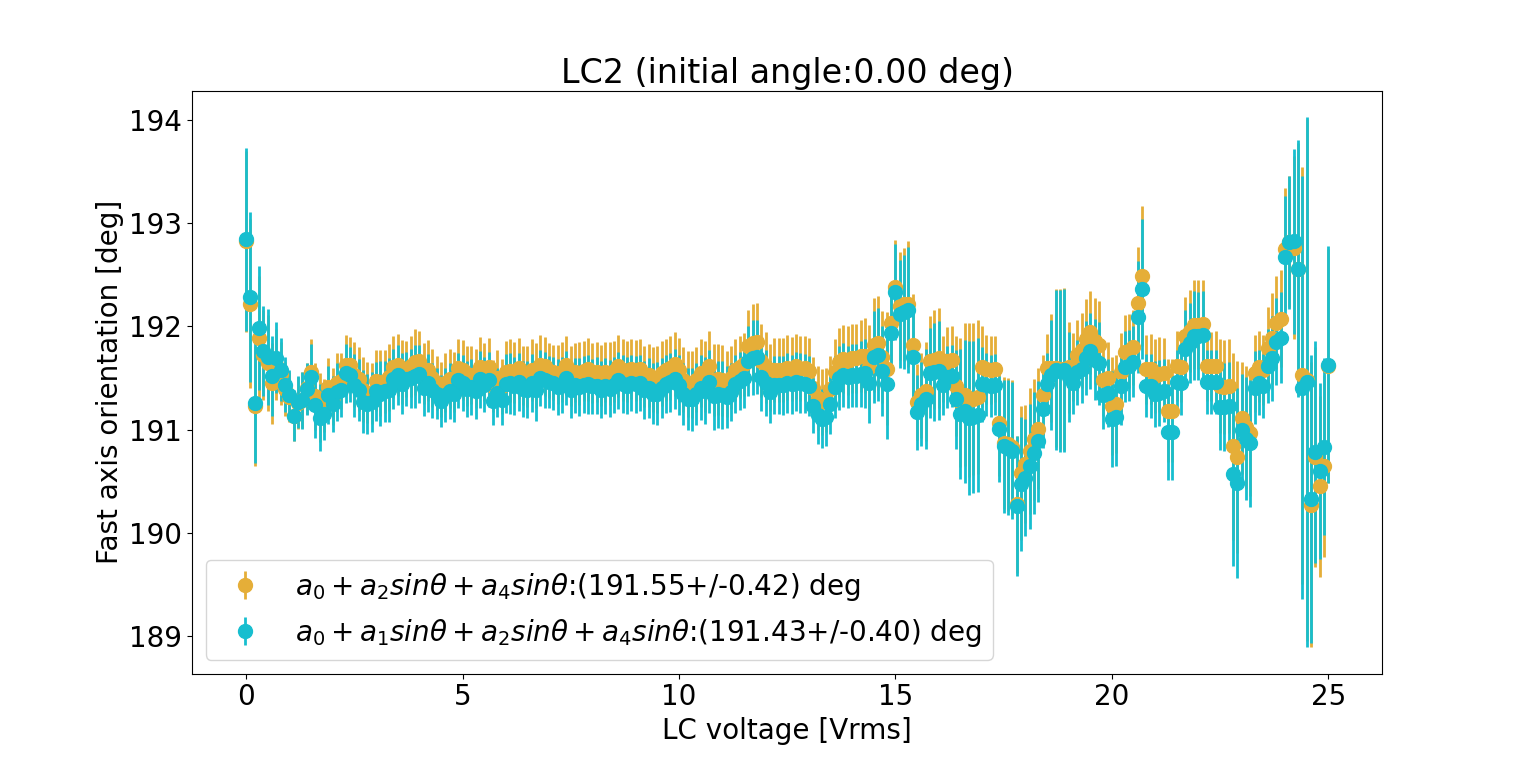
The problem for angles is happening maybe because we were considering the start position of rotation as 0° (instead of the actual angle of rotator). This was removed and we consider initial angle as 0° for all measurements now to understand what's going on
1. Fig 1 from elog 3256 where measured angle is 191.43° (start point) at Temp=25°
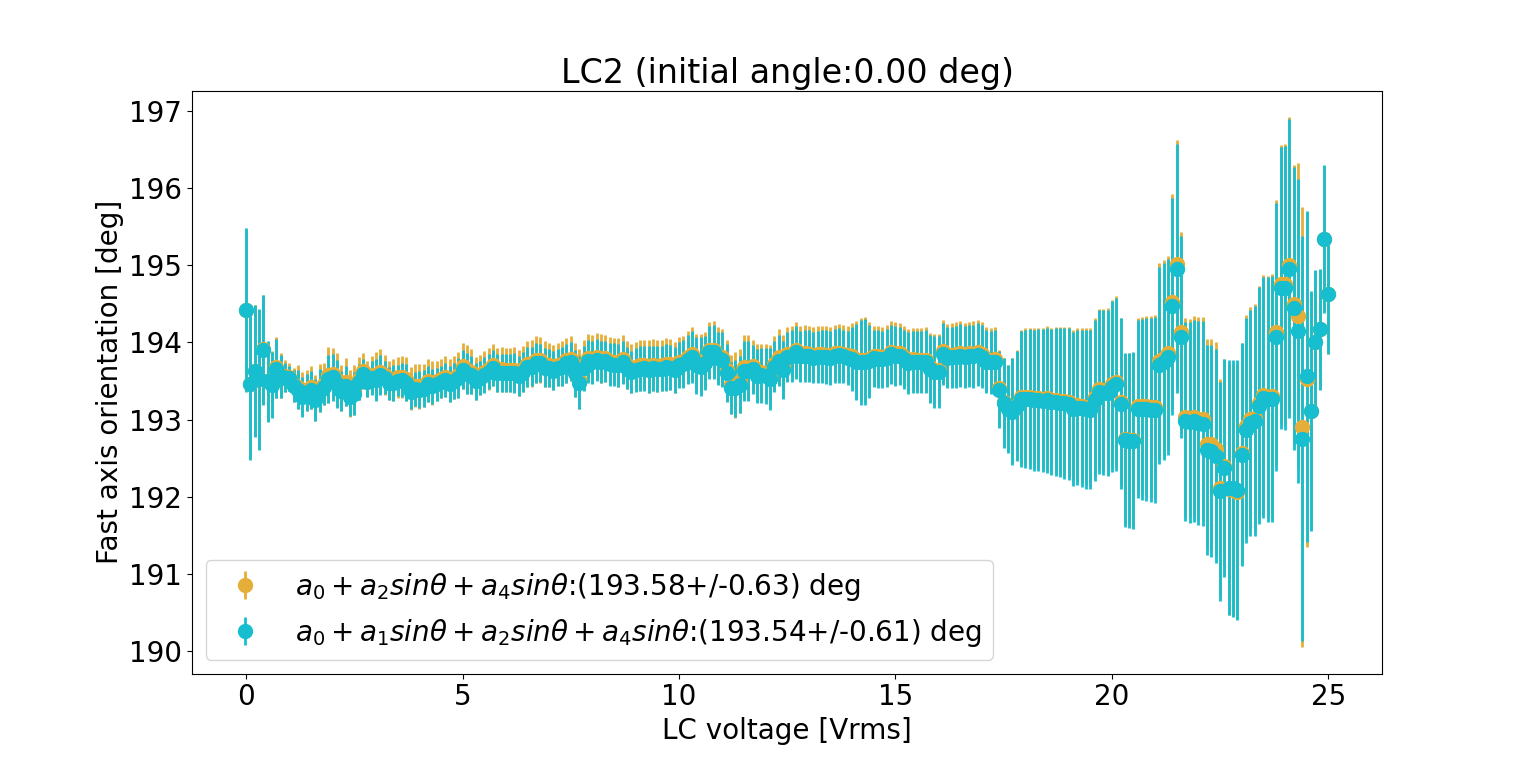
2. Fig 2 from elog 3256 where measured angle is 193.54° (after CW rotation by 11.43°) at Temp=30°
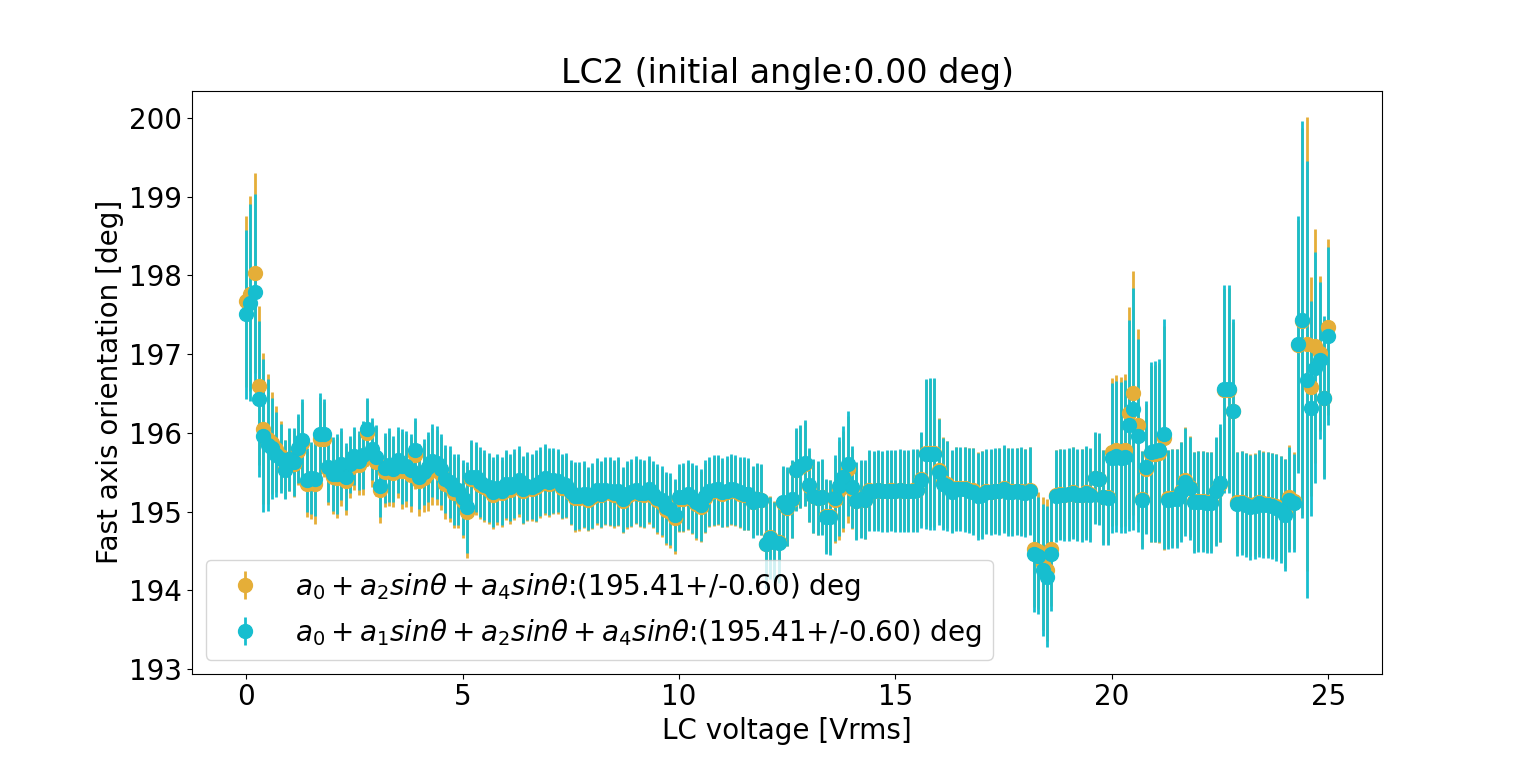
3. Fig 3 from elog 3260 where measured angle is 195.41° (after CW rotation by 2.15°) at Temp=30°
4. Fig 4 from elog 3262 where measured angle is 183.3° (after CW rotation by 1.83°) at Temp=30°

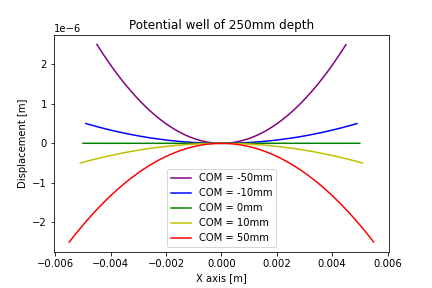
I computed potential well and resonant frequency of Roberts Linkage.
Both results were made by material point model.
Potential well of Roberts Linkage of which depth is 250mm was only attached. Beacuse relationship between COM position and depth are same.
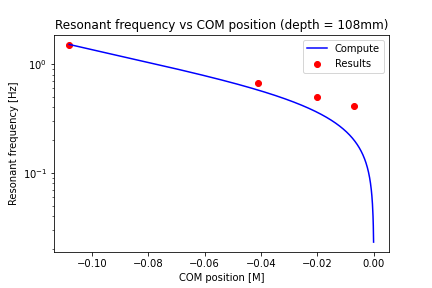
Resonant frequency of Roberts Linkage of which depth are 108mm and 250mm wrere attached.
Some measuremet results of which depth is 108mm are far from material point model's ones.
Actually, I don't know certain reasons. I just wrote down some suspicious points I thought.
- When I computed COM position, there were mistakes. I think it is most suspicious.
- Material point model was made by some approximation. That maked some gaps?!
- I confused frequency for angular frequency.
- Basically, results' resonant frequency are wrong.
- Basically, material point model are wrong.
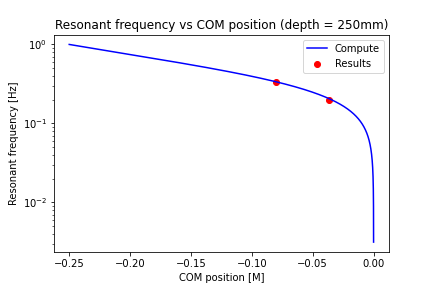
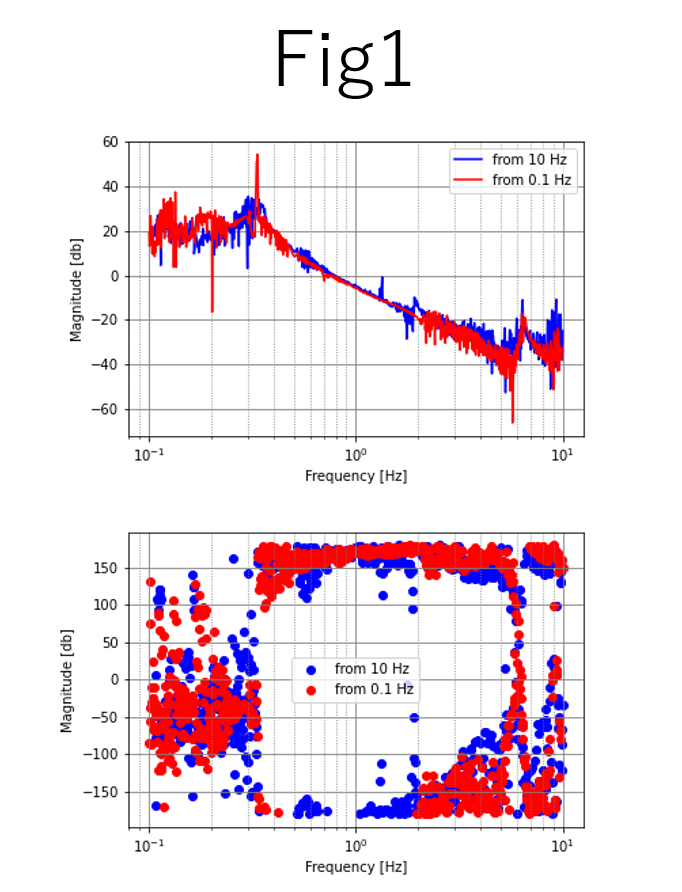
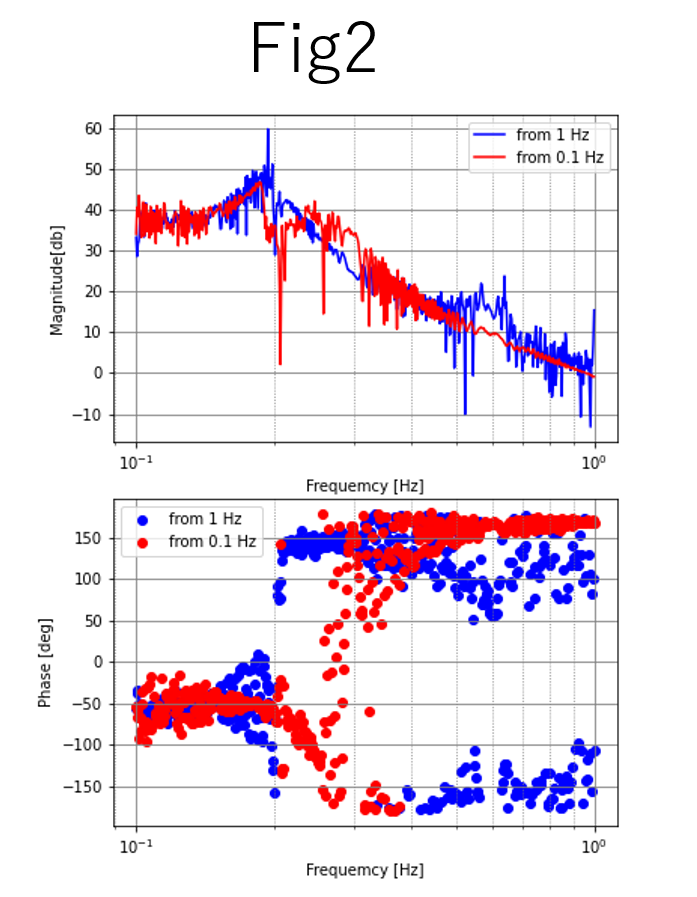
I measured the transfer function and Q factor of Roberts Linkage of which depth is 250mm.
The results were as follows.
| Fig1 | Fig2 | |
| COM position [mm] | 80 | 37 |
| Resonant Frequency [Hz] | 0.33 | 0.20 |
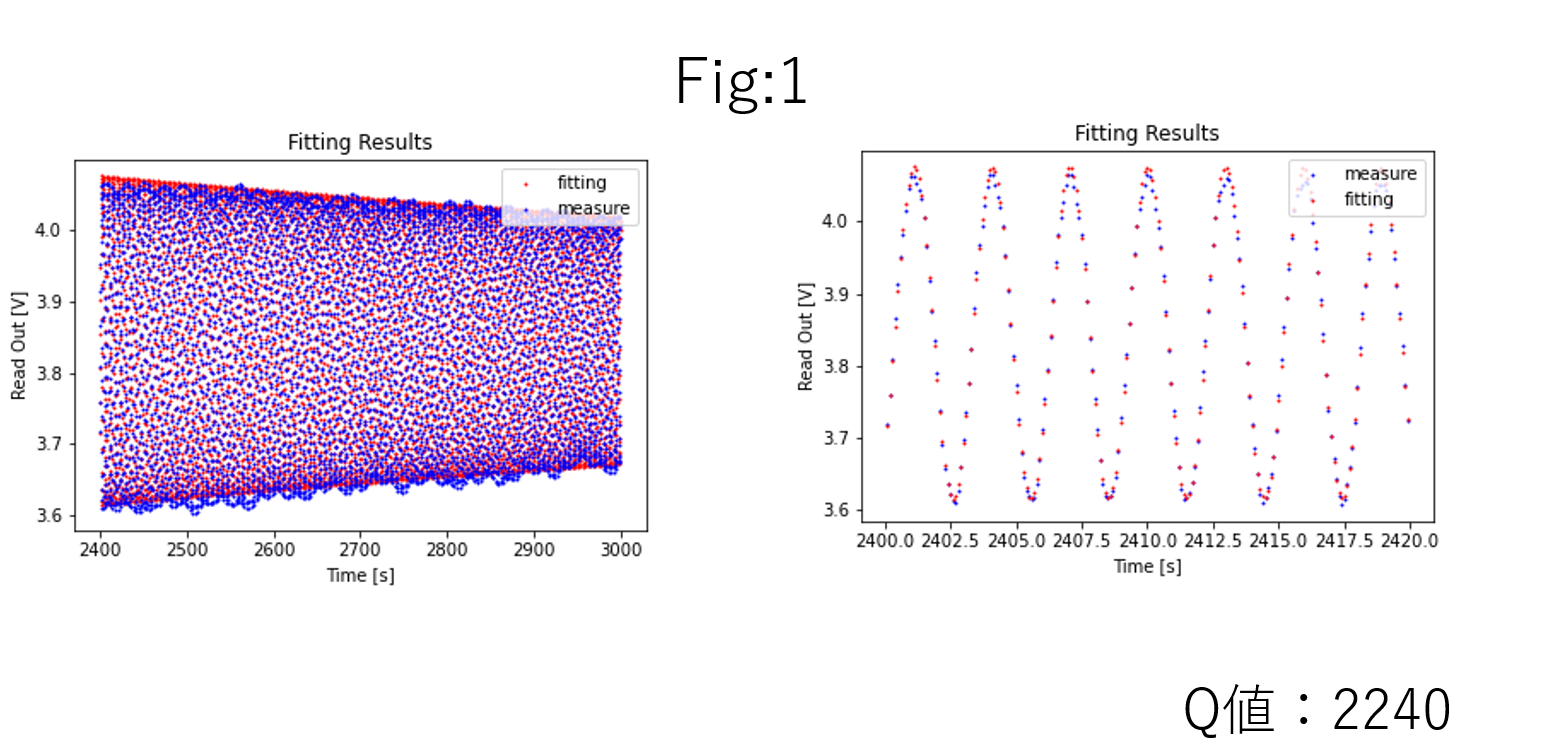
| Q factor | 2240 | --- |
I measured the resonant frequency by fitting transfer function. The results were attached.
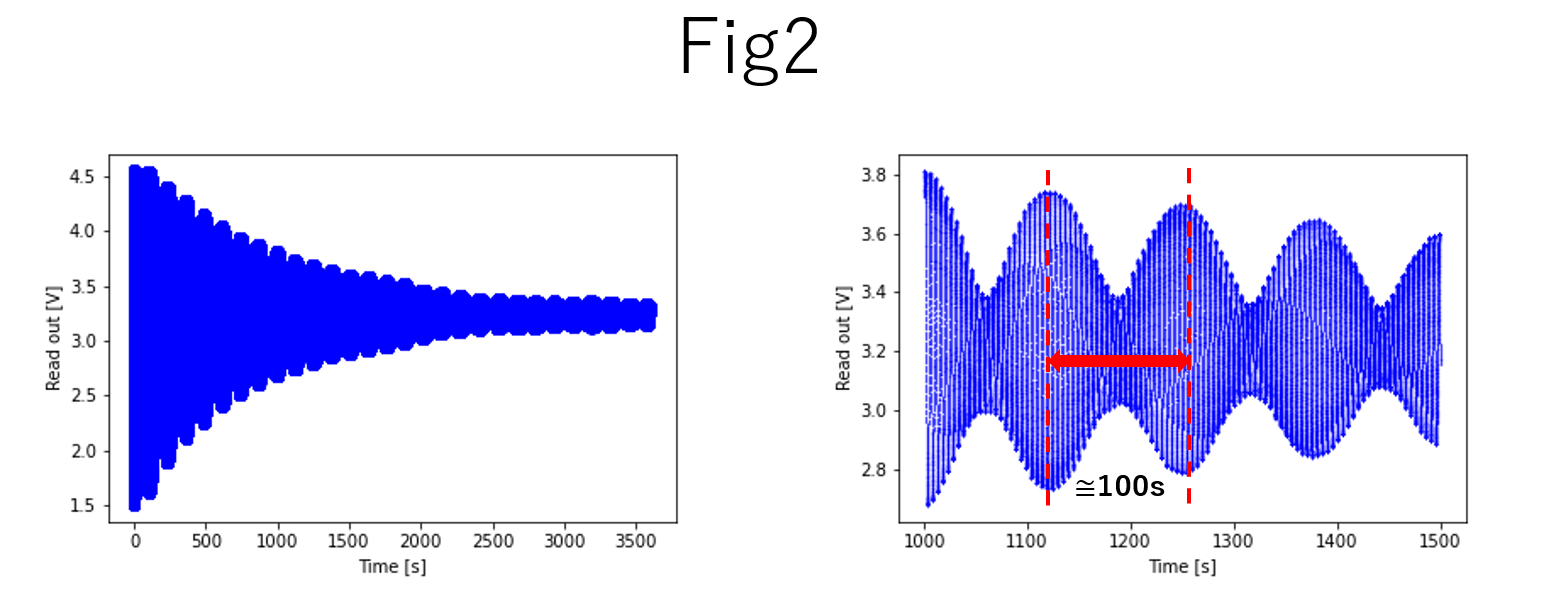
I measured Q factor by ring down curve.
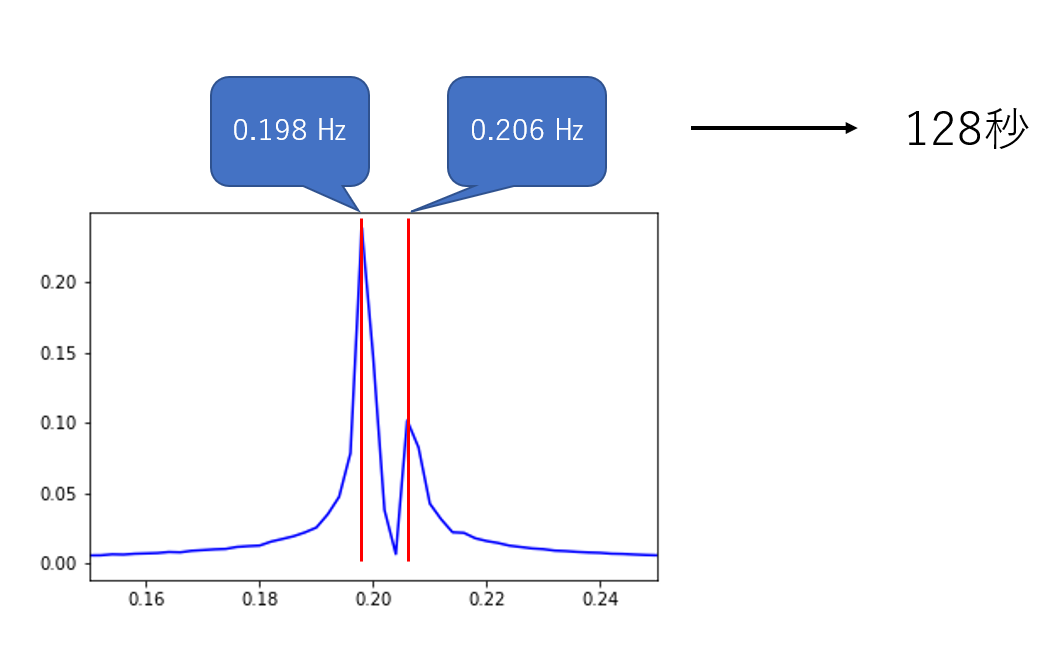
I can't measured Q factor of which COM position is 37mm, because ring down curve is affected by the another axis' motion.
I tryed doing FFT to ring down curve of which COM position is 37mm.
The result related to ring down curve were also attaced.