NAOJ GW Elog Logbook 3.2

Abe, Aritomi, Marc
Today we scanned the bulk sample in z to find the sample center (at z=37.935mm)
Then we had to slightly move the power-meter to get the beam centered.
Finally, we could get R_bulk = 0.7414 with
AC_bulkref = 0.05762;
DC_bulkref = 4.615;
P_in = 23.0e-3;
ACDC = 0.01253;
P_t = 11.4e-3;
This is quite close to the previous value (0.78).
We used as a goal for this calibration 0.74 and stopped when we got this value...
We'll try little more tuning on Monday before starting the absorption measurement.
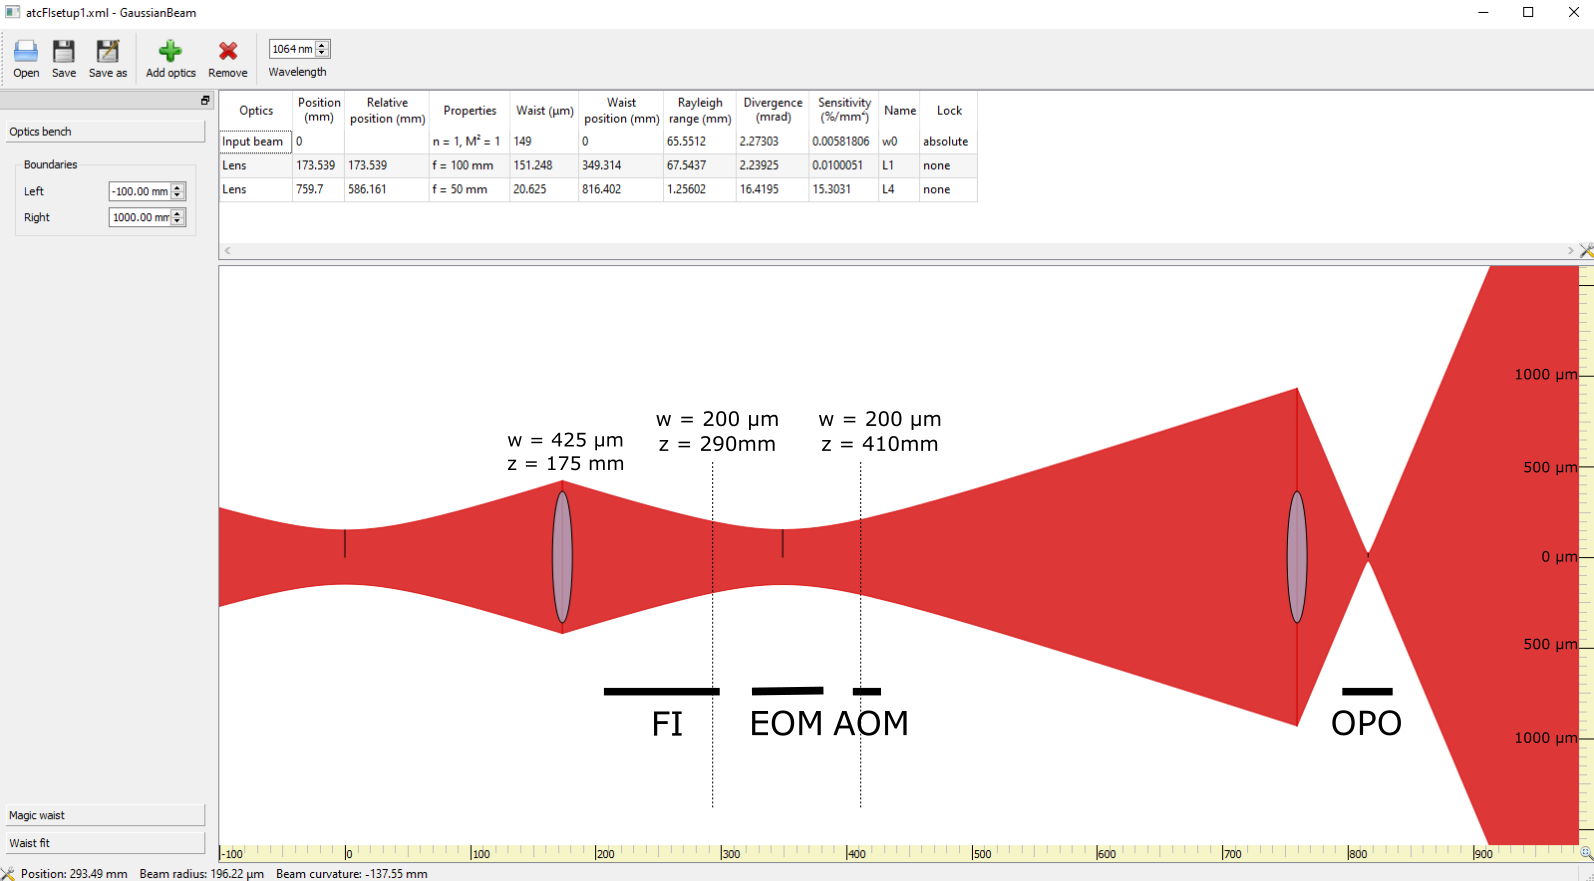
I estimated the level of error signal that we should obtain for locking an OPO cavity. I use similar values as those described in Yuhang/Aritomi's theses for the optical cavity, but will be working with a different modulator. We will lock this cavity using the EOM and then switch off the beam using the AOM in order to obtain a ring down measurement to characterise the losses of the new OPO.
-------
COMPONENTS:
Faraday Isolator - Thorlabs IO-5-1064-VLP
- Aperture: 5 mm diameter
- Aperture heigh: 38mm
- Length: 90 mm
- Max CW power density: 25 W/mm^2 blocking, 100 W/mm^2 transmission
Electro-Optic Modulator - Newport New Focus 4003 Resonant EOM
- Resonant frequency: 40 MHz
- Modulation strength: 0.1-0.3 rad/V
- Aperture: 2mm aperture (ideally 0.4mm beam diameter)
- Aperture height: 14mm
- Length: 56mm
- Max CW power density: 4 W/mm^2
- Max RF power: 1W
Acousto-Optic Modulator - AA Optoelectronic MT110 IR 27 - use manual for MT110-A1.5-xx
- Aperture: ~4mm aperture, should be satisfied by passing through EOM properly
- Aperture height: 8mm
- Length: 22.4 m
- Max rise/fall time: 192 ns
- Max separation angle (0-1): 28.8 mrad
- Max CW power density: 10 W/mm^2
- Bandwidth: 150 MHz bandwidth
- Photocurrent - 0.6 A/W photocurrent at 1064nm
- Transimpedance gain - 5x10^3 V/A for 50 Ohm load, 1x10^4 V/A for high impedance load
- Noise - 2 mVrms nominal
- Detector size - 0.5 mm diameter
--------
SPECIFICATIONS OF OPO CAVITY:
- Input mirror: OPO curved surface, R = 0.99975
- End mirror: Meniscus, R = 0.92
- Length of cavity: 38mm
- Beam waist in OPO cavity: 20.66 µm
- Finesse: 75
- FWHM: 52.5 MHz
- FSR: 3.9 GHz
- No Gaussian beam parameters specified in Finesse modelling
--------
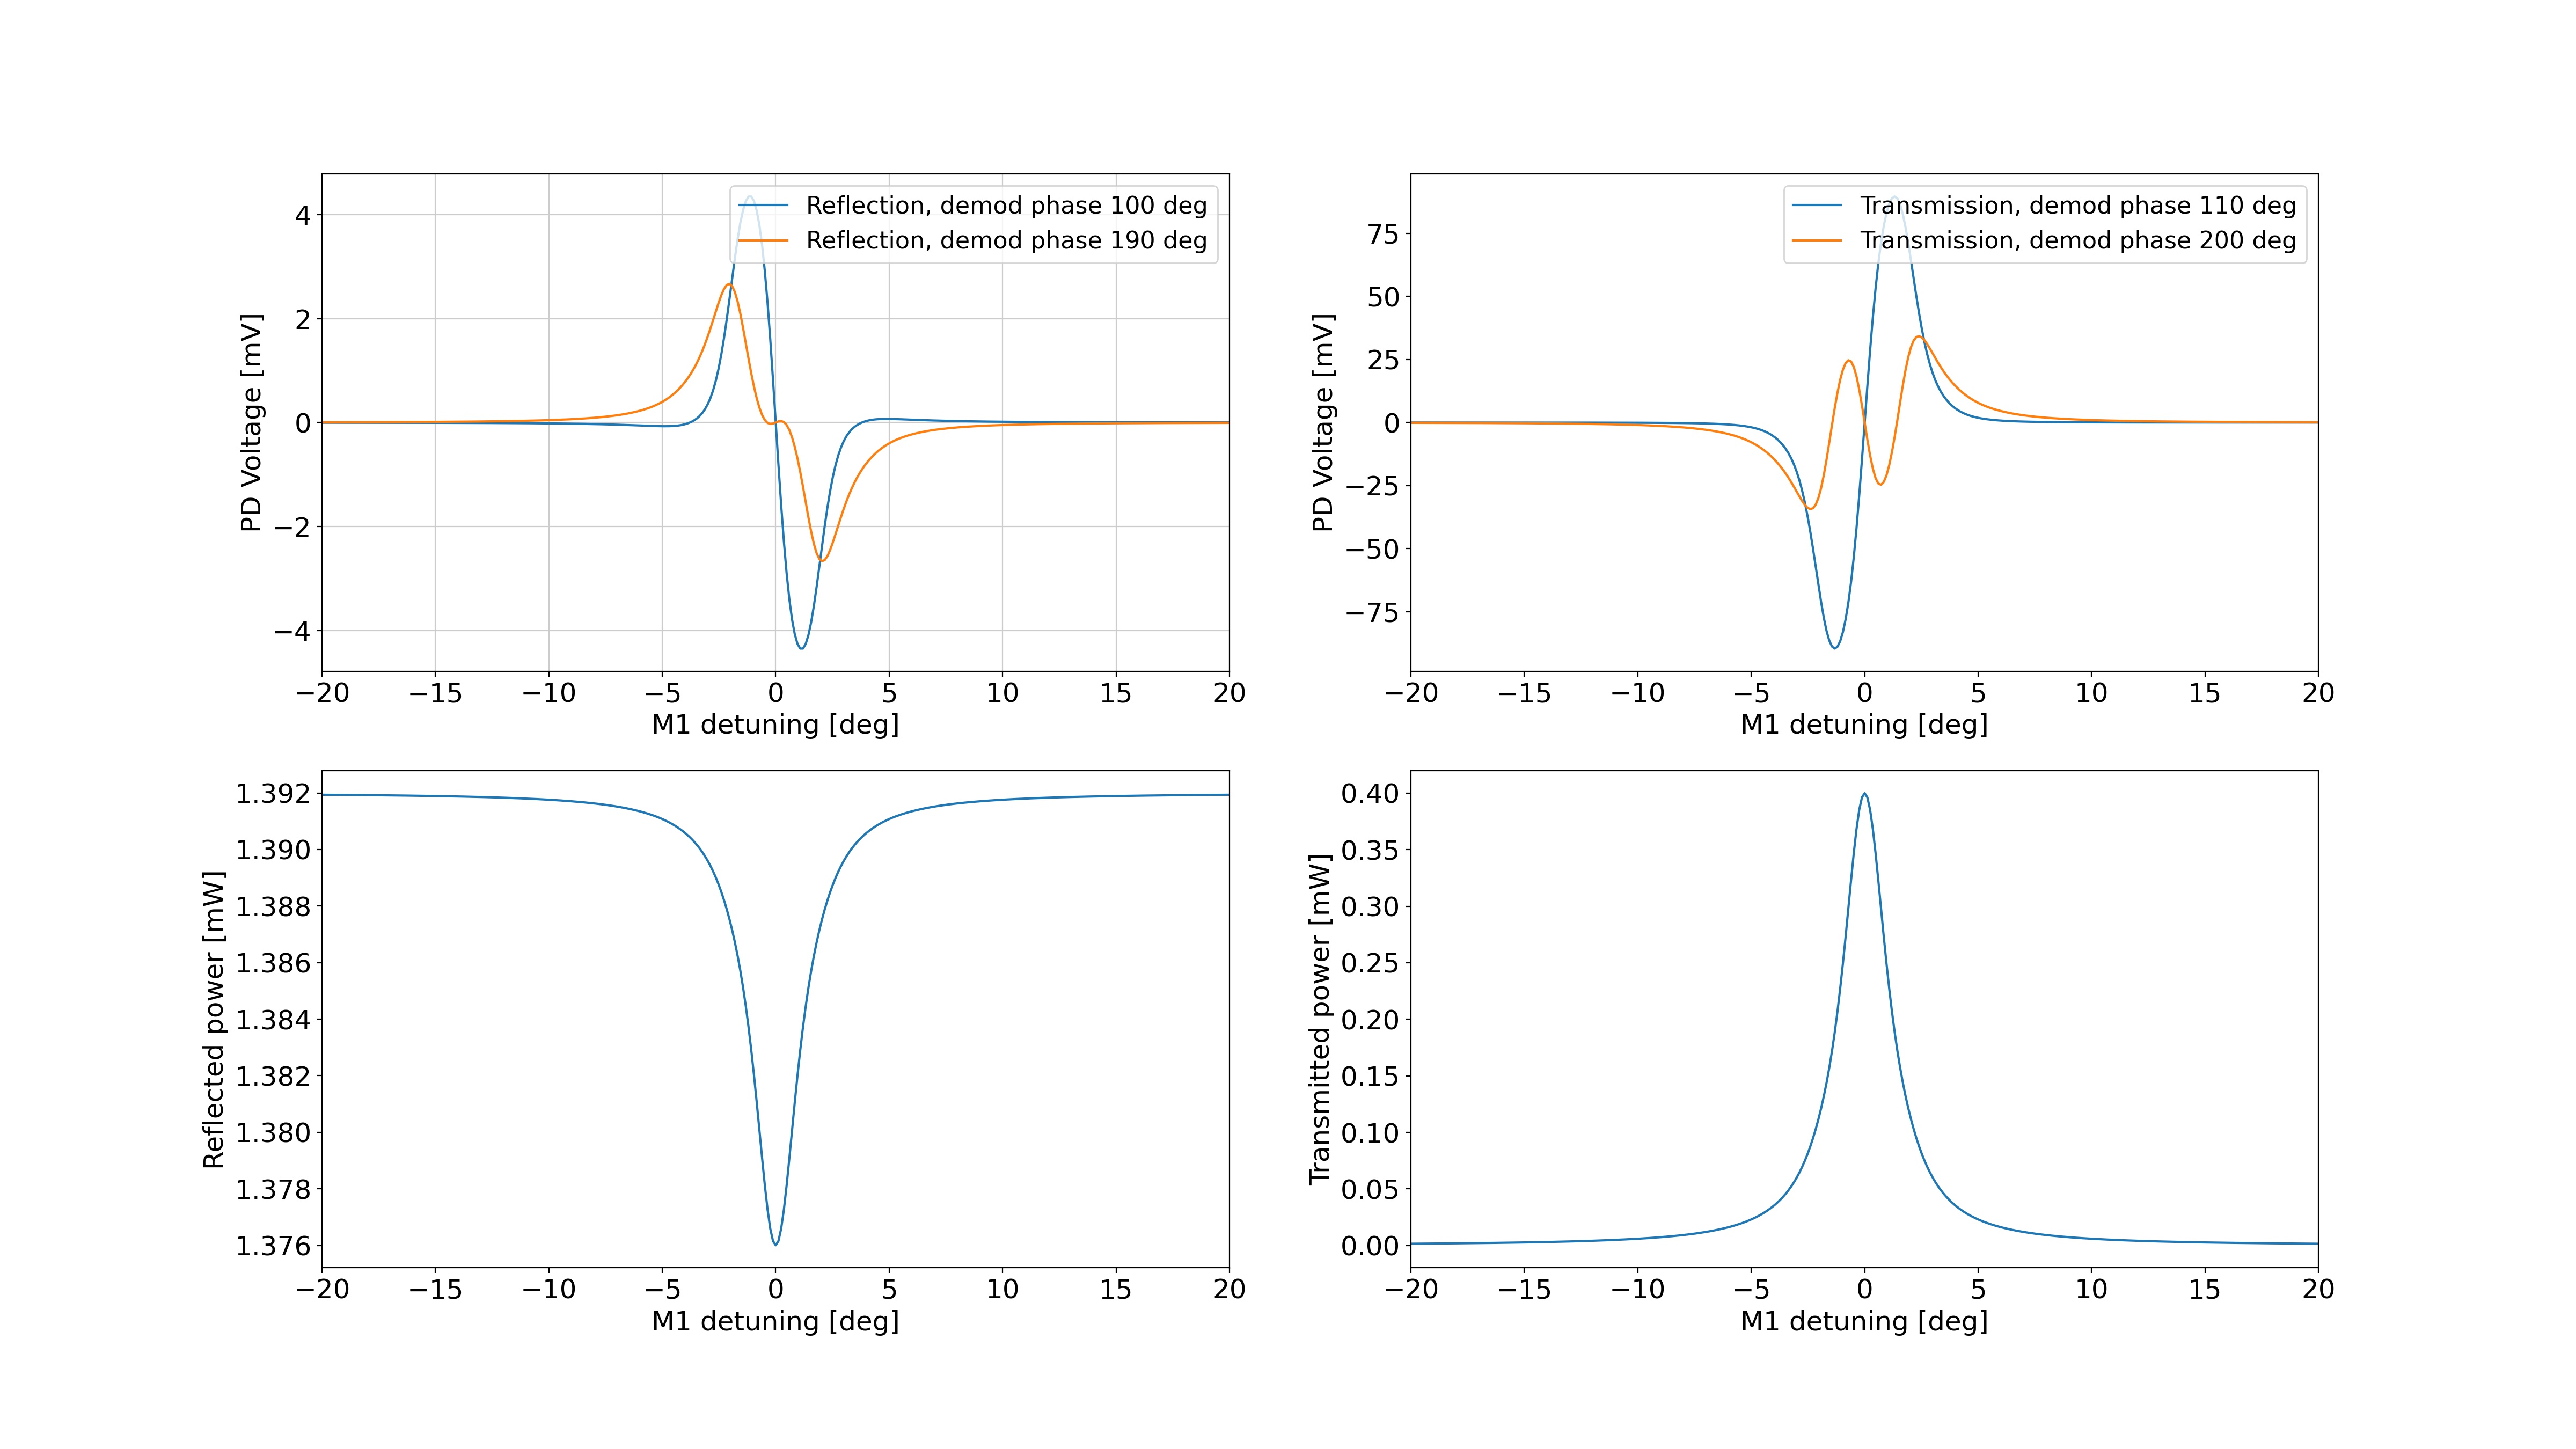
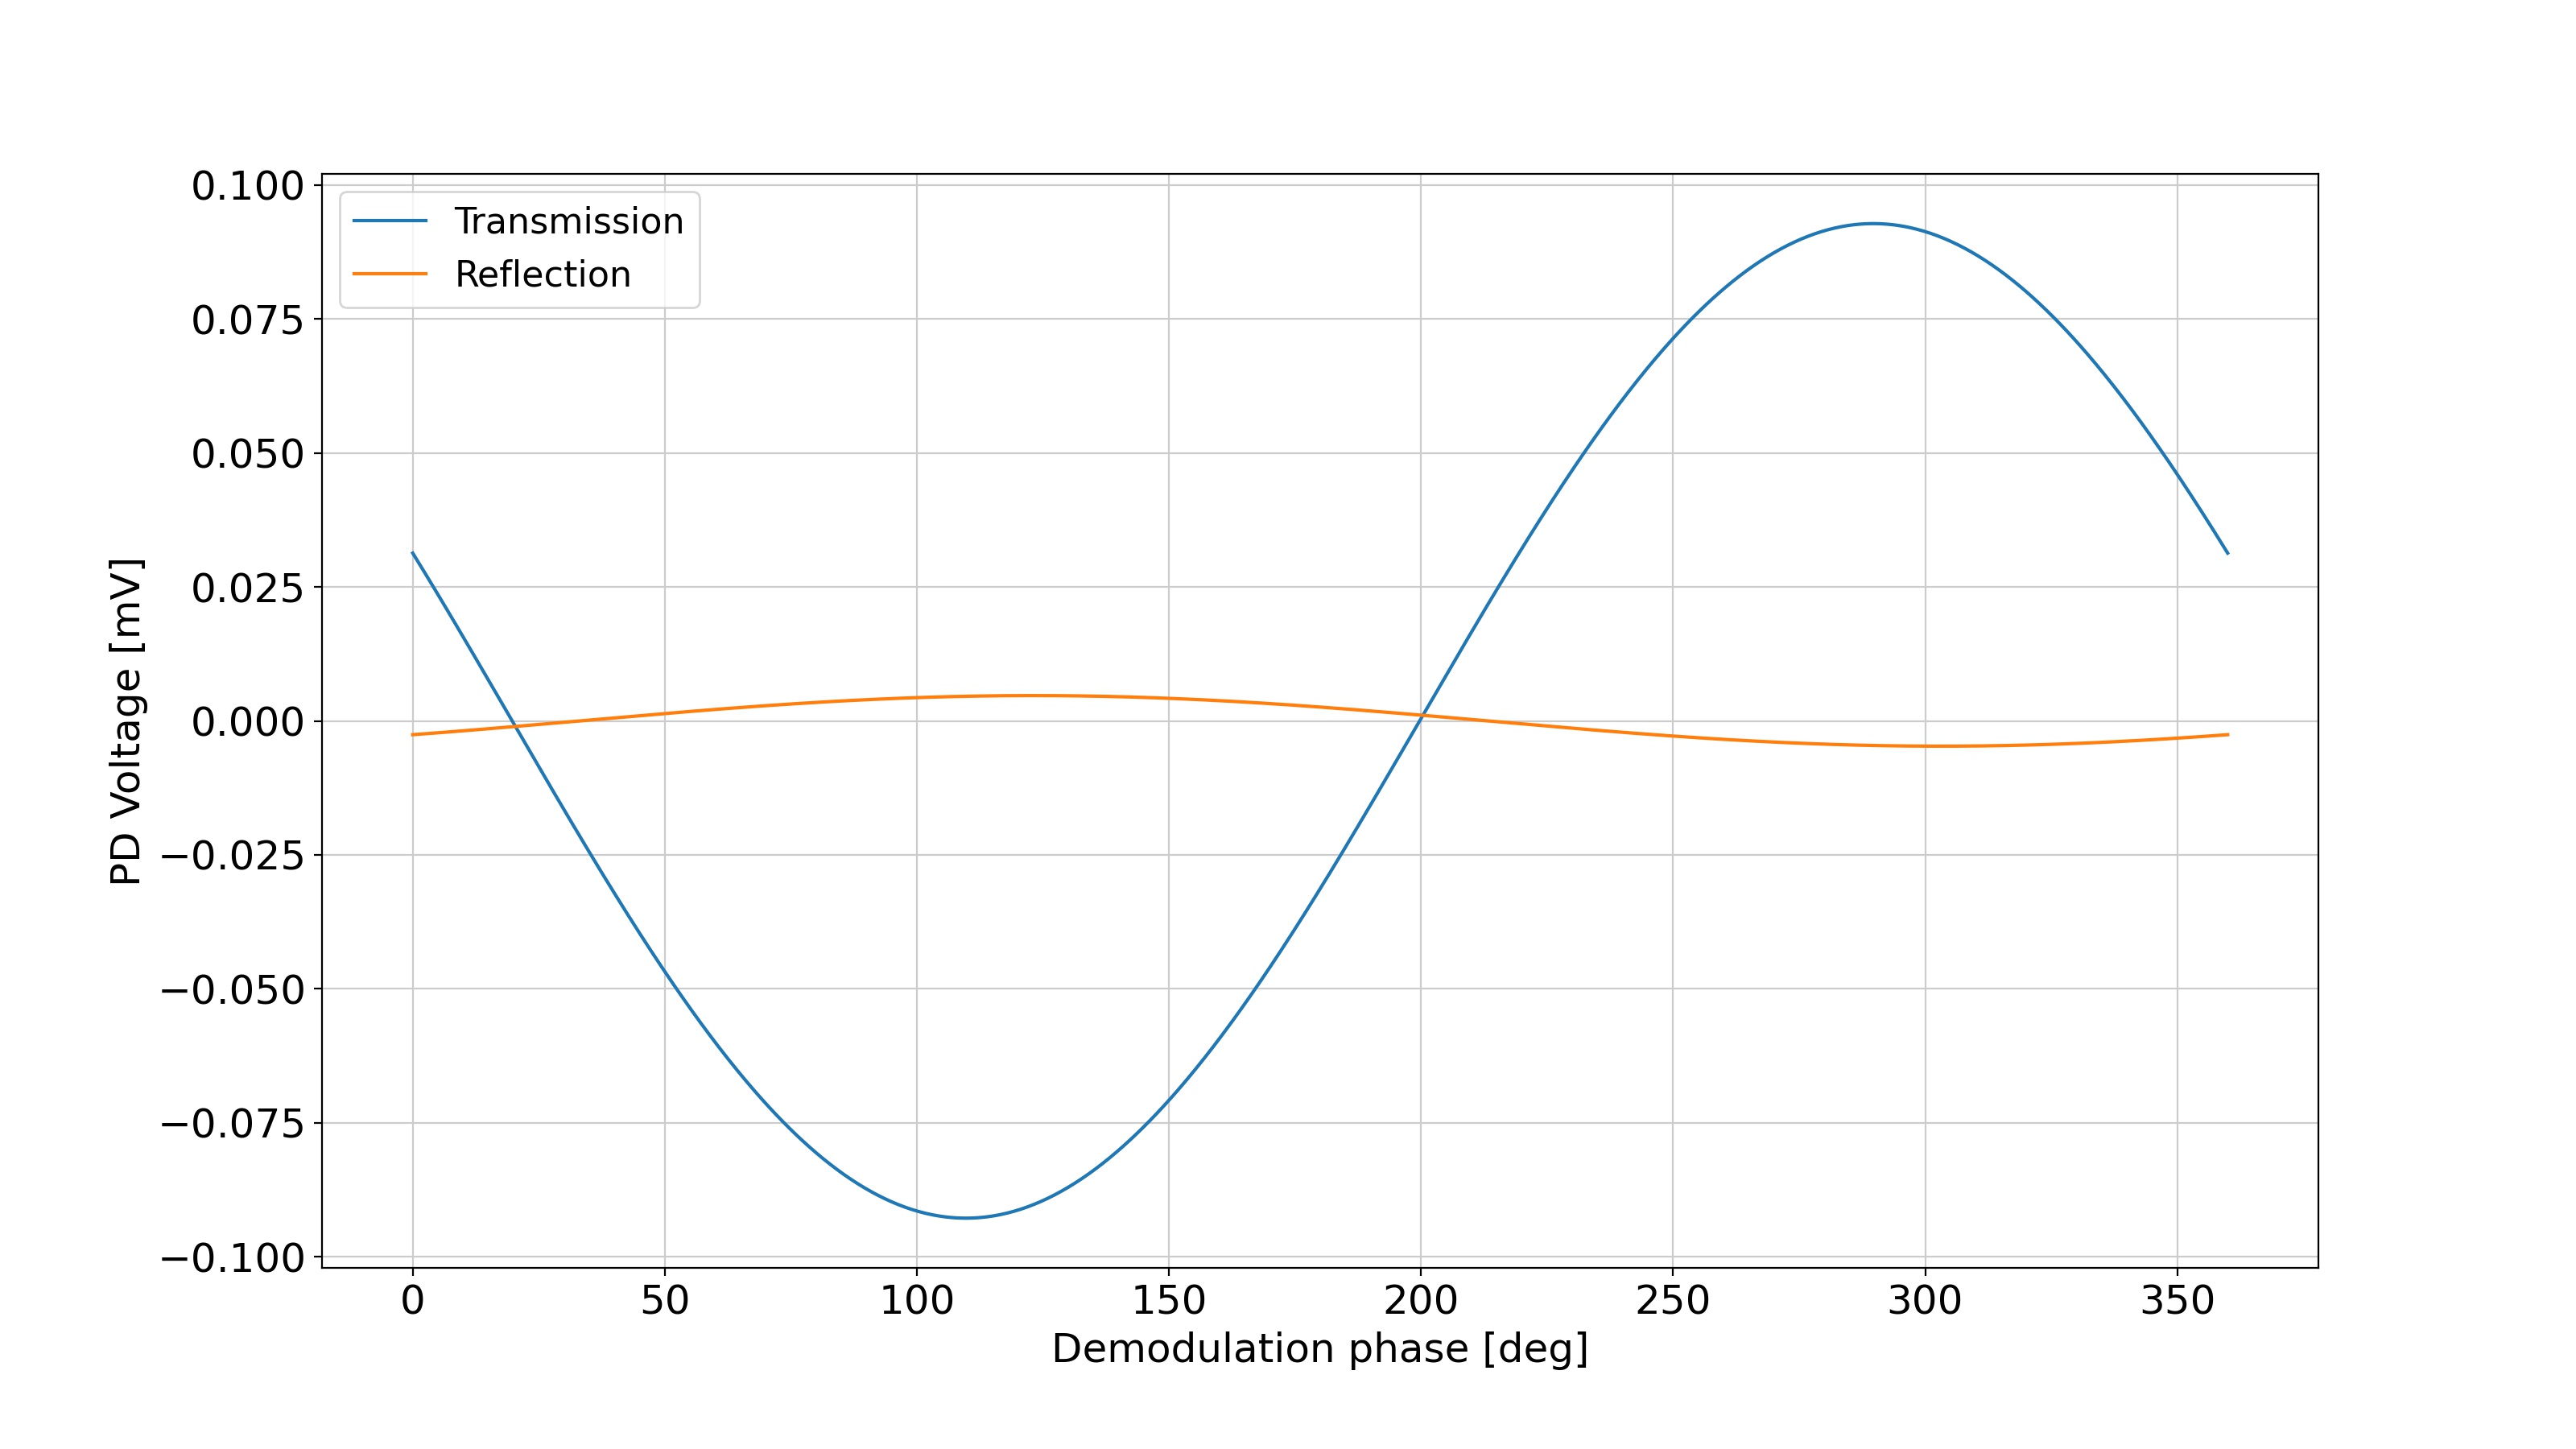
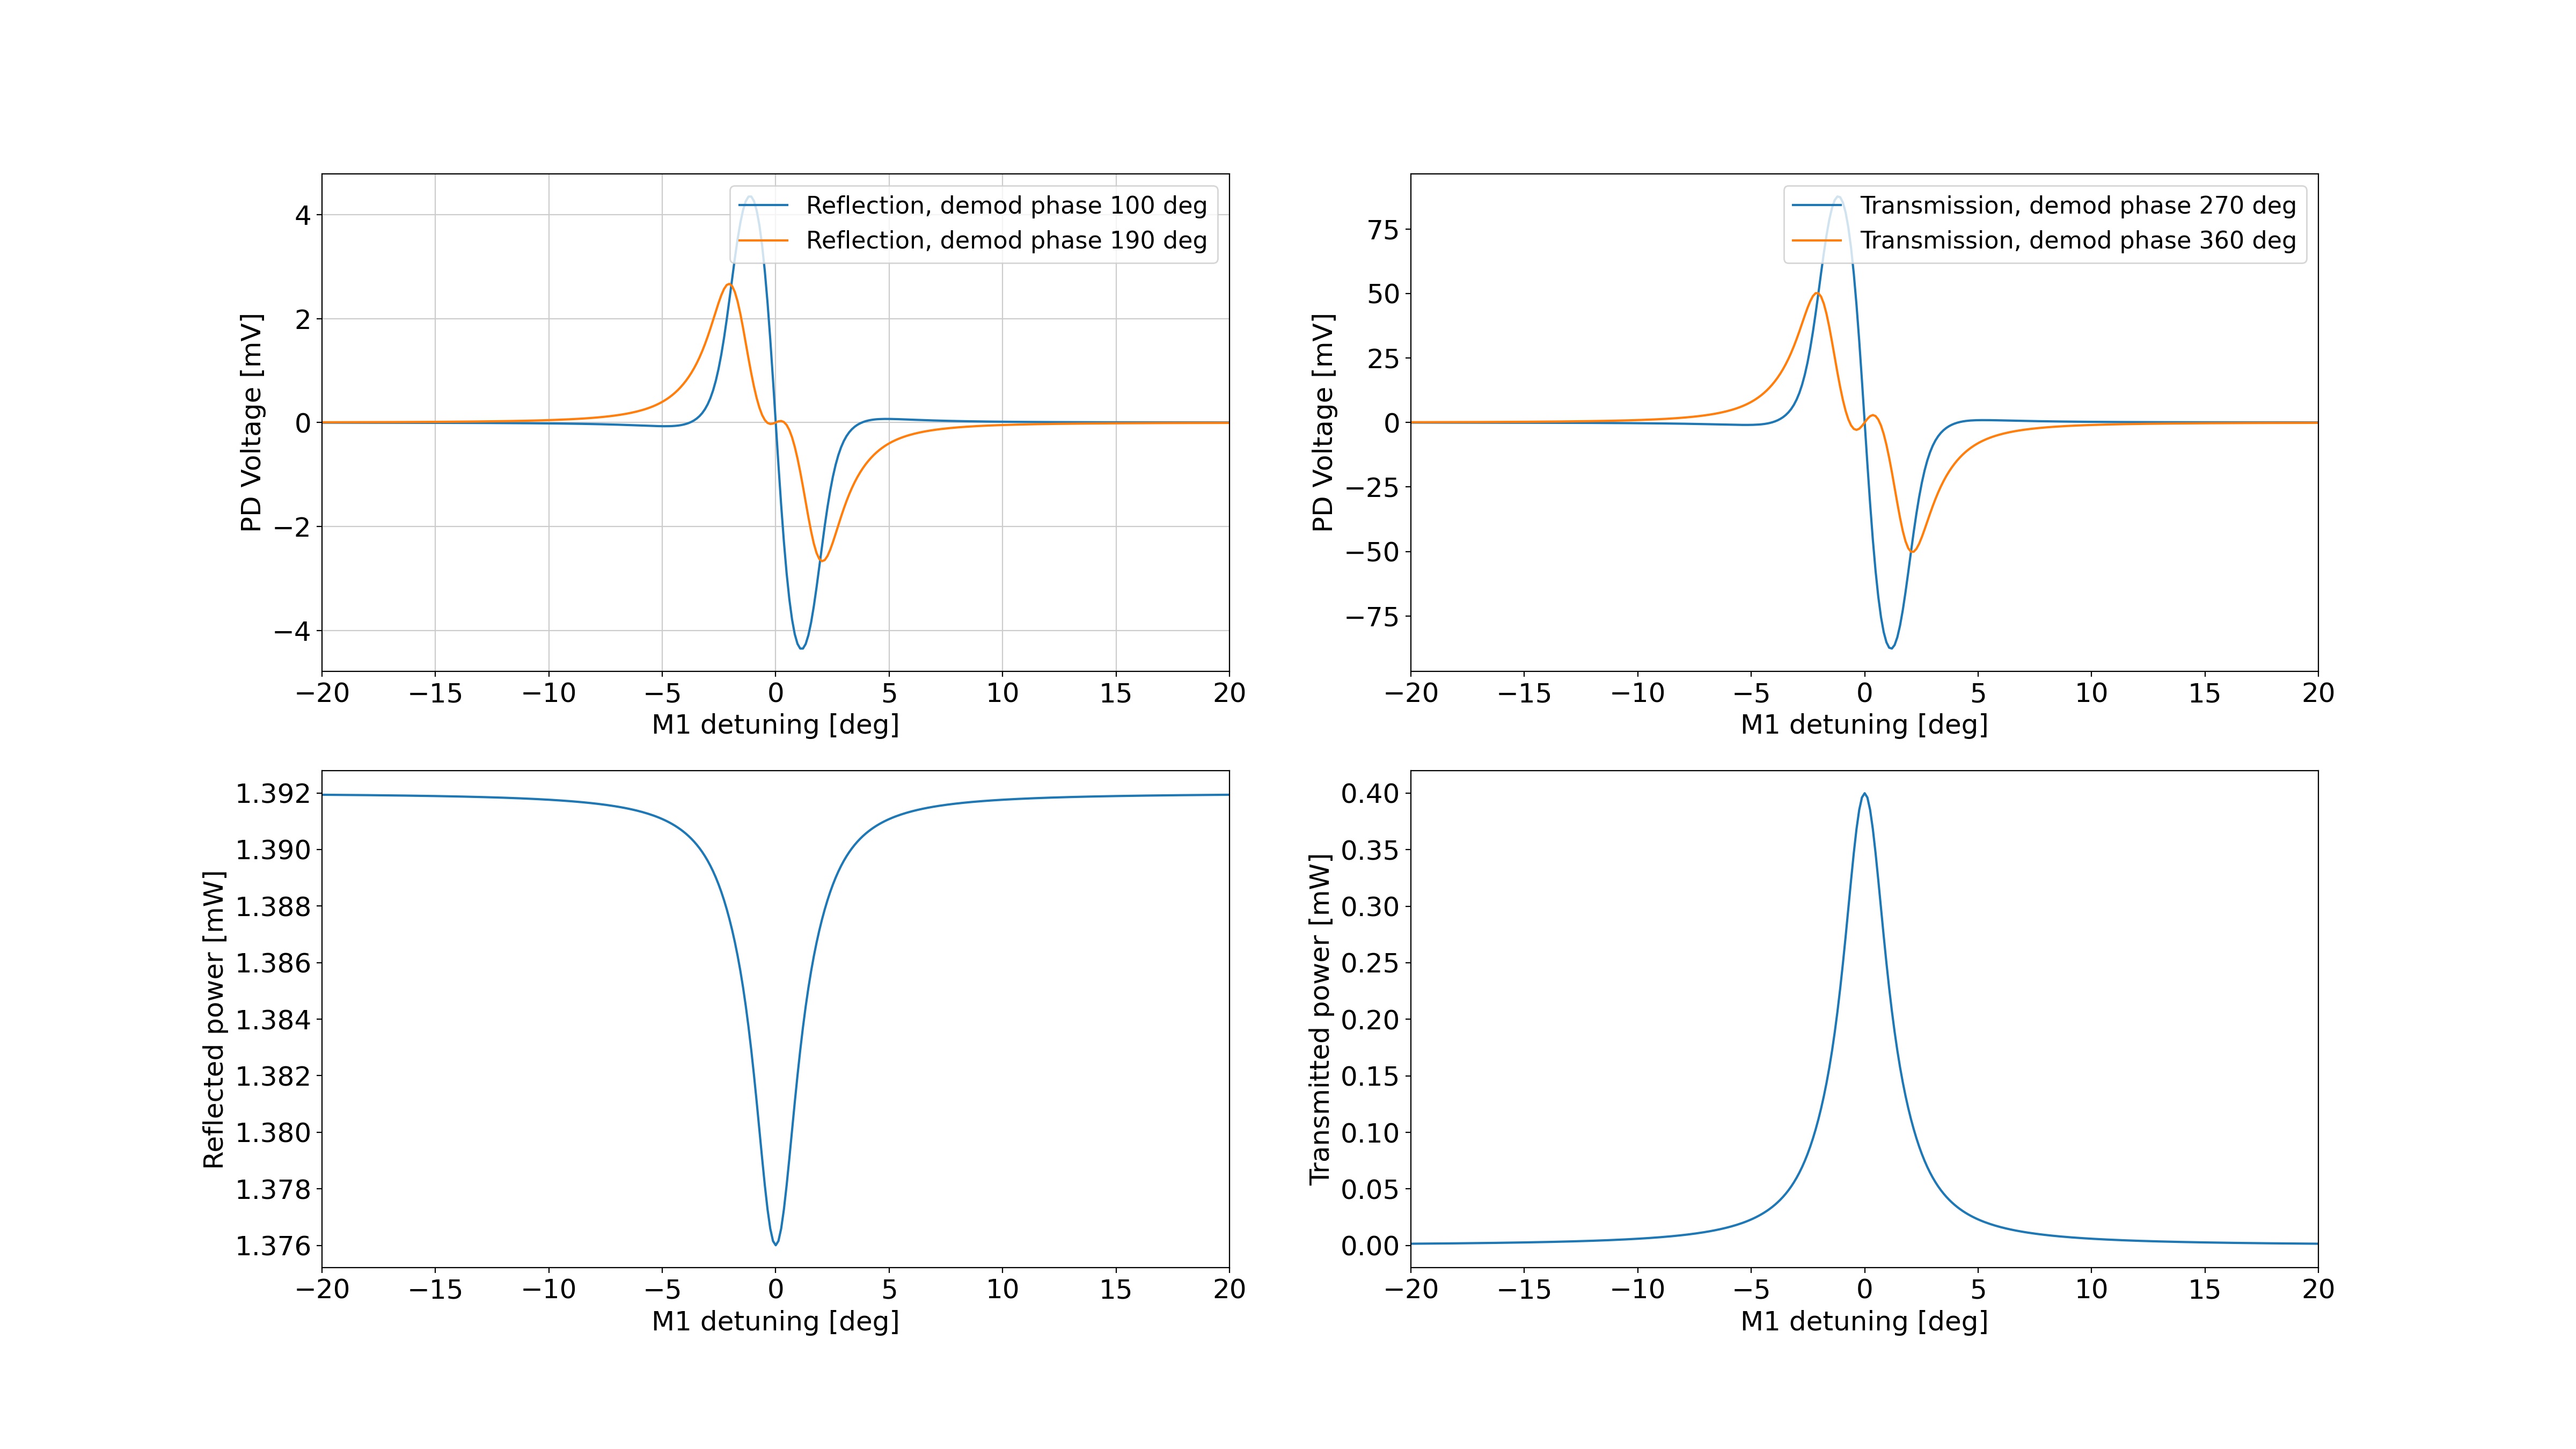
Given a laser input power of approximately 4 mW, I estimate that we will have an error signal with a peak to peak value of less than 10 mV within the linear range. This is extremely small compared to the noise value of the photodetector, so we should use a high power. Figure 1 shows the error signals from the reflection and transmission photodetectors, as well as the reflected and transmitted cavity power, using an input power of 40 mW. Each error signal plot shows the signals of I and Q phase which are spearated by 90 degrees. Figure 2 shows the optimisation of demodulation phase for the particular EOM settings (40 MHz, mod depth 0.3). Figure 3 shows the error signals again but with a different transmission demodulation phase. Perhaps it is better to have the Q phase part be flatter when the I phase is in the linear range.
Looking in the ELog, Eleonora seemed to have the low power issue in 997. This was later fixed by adjusting the mode matching telescope to increase the amount of p-pol into the OPO. Yuhang in 1010 found a simulated error signal reaching 120mVpk and 0.6 mW in transmission of the cavity, for an EOM at 87.6 MHz.
I am not entirely sure of the PPKTP damage threshold but Marc told me it may be an issue. For the modulation optics, the maximum intensity at 40 mW is 0.57 W/mm^2 at the waist. Inside the OPO cavity, the circulating power is ~5 mW with an intensity of 3.7 kW/mm^2.
I have also estimated the following lens setup, given that we want a beam at most 0.67 µm diameter through the EOM (after the FI), and 40 µm on the OPO. For the isolator and modulators, the beam should be less than 1 mm diameter for a range of more than 20 cm, and less than 0.4mm diameter when travelling through the 56mm EOM. The lens setup is shown in Figure 4 with approximate indications of the FI, EOM and AOM lengths.
Michael and Yuhang
Today we found we couldn't lock FC with GR. After checking error signal, I found the phase is not optimized. Then we reload DDS1 with the good phase, we saw good shape GR error signal. Checking from rampauto EPS2, the error signal pk-pk is 3.24V.
This DDS1 phase change is very strange. It seems to happen by itself without power off/on.
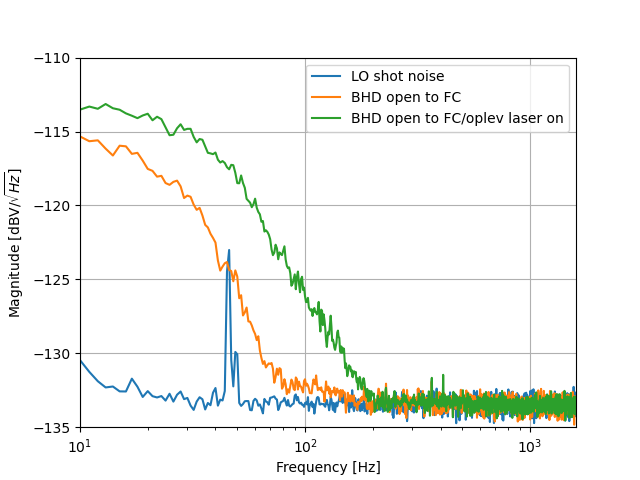
The frequency independent squeezing spectrum became clean due to IRPS improvement and lens flip(elog2445). This means back scattered noise becomes negligible.
To check back scattered noise for frequency dependent squeezing with the same homodyne (BHD) situation. I aligned filter cavity injection and reflection (injection is not optimized). With vacuum going to filter cavity and back to homodyne, I took noise spectrum as attached figure.
Comparing with elog2053 and elog2054, we can see back scattered noise became worse. The back scattered noise was checked twice, which shows change during these two measurement. The difference is that I switch on the oplev laser inside PR/BS chamber. However, oplev laser has different wavelength with infrared, which should not be an issue.
To further examine this situation, we will optimize injection to filter cavity or try to tilt more the lens. Some more investigation about oplev laser is necessary as well.
Abe, Aritomi, Marc
Today we reconnected the particle counter.
It seems that when noone is too close to it we have ~80 particles of size 0.3um and ~30 of size 0.5 um. -> Do we need to clean the cleanroom filters?
However, several larger particles are present when someone get close to it...
We will change cleansuits tomorrow.
Abe, Aritomi, Marc
Because the 2 lenses positions on the ir path has been changed quite a lot, today we decided to scan the imaging unit position.
Results are presented in figure 1.
It seems that now the IU position that maximizes the surface calibration value is Z(IU) = 68 mm.
After finding this new position, we aligned really carefully the pump & probe beams and got R_surf = 17.9 [1/W].
Then, we replaced the surface calibration sample by the bulk sample.
We got R_bulk = 0.67 [cm/W]. A reason of small R_bulk could be that we were not maximizing the DC signal at exactly the center of the sample (?)
The spectrum got from elog2456 is after the replacement of op-amp.
After op-amp replacement, I compared the PD spectrum again with simulation and old measurement. The comparison is shown in the attached figure.
We can see that the new modified PD is still a bit far from simulation.
Also note that because we didn't take many points around ir waist position and with quite large step size (0.05mm), the ir beam parameters might also not be so reliable in this configuration.
Indeed we did the measurement today and seems that we are finally realigned !
For the red, the measurement is totally distorded by a peak when the blade starts to cut the beam as shown in elog2450...
I tried to use different methods to fit (direct fit of the power profile, beam size from the 90% and 10% of the maximum power) without much success...
I'll try again tomorrow with better filtering of the data.
Abe, Aritomi, Marc
As reported in entry 2446, we could recover the expected ir beam parameter.
Today, we placed the surface reference sample on the translation stage.
After maximizing DC and AC, first calibration gave R_surf~15.
Then we moved back the imaging unit from 74mm to 70 mm and got R_surf~17.3 (AC_surfref = 0.3512,DC_surfref = 3.942,P_in = 23.37mW)
The results are presented in figure 1.
The new crossing point seems to be at z=39.25 mm. Also, the 2 lateral peaks are still slightly unbalanced...
I think tomorrow we can try to do few measurements of the surface reference while varying the imaging unit positions and then try to measure the bulk reference.
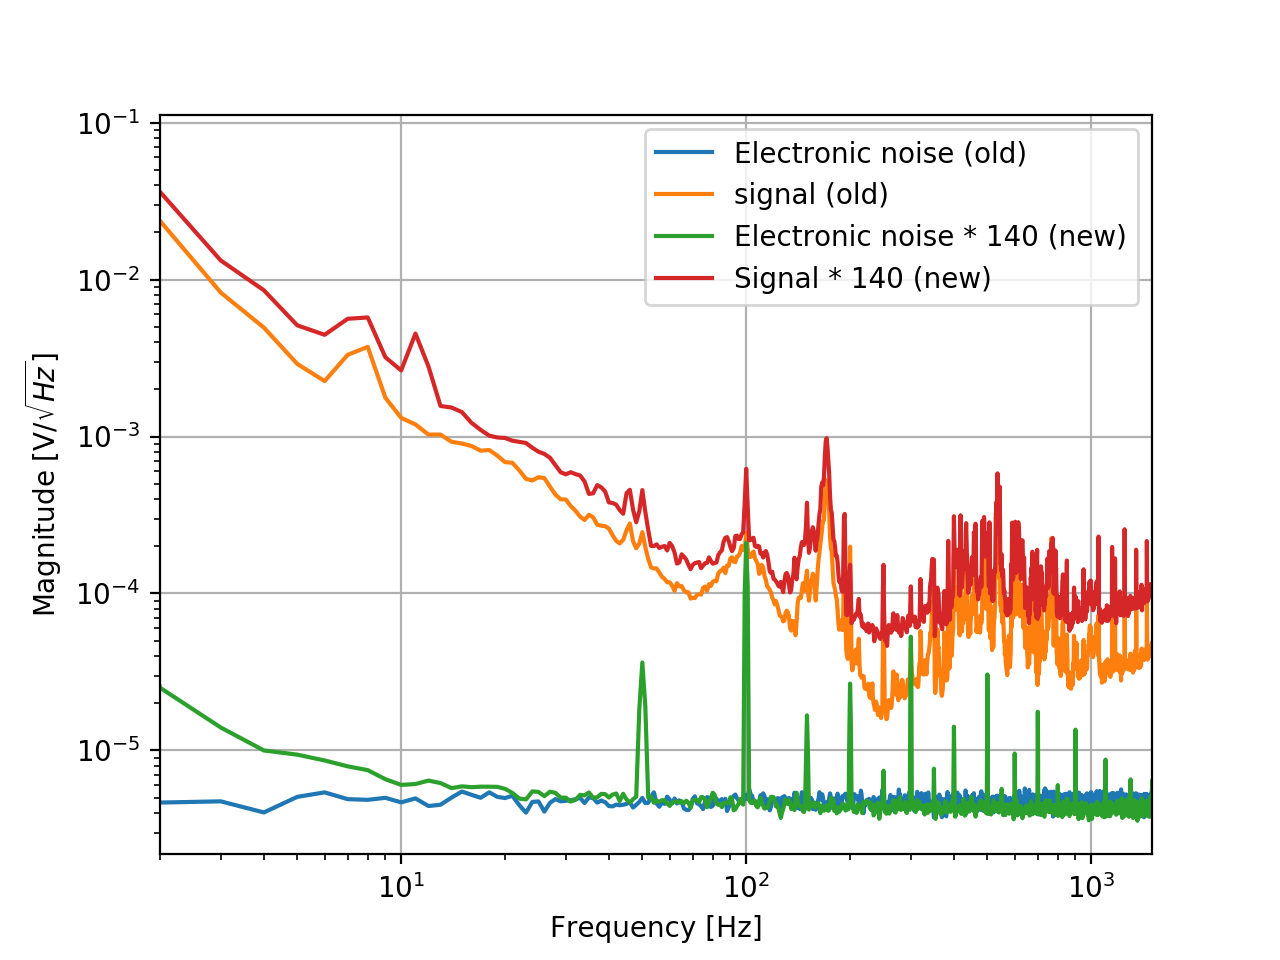
With the filter cavity aligned, I checked the newly modified TAMA PD signal to noise ratio.
According to elog 2414, the modified TAMA PD should have SNR 5 times better than the old design.
I measured PD noise when there was no light incident on these two PDs. The noise is mainly electronic noise at this moment. I also measured the signal with 40mW green power and a 50:50 BS pick-off mirror. To compare SNR easily, I multiply newly modified PD both signal and noise by a factor of 140. This makes both PDs electronic noise overlap.
As shown in the attached figure, the signal from the modified PD is larger than the old PD. SNR is roughly a factor of 2 larger (low frequency ~1.7, high frequency ~2.3). This measurement result is not consistent with 5 times SNR increase.
That sounds very good!
So it means that you have already the required beam-size (in IR), right?
The red-laser, however, seems to be a little small...
Anyway, do you plan to do a reference-sample measurement?
Marc, Yuhang
Today we check the centering of the ir beam from M0 to M3 (see fig 1 of entry 2452) and added an iris just after M0.
It means that we now have several references to check the ir alignment injection inside the FC :
1) FI aperture after the OPO
2) new iris after M0
3) targets on PR window
We are still not sure about the reason of this misalignment (even though the ir injection inside the FC has not been checked during several weeks where 2 earthquakes & opening of the PR & BS chambers happened...).
But if it happens again, we can use these 3 references to try to find the reason.
We locked the p-pol PLL to 160 MHz to have ~7mW of ir power incident on PR chamber.
Then, we moved M2 and M3 to recover the ir beam on the PR window target. As explained in entry 2453, we used this time the weaker ir beam.
Then, we decided to move the dichroic mirror (SM2) picomotor.
We tried to use several references :
1) camera looking at an ir sensor card on the ir reflection of the FC on the squeezing bench
2) camera looking at the 2 " mirror inside BS chamber.
3) 2 cameras looking at the FC targets
1) was useful to get back the beam on PR targets (even though we found out later on that the beam was not the reflection of FC)
2) was useful when moving SM2 picomotors.
After several motions using the Labview vi where we couldn't see changes on 2), we used the joystick.
We could see the beam hitting the edge of the 2" mirror.
After a rough centering (we also had to move slightly in yaw) we could get the beam on the FC 1st target.
We locked FC with green to insure a proper position of BS and unlocked it. We superposed green and ir on this target and then on the 2nd one by cutting alternatively green or ir.
We could finally locked back both green and ir (see fig 1).
As a reference, fig 2 and 3 shows the camera looking at the 2" mirror with green respectively on and off.
Marc and Yuhang
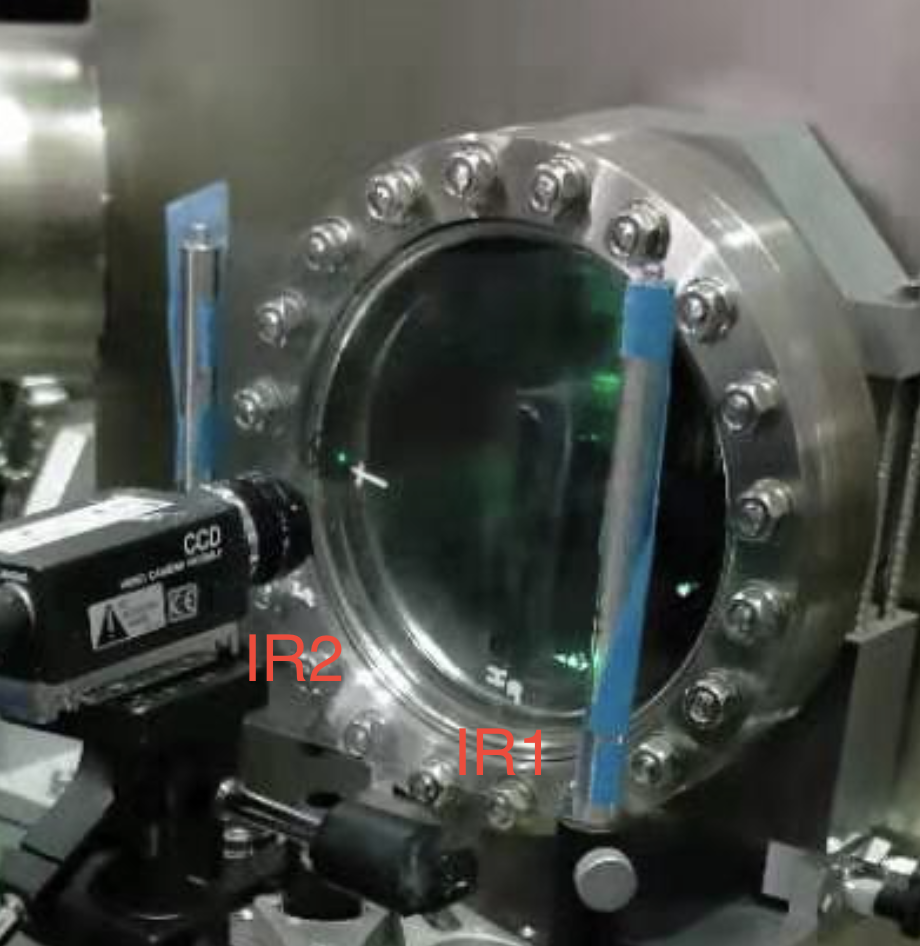
Before recover BAB to filter cavity, we checked again M0 to M3, we tried to make BAB roughly centered on mirrors M0 to M3.
Then we tried to recover reference points on PR chamber. As attached photo 1, we noticed the reference points IR1 can be either weak or bright depending on the tilt of incident beam. Especially, when a weak IR light hits on IR1, the light on IR2 can be closer to the reference point.
Therefore, we think we should make a weak light hit on IR1 while a brighter light hit on IR2, which should be the good reference.
Marc, Yuhang
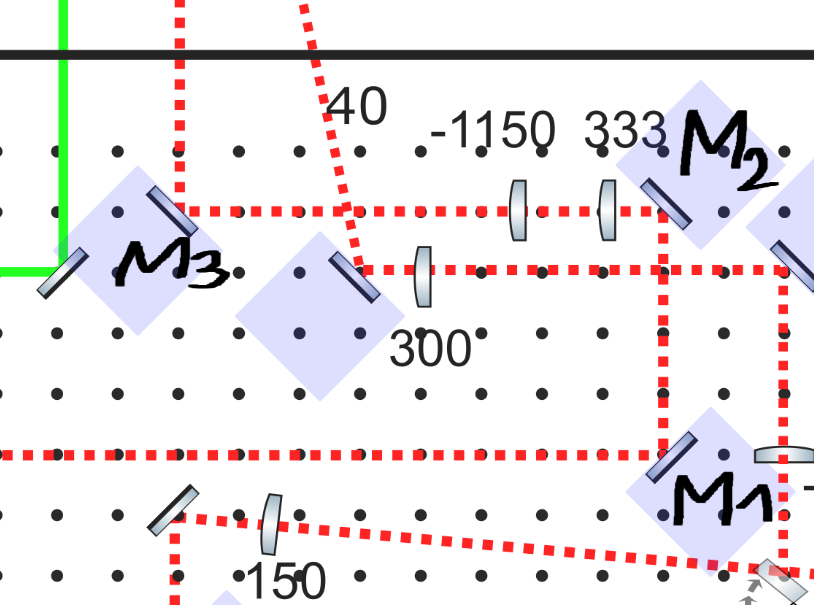
Today we continued the ir alignment started yesterday.
Based on the labeled presented in figure 1, we could see that the beam was misaligned horizontally on M2, the 2 following lenses and M3.
We acted on M1 to recenter the beam there.
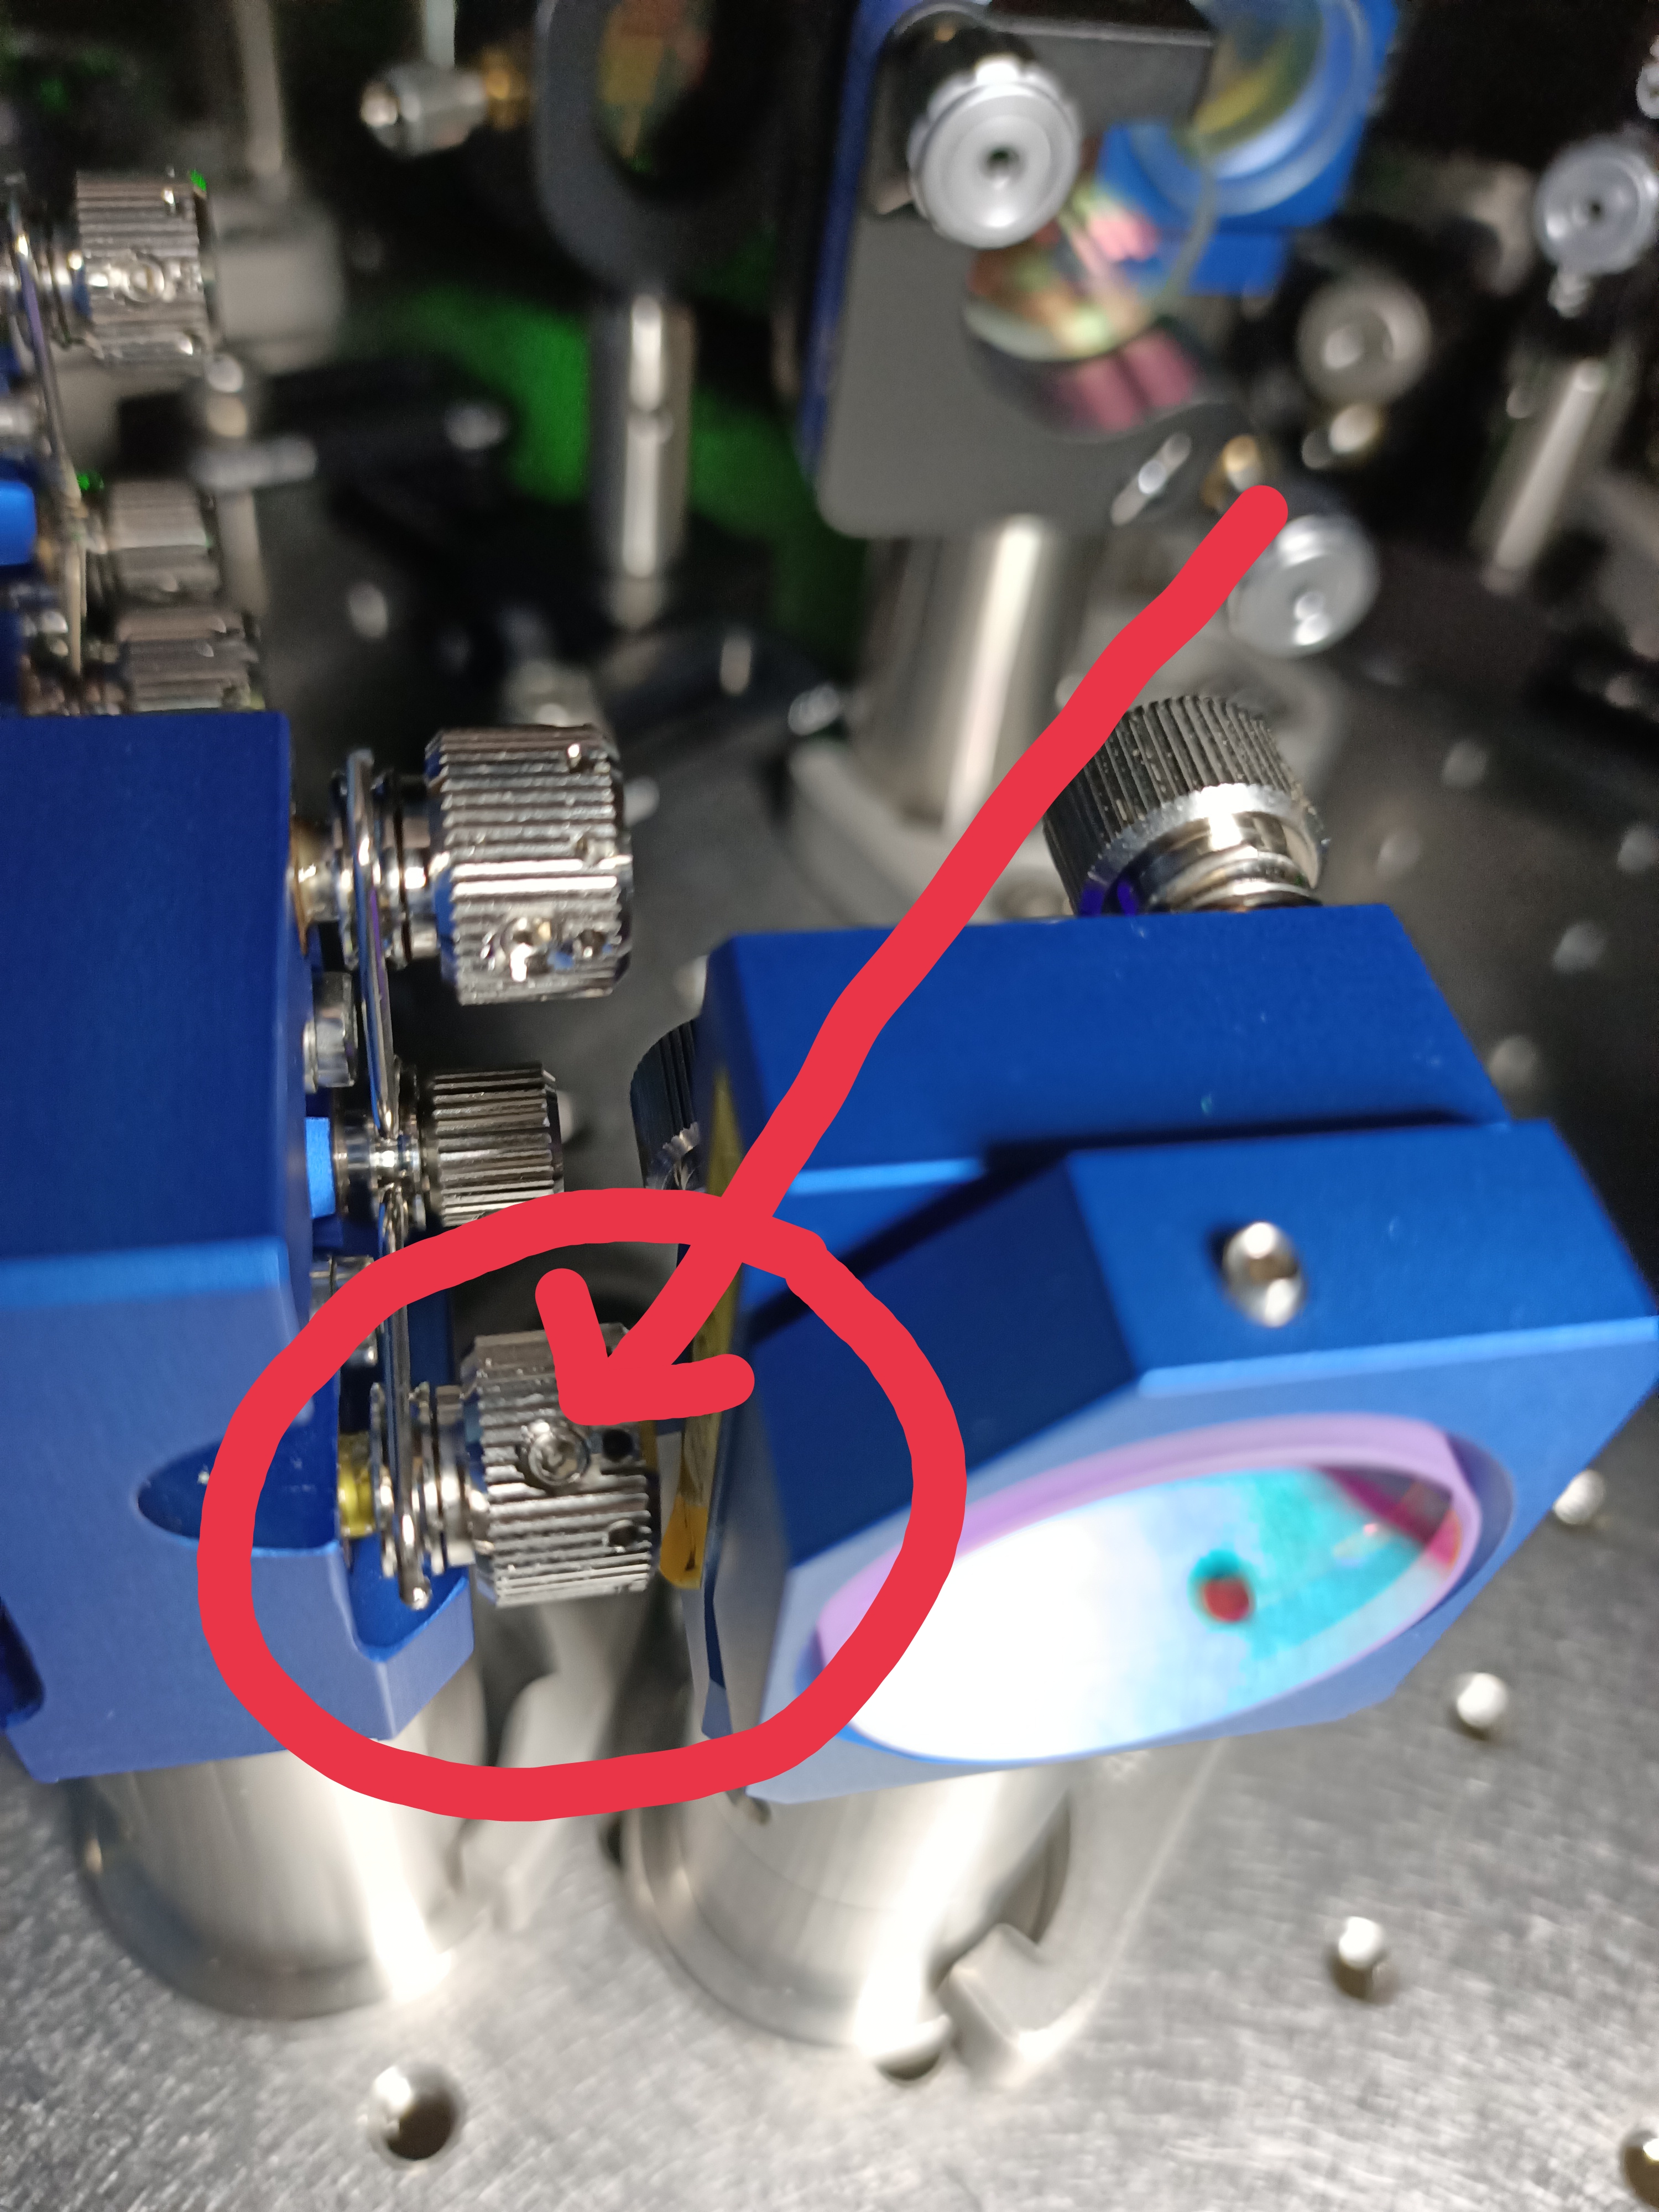
Then, we wanted to recover the beam on the target outside PR chamber by acting on M3.
Even tough I only moved slightly the horizontal screw, it might have been too much as it became easily loose.
As a reminder M3 is mounted using a holder MM1000s from First Mechanical Design compagny (http://www.1md.co.jp/mm1000_E.php)
To recover this screw, it was needed to tighten another small screw pointed by the red arrow in figure 2.
Realignment is on-going (one reference back on PR chamber)
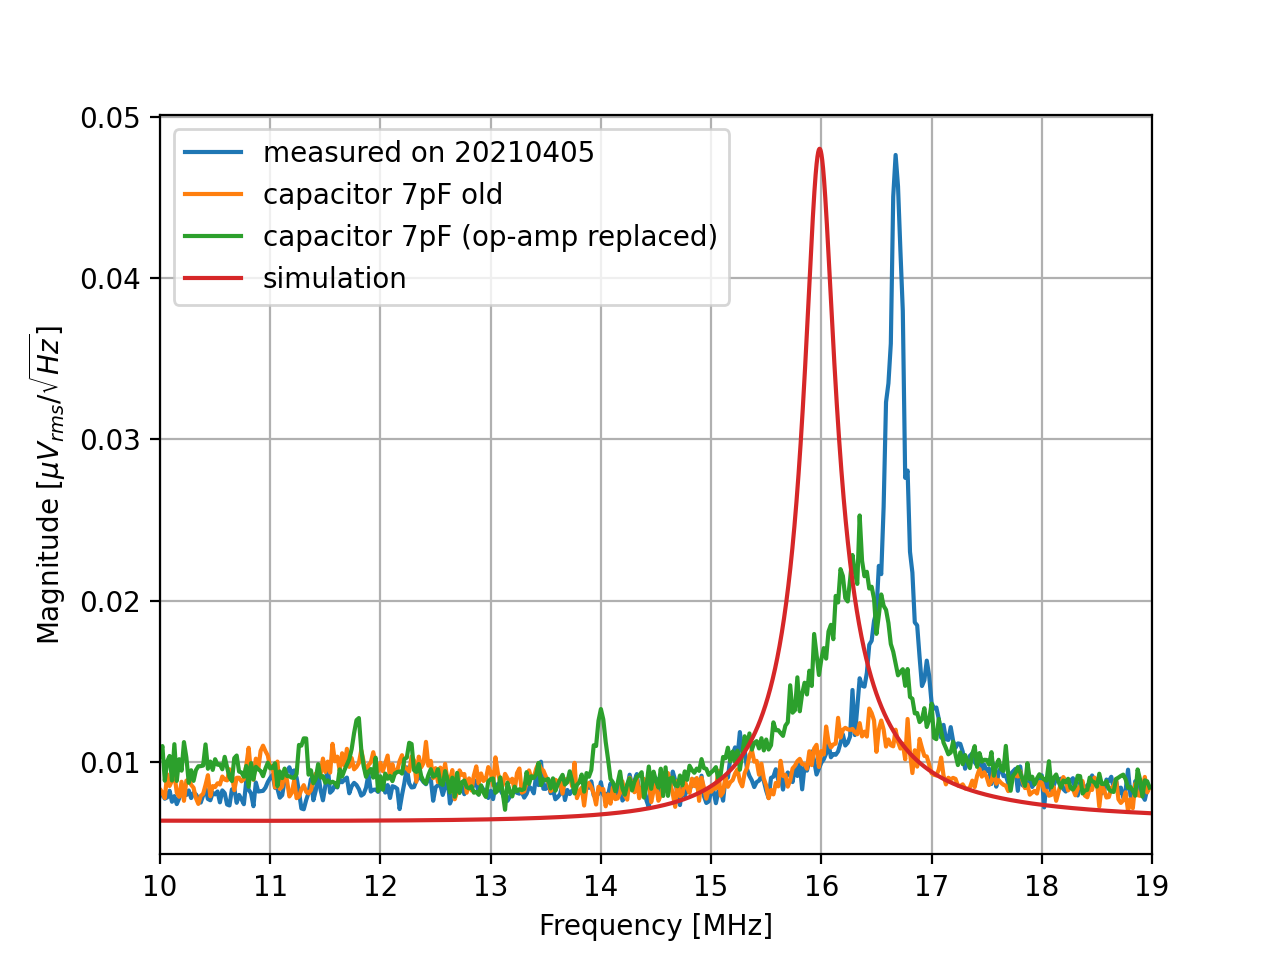
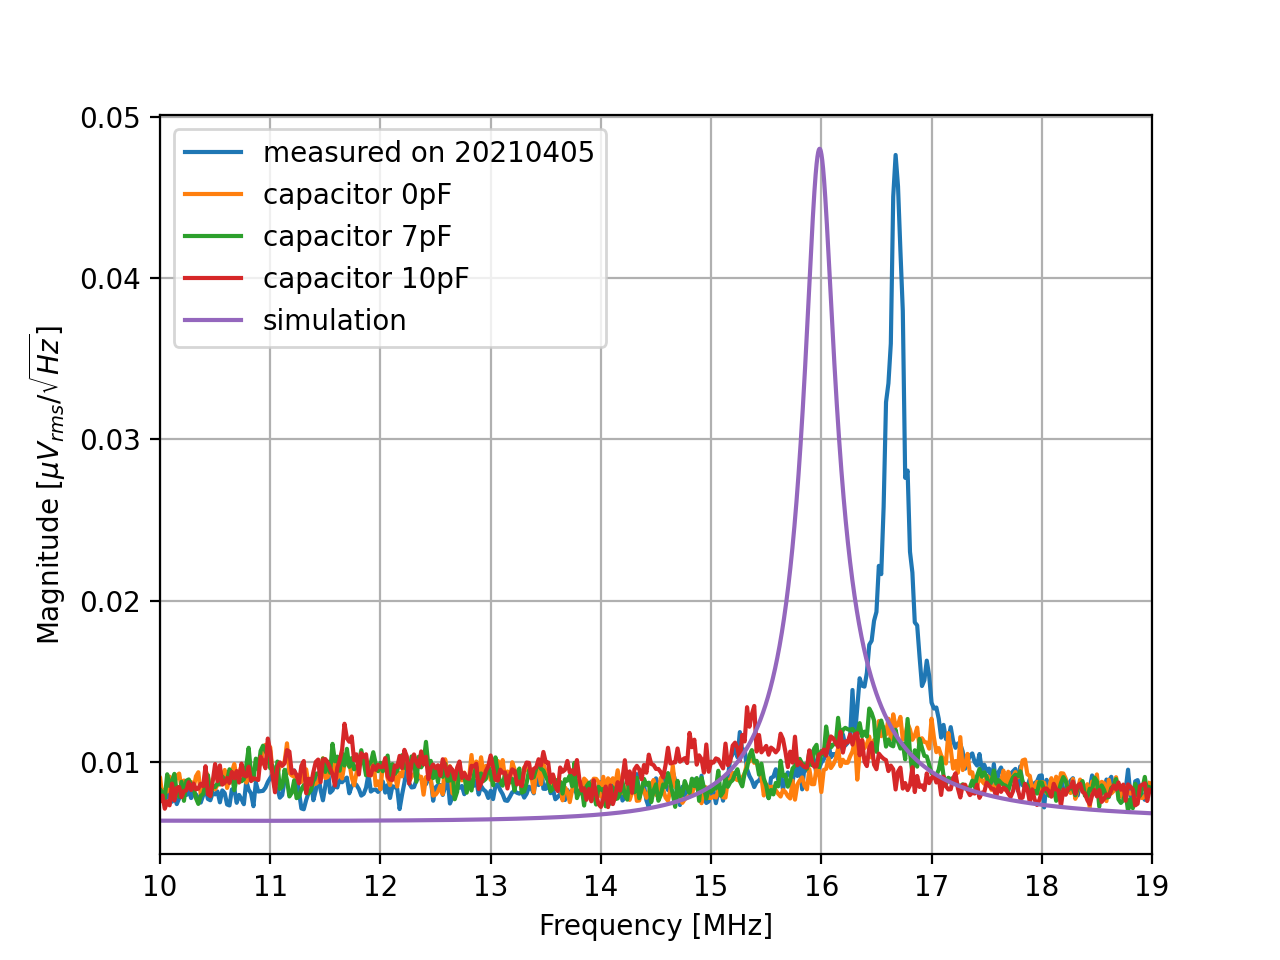
As mentioned in elog2437, Cpp's design value is 160pF while the one in place is 150pF. So I tried to put a capacitor with 7pF and 10pF in parallel with the 150pF Cpp. However, after putting them, I found the noise spectrum has changed from the measurement on 20210405. The noise spectrum measurement is shown in the attached figure.
I will investigate more why this happens. In the worst case, I will solder this circuit again with a new op-amp. Then check if the noise spectrum becomes reasonable.
[Aritomi, Abe, Marc]
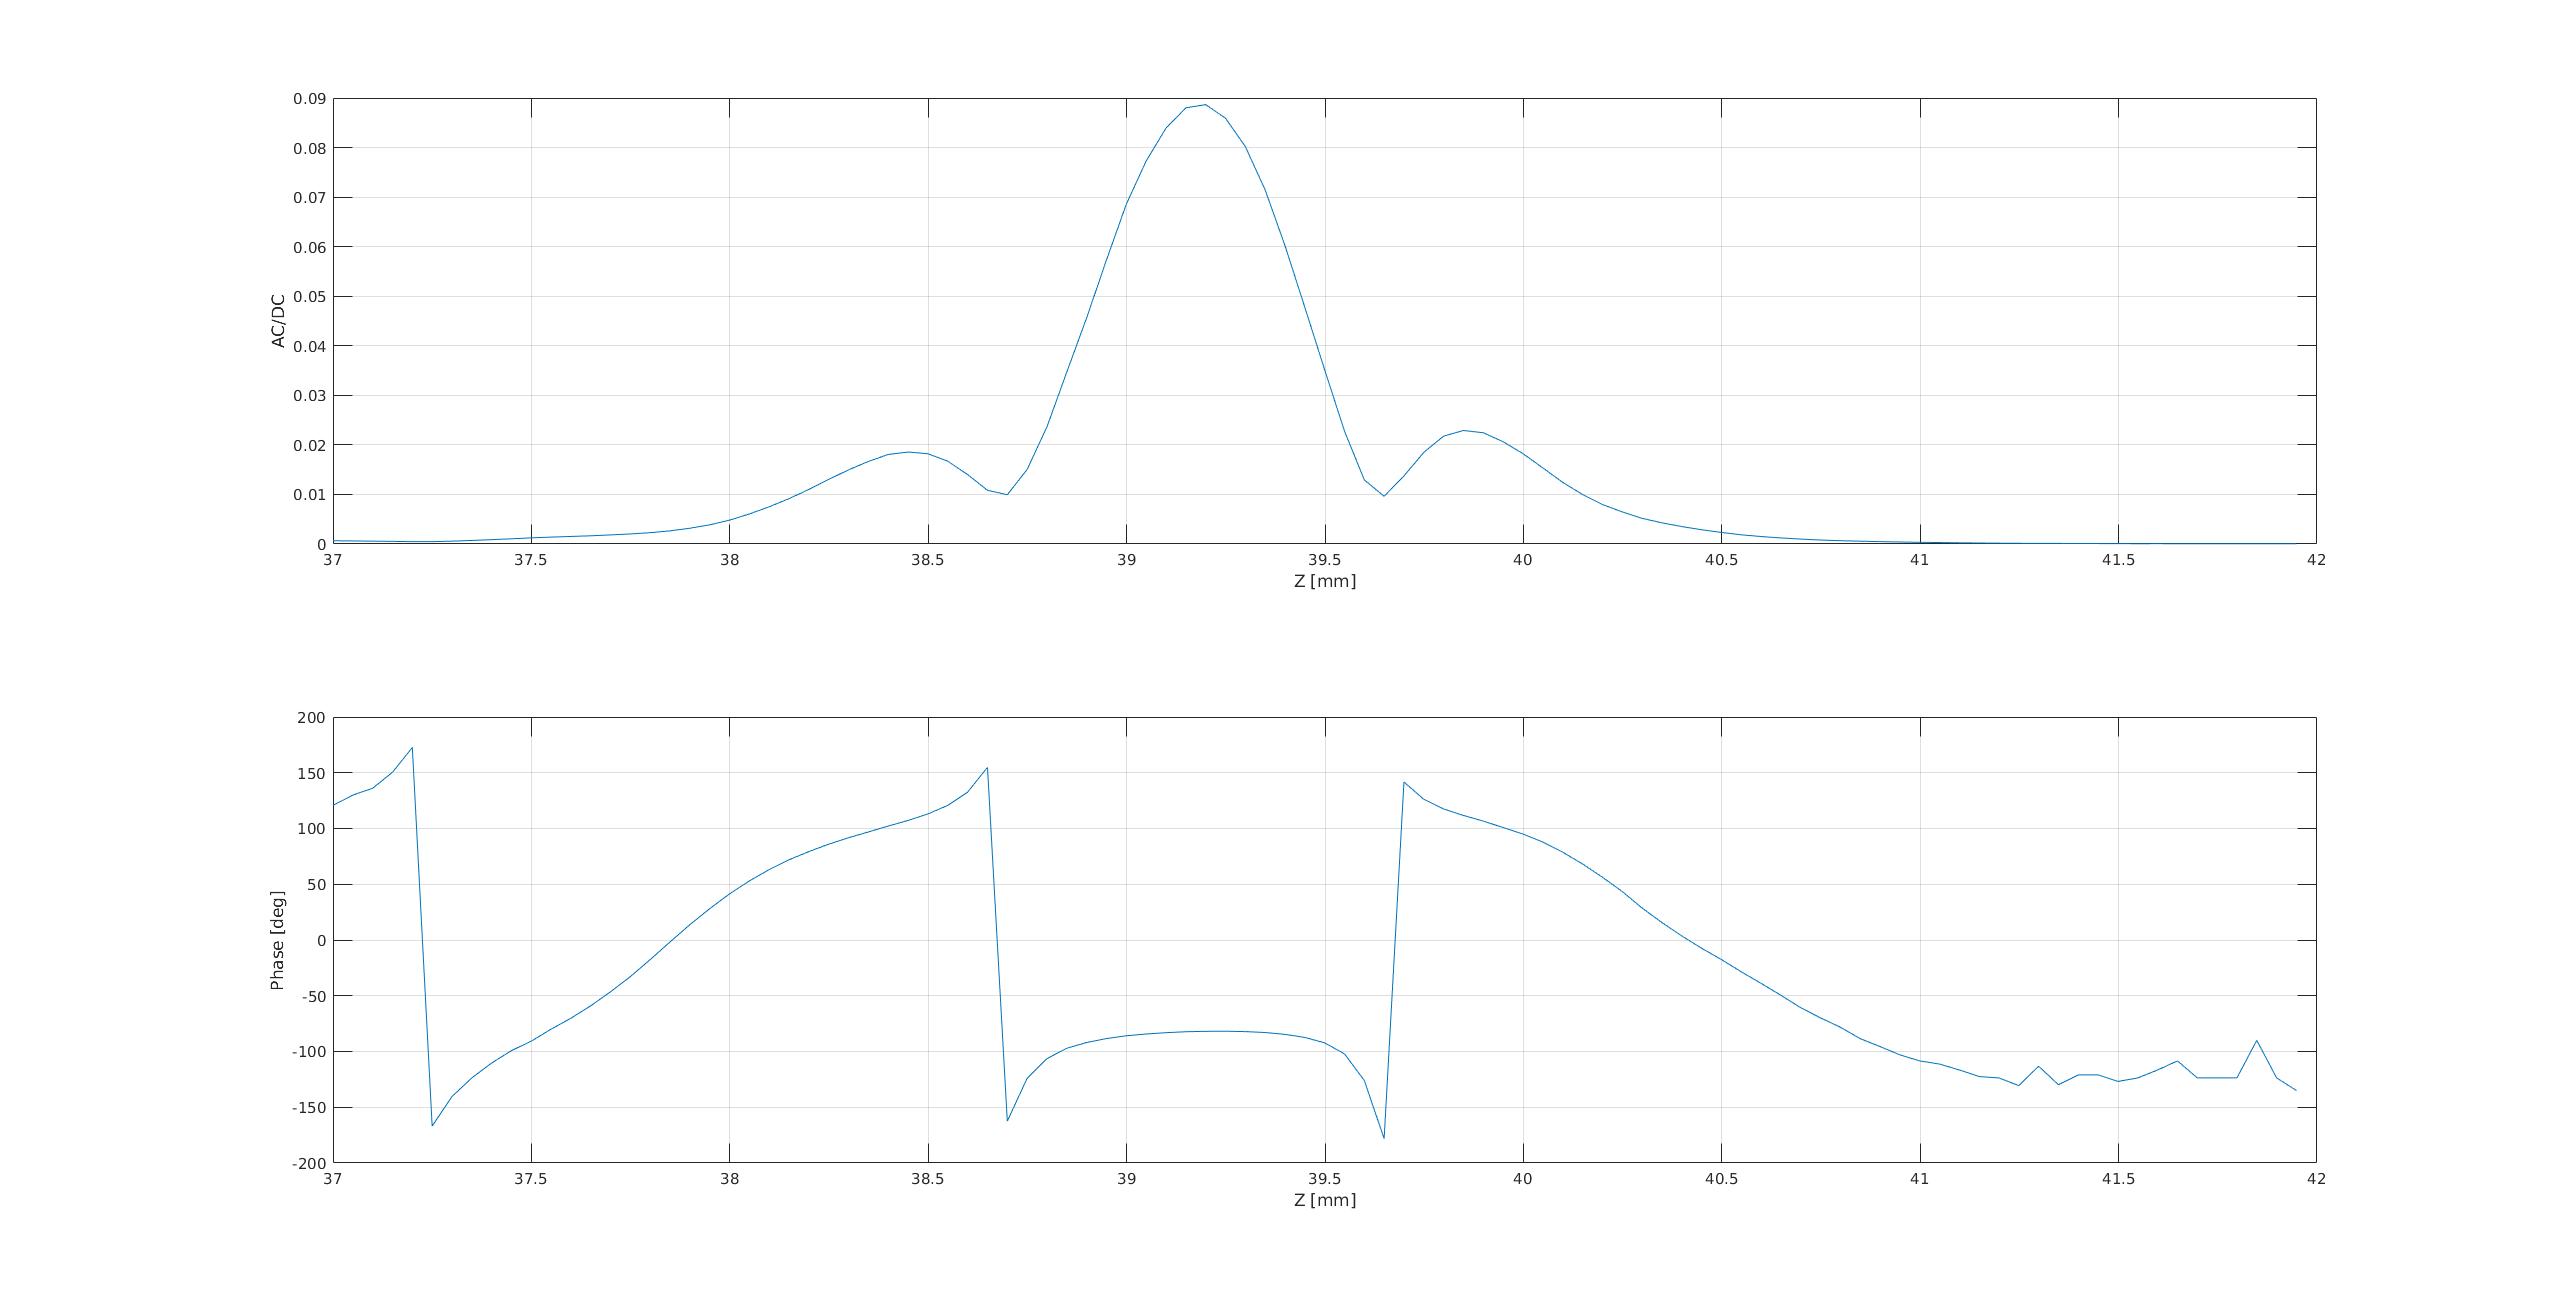
We did knife edge measurement of IR and red beams with a knife at the edge of the 2'' holder towards the imaging unit.
Fitting result is as follows:
IR : waist size = 40.8 um at z = 30.6 mm
red : waist size = 52.8 um at z = 39.8 mm
Note that Z in this plot is raw data and thickness of 2'' inch holder is not considered. The fitting for red doesn't match the data very well.
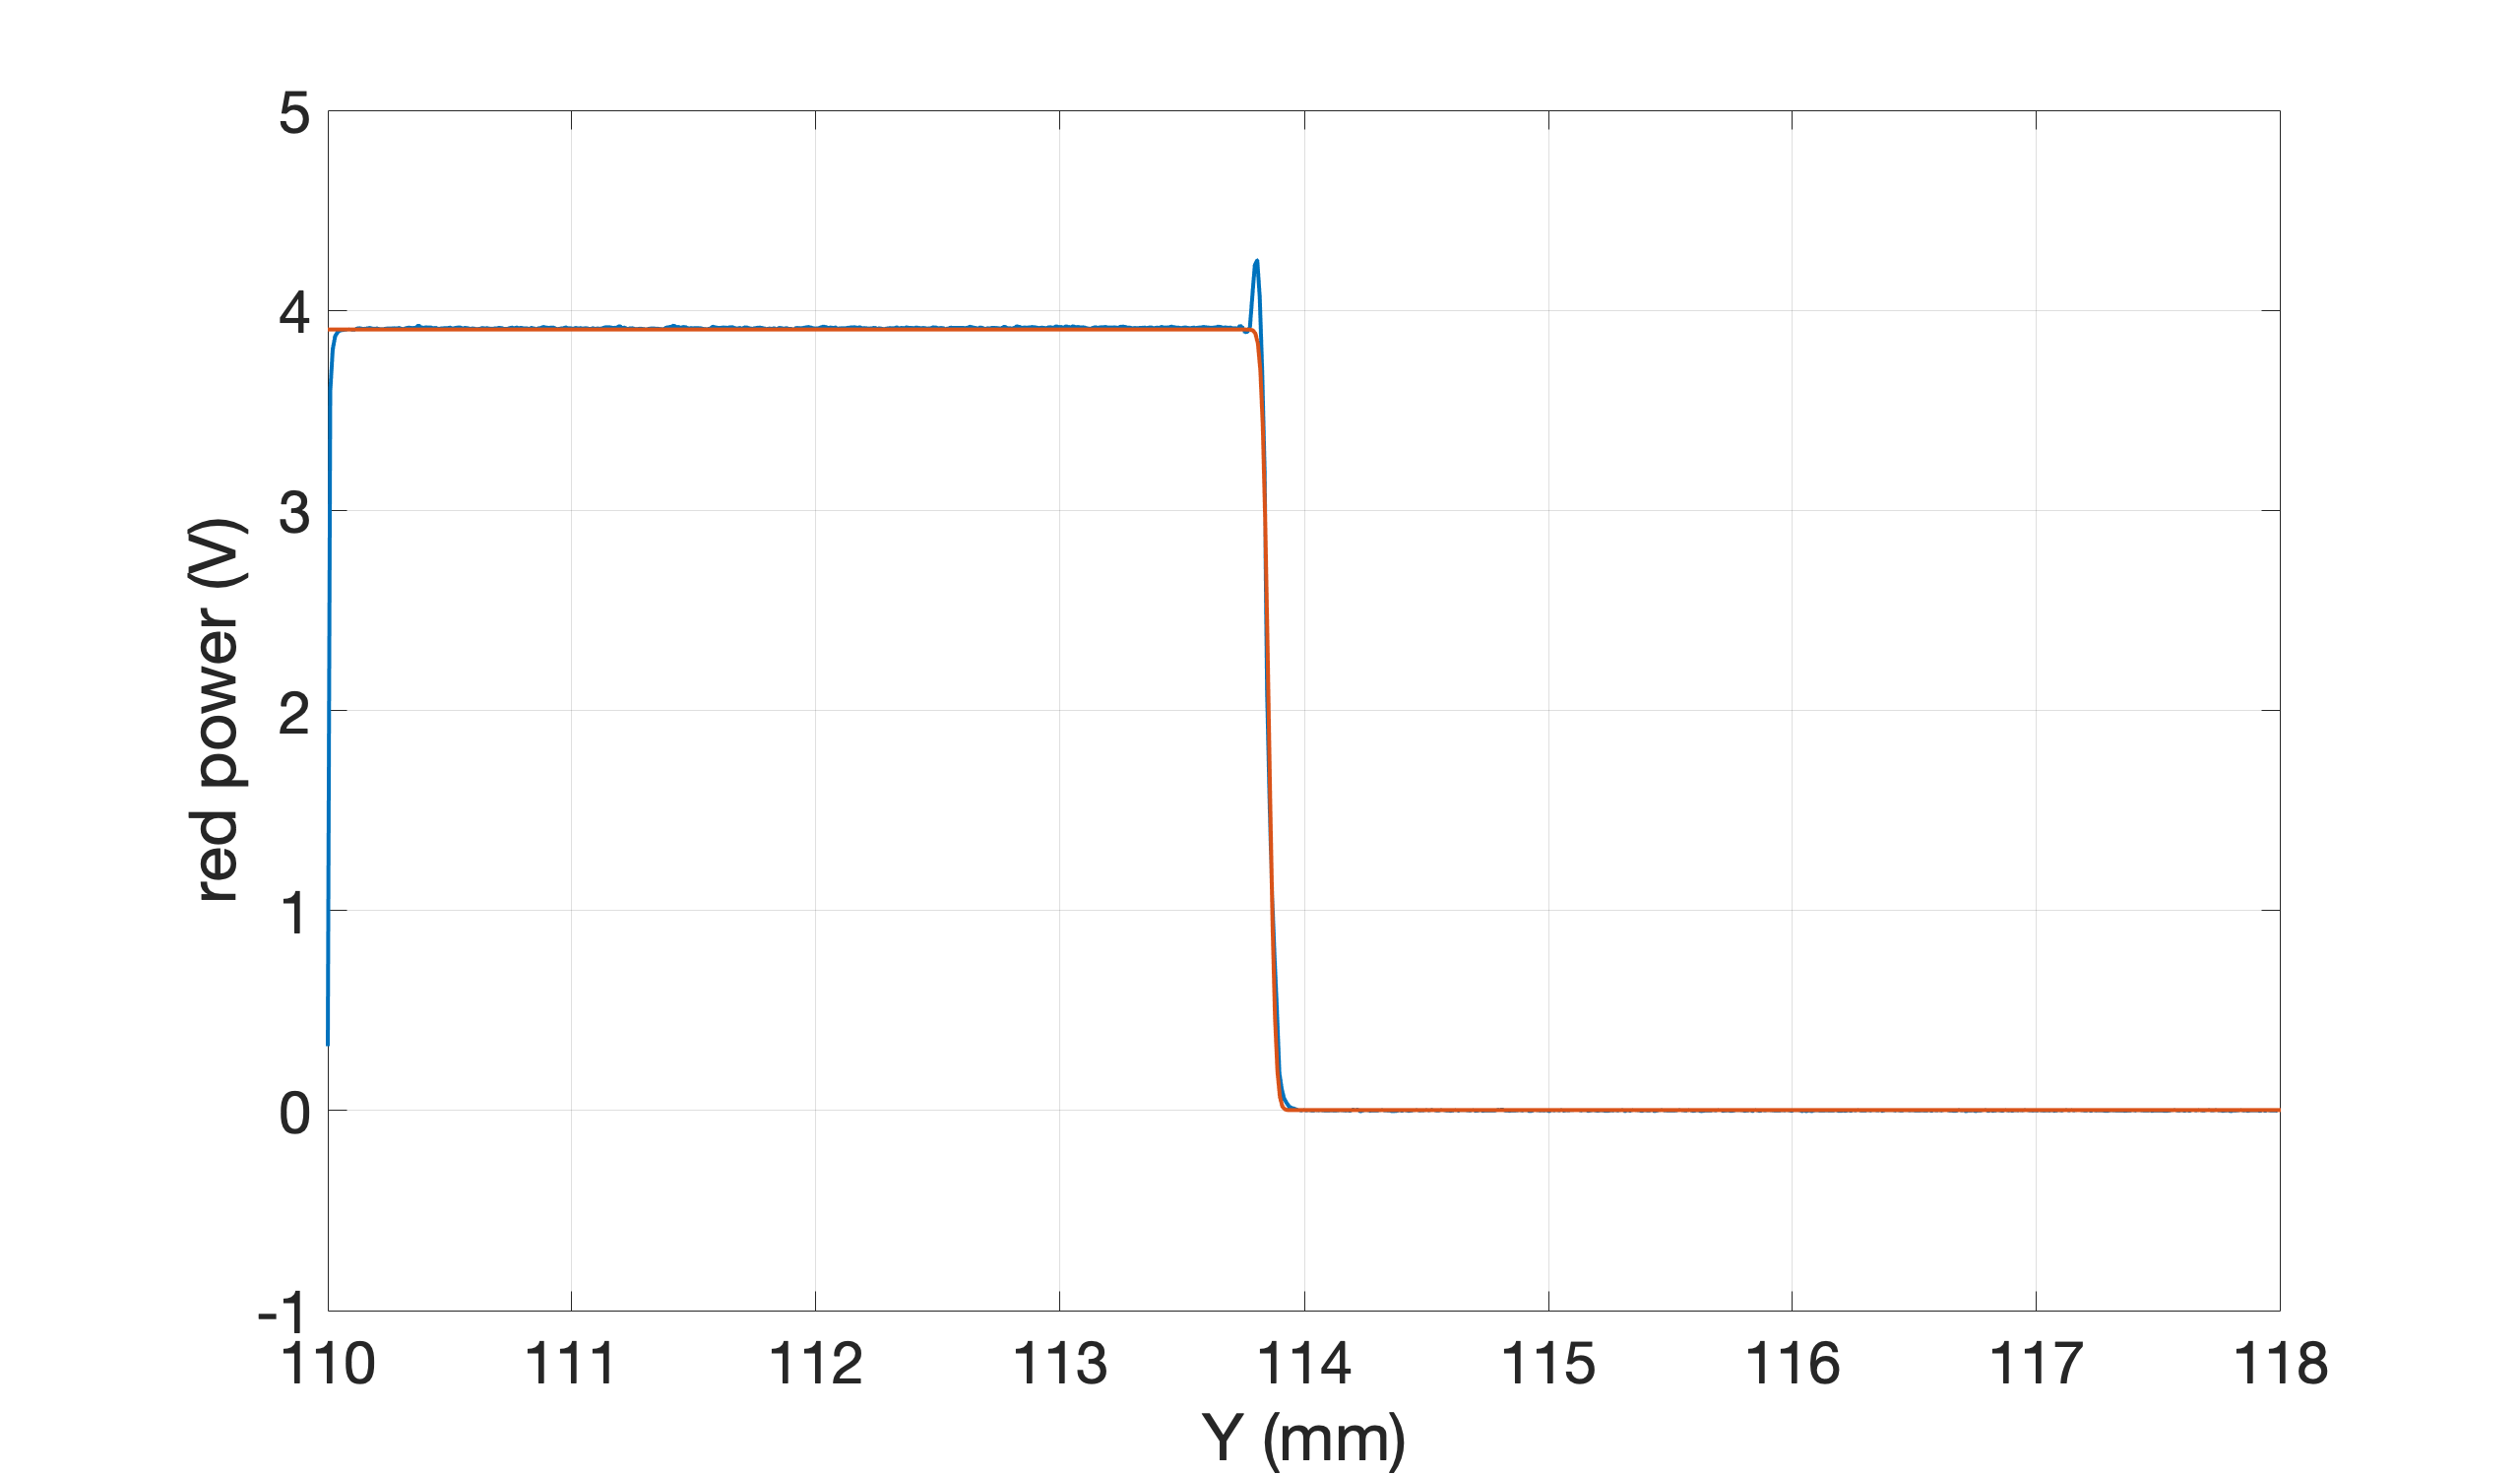
Second figure is an example of knife edge measurement of red in Y direction at Z = 44 mm. There is a peak when the knife starts to cut the beam and this may underestimate the red beam radius.
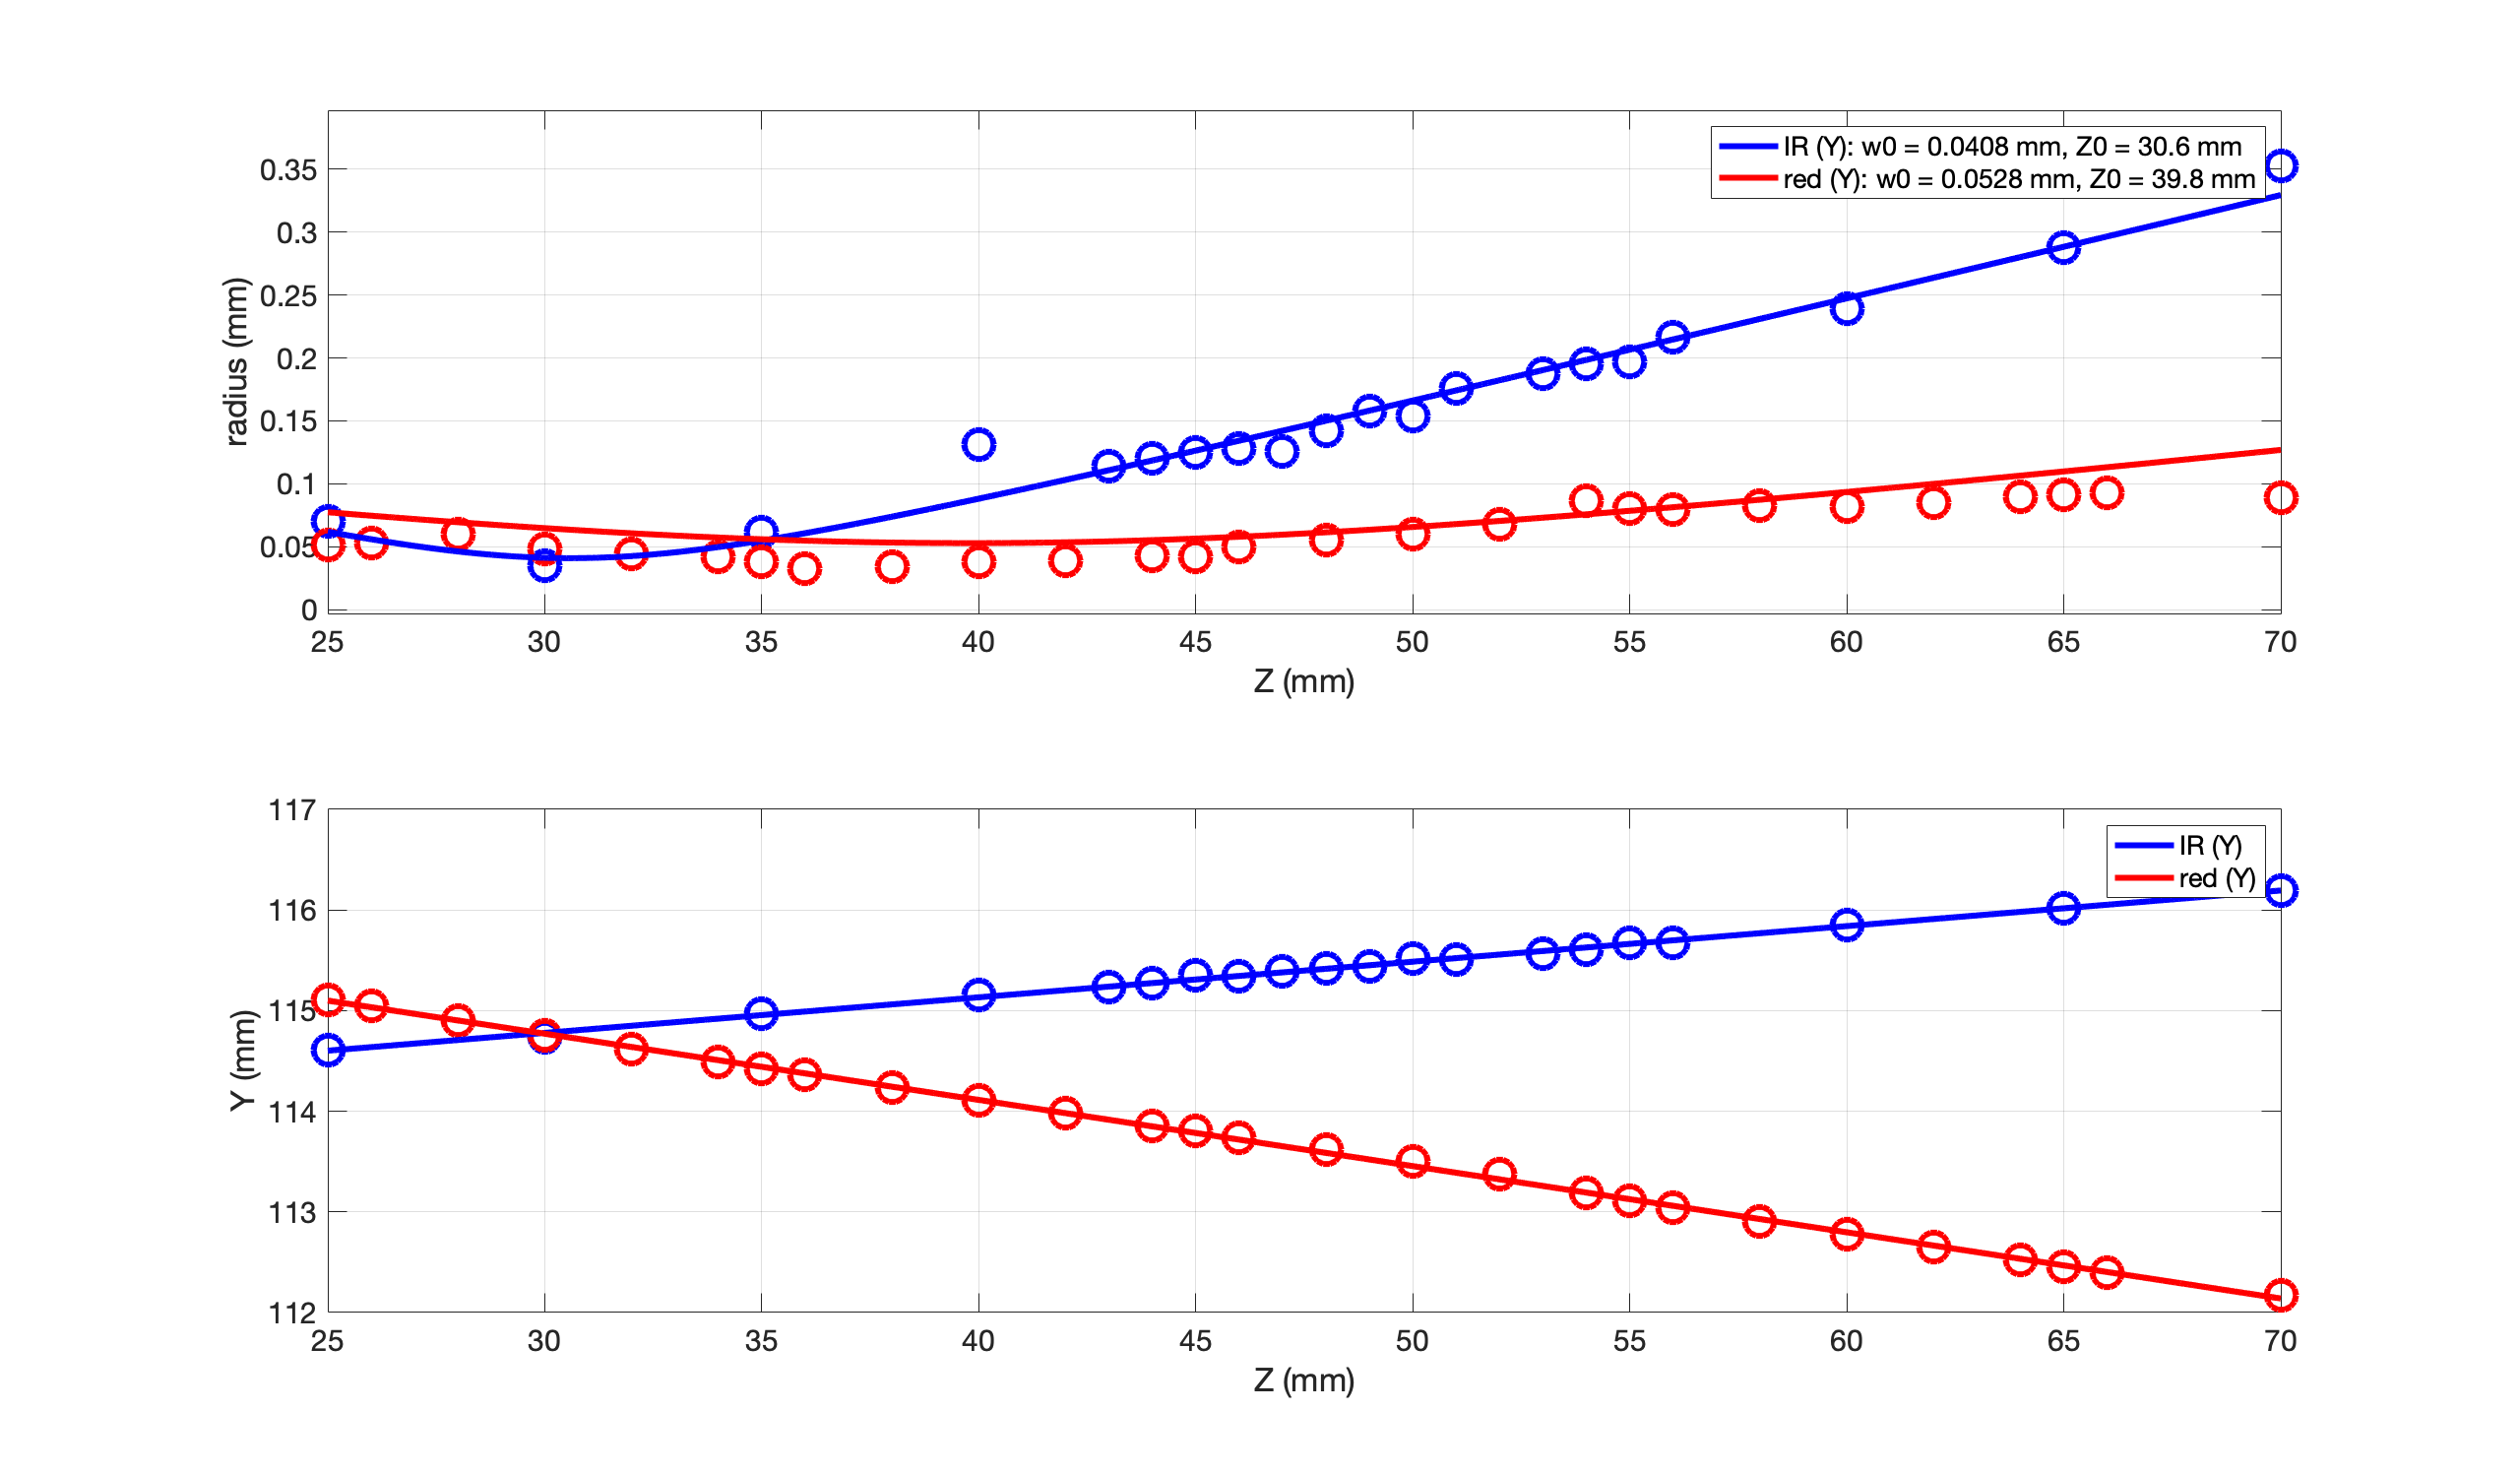
Also note that because we didn't take many points around ir waist position and with quite large step size (0.05mm), the ir beam parameters might also not be so reliable in this configuration.
Michael and Yuhang
We have reported that BAB was misaligned for filter cavity.
To increase BAB power, we are amplifying BAB with OPA. The pump phase is scanned with frequency around 100Hz and amplitude of 1V signal sent to high voltage driver.
At the beginning, we were trying to find where the IR beam was located by using camera. Then we found we can see from camera but the position where IR beam hits is not clear and depends on where we put camera. Also we tried to use IR viewer to find IR inside PR chamber, it didn't work either. So we can use camera to check, but this is not really helpful.
On the other hand, we should rely on the reference points outside the PR chamber window. We found we could easily recover the IR beam for these reference points. However, we found reflection was extremly weak (less than 1%).
To maximize IR reflection, we followed the method we used three years ago. We put a sensor card in reflection and set up a camera to monitor the beam on sensor card (attached photo 1 is setup, attached photo 2 is image from camera). By doing alignment with two mirrors, we found reflection power cannot be increased a lot. In addition, after this alignment, we made IR go away from reference points. We also made IR hits almost the edge of last bench mirror. This means we are not going to the good direction.
So the starting point, where IR beams hit on both reference points, should be quite close to good injection. If we can rely on this, the only problem we are having should be inside vacuum chamber. The IR mirror equipped with picomotor before GR/IR overlap is the dichroic mirror. Actually this is the place where IR and GR overlaps, but the tilting of this mirror doesn't affect GR. So we think we should do like this.
1. Align the last two steering mirrors on bench to hit on PR chamber IR references as good as possible.
2. Move yaw of dichroic mirror while checking the first target inside arm and reflection together.
3. In the end, we should see: (1)IR/GR overlap on the arm first target (2)reflection power increase while reflection reaching nominal position
Before measuring FIS in elog, we found OPO is misaligned for p-pol, CC and BAB beams. To check FDS, we injected BAB into vacuum chamber. However, we could find this BAB in FC reflection or in the first target on PR chamber.
We will check the first target in arm, also check inside PR chamber with camera soon.
Marc, Yuhang
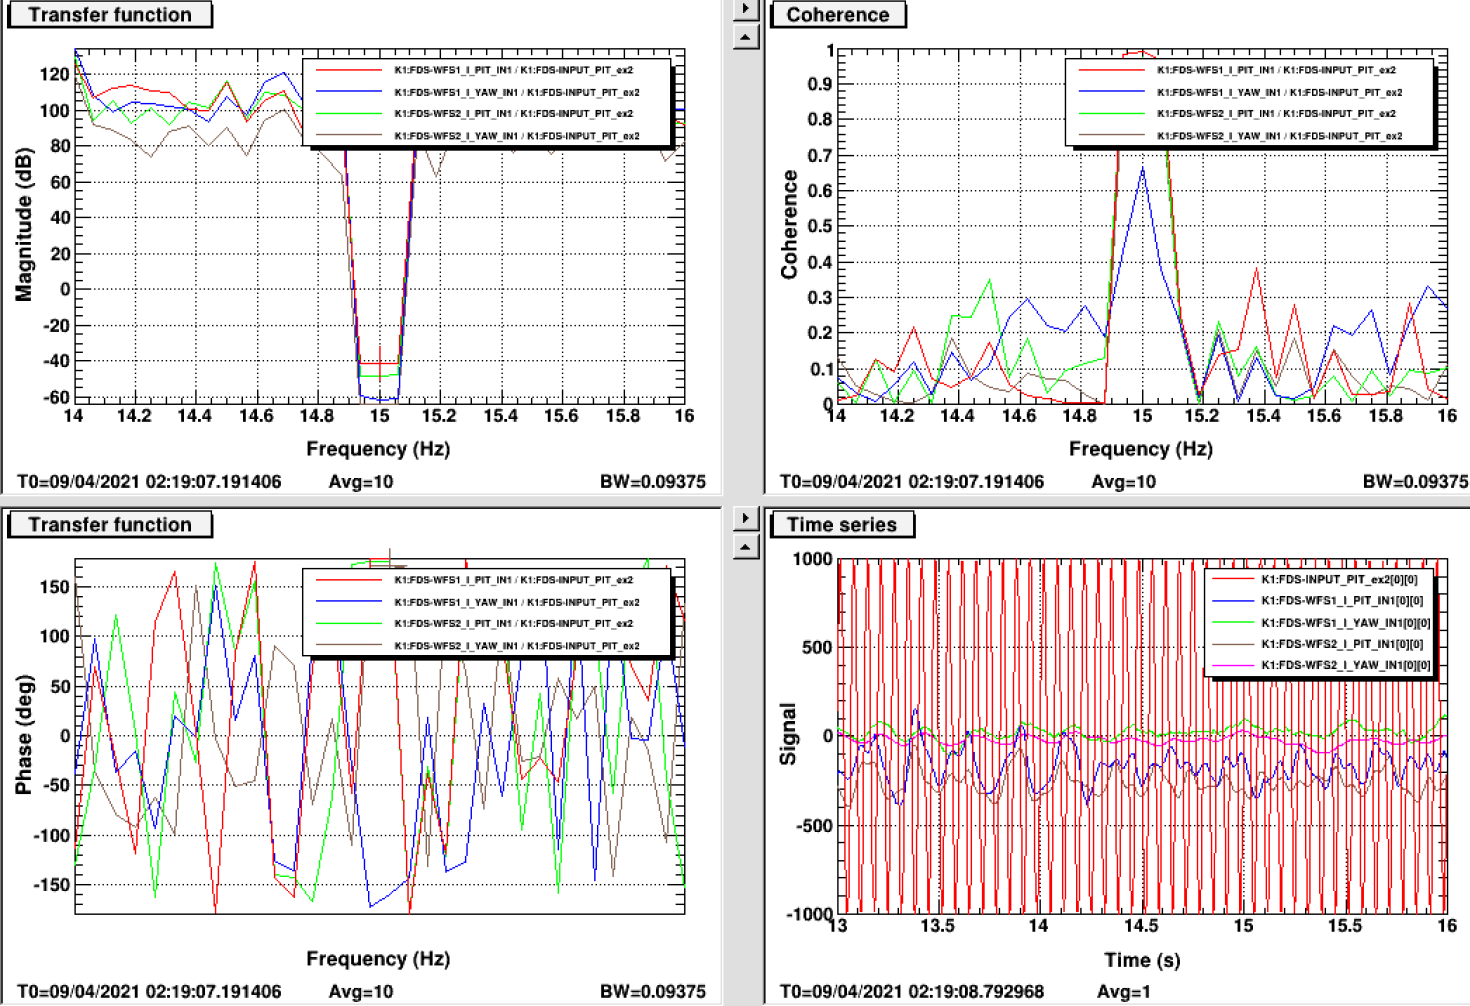
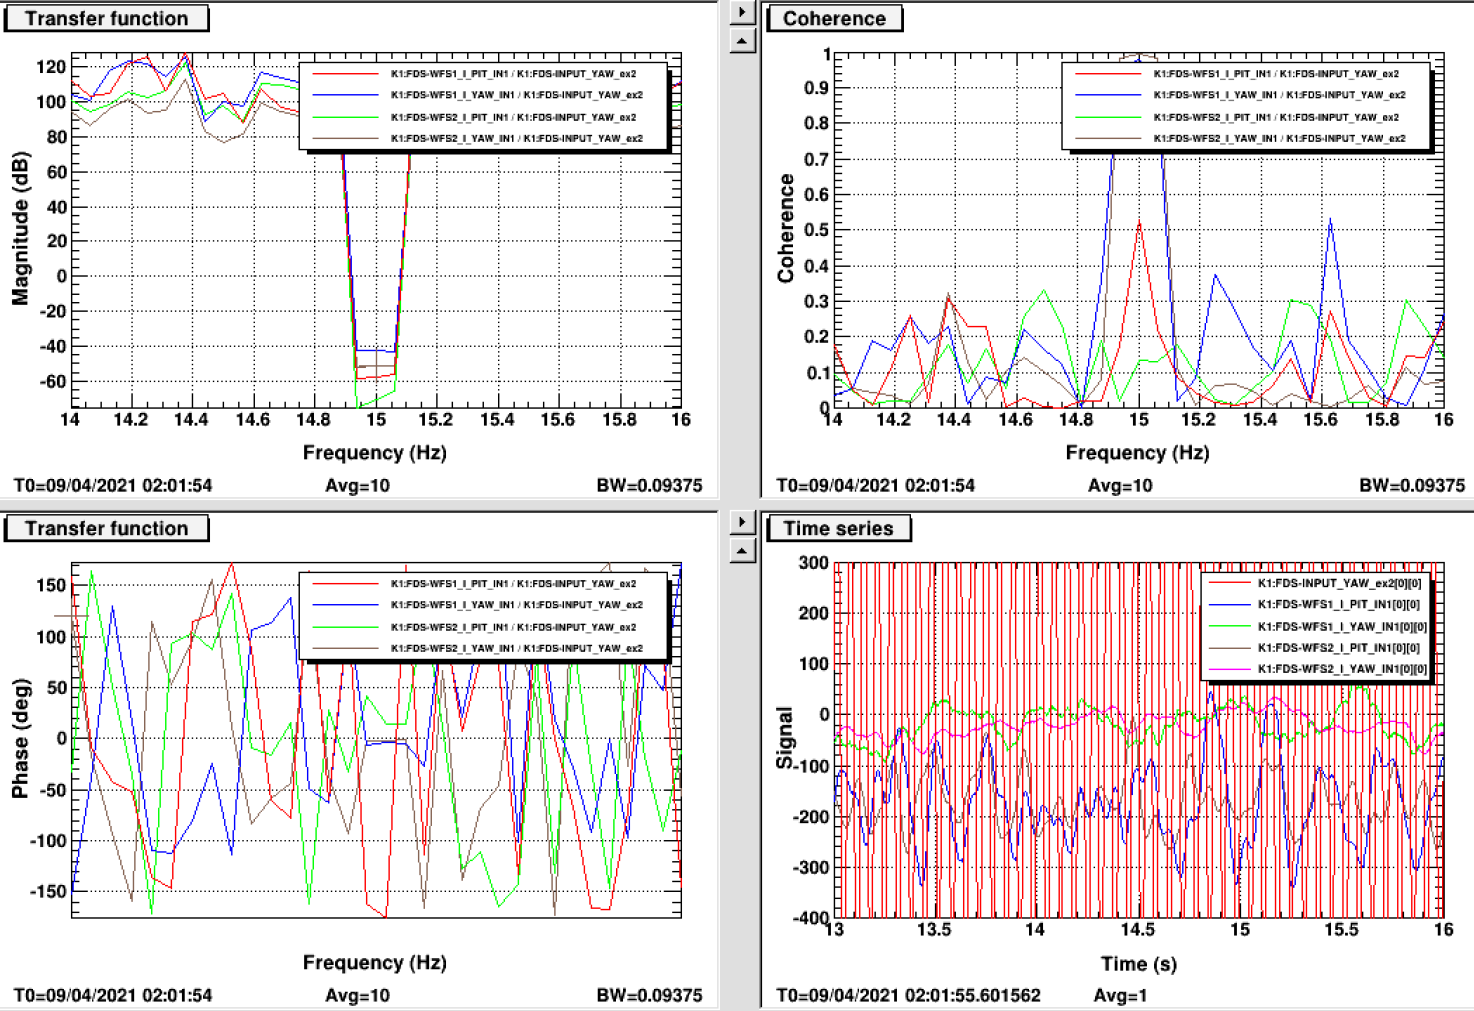
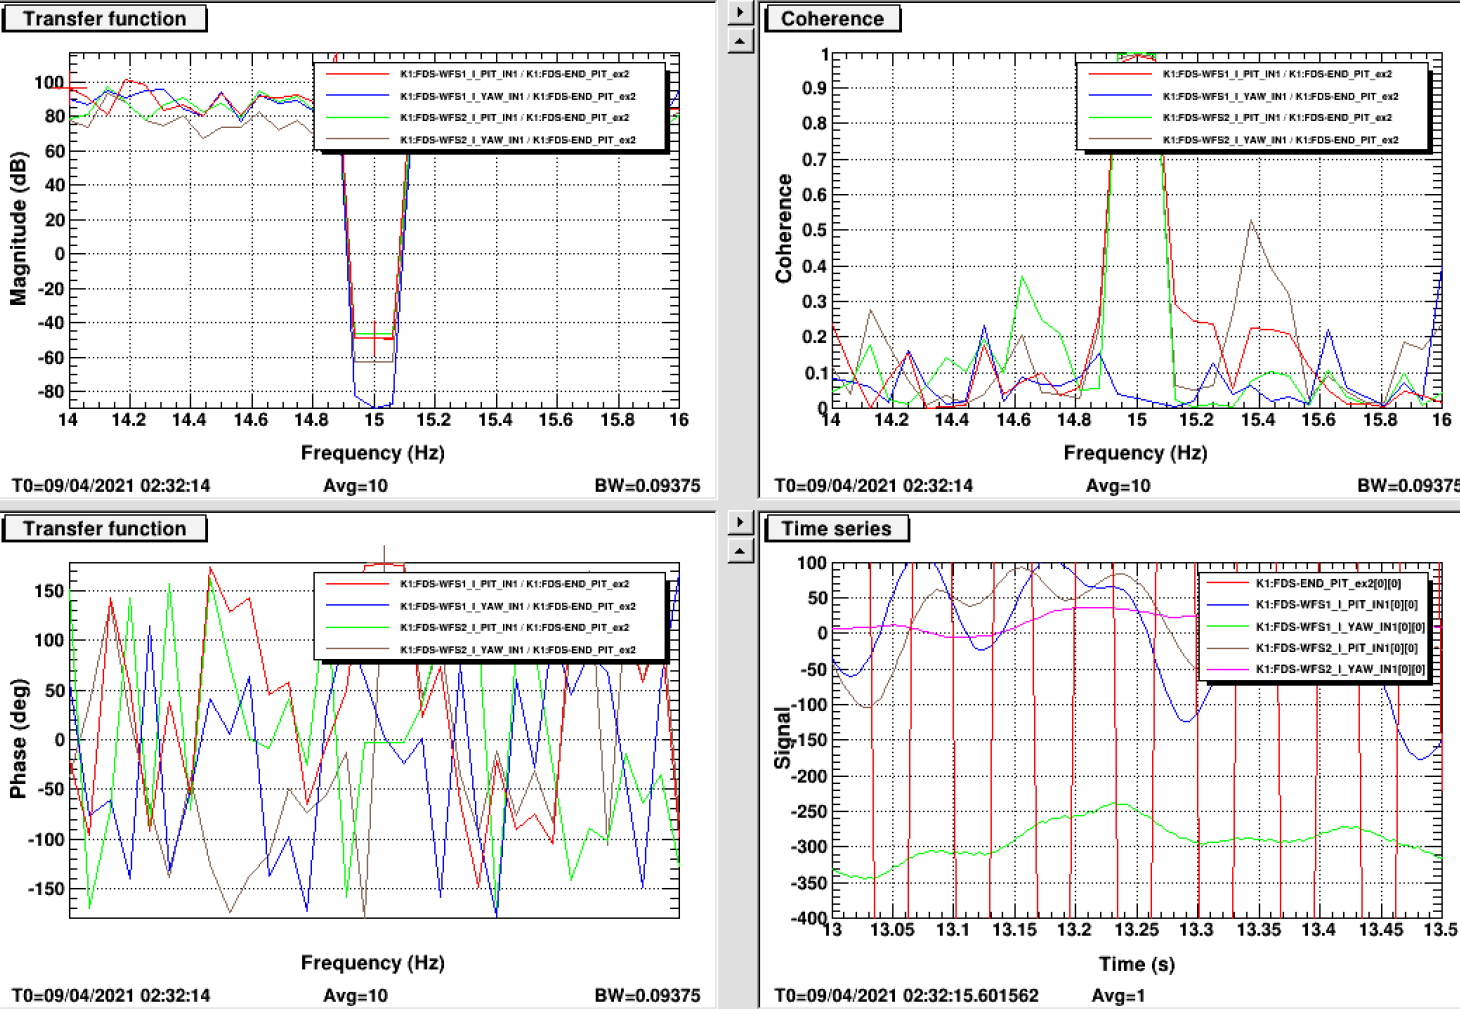
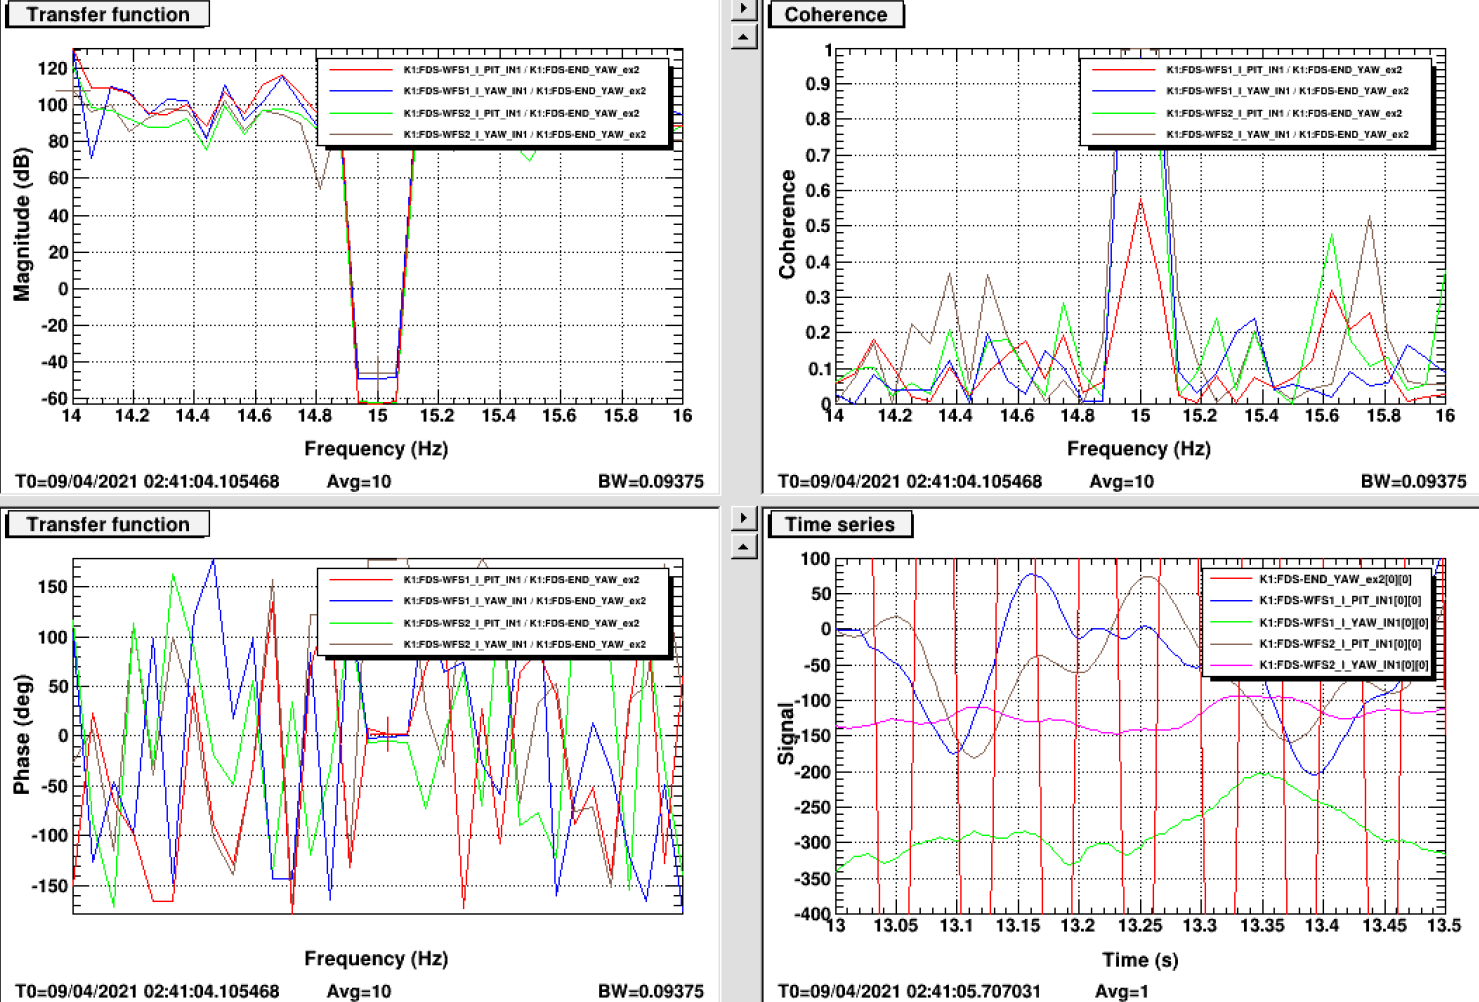
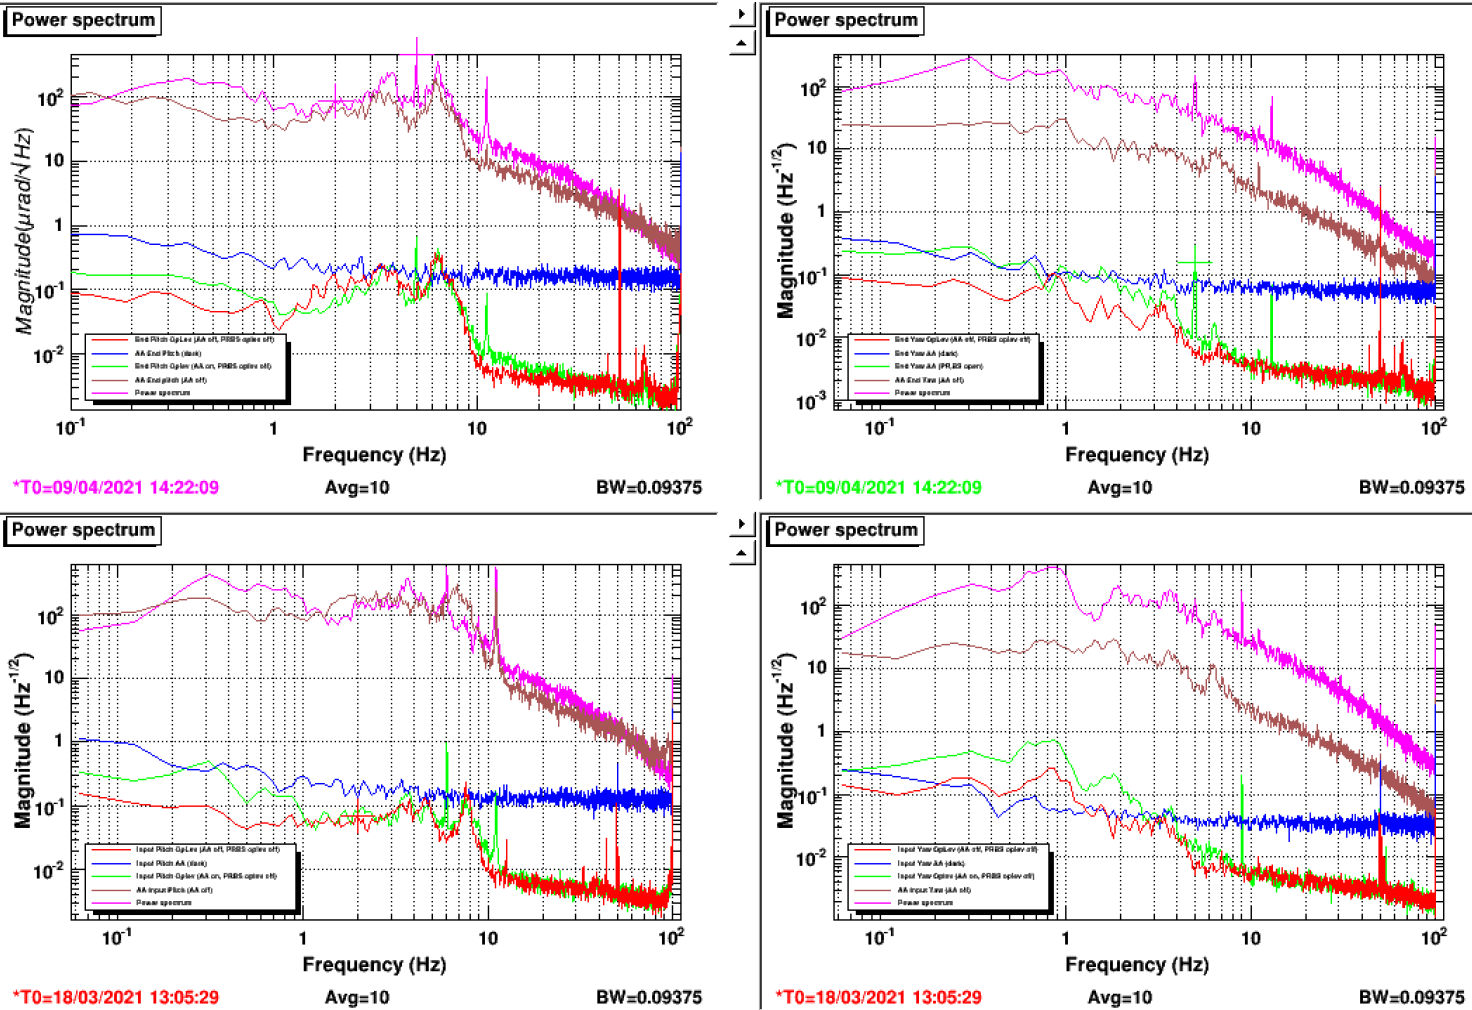
The past trials to measure the AA sensing matrix taking into account possible coupling between pitch and yaw of both input and end mirrors were all based on injecting 2 Hz lines on each degree of freedom (dof).
This gave us strange results, especially visible in the TF phase between each excitation and sensing QPDs (ie far from +/-180 or 0 degrees).
As suggested by Raffaele in last FC meeting, this could arise because 2Hz is too close to the mechanical resonance of the mirror.
Therefore, we decided to use 15 Hz lines to measure the TFs.
We also tried to measure the demodulation phase between I and Q of each QPD segment using a 15 Hz line but this was not so much conclusive ( the line amplitude might have been too low and also hard to distinguish in the time series from the natural 11 Hz pitch resonance). So we used 2 Hz line to tune this demodulation phases.
They are now :
| segment | QPD1 1 | QPD1 2 | QPD1 3 | QPD1 4 | QPD2 1 | QPD2 2 | QPD2 3 | QPD2 4 |
| phase [deg] | 130 | 120 | 120 | 120 | -10 | 0 | 0 | 0 |
Then we injected a line at 15 Hz on each mirror dof with amplitude 1000 except for end pitch which was 1500 (without particular reason...)
Figure 1 to 4 present the TF magnitude (top left) phase (bottom left), coherence (top right) and time serie (bottom right) for respectively input pitch excitation, input yaw, end pitch and end yaw.
The TFs magnitudes give the sensing matrix absolute value while the phase the sign of each element. We used only TF when the coherence was above ~0.4. From this all phases was +/-180 or 0 deg within less than 10 degrees.
This gave the following driving matrix :
| QPD1 pitch | QPD2 pitch | QPD1 yaw | QPD2 yaw | |
| 8.6 | 6.5 | 0.3 | 2.6 | In pitch |
| 7.1 | -15.2 | 1.2 | -0.6 | End pitch |
| 1.6 | 0 | -10.8 | -7.7 | In yaw |
| -1.4 | 1.4 | -5.5 | 16.6 | End yaw |
Note that the actual sign of the computed matrix is the opposite but we used a negative gain.
Using gain of -0.05 for in and end pitch and -0.05 for in and end yaw we could close the AA loop.
The comparison between the QPD and OpLev signals are presented in figure 5 (pink is live QPD, green is live OpLev).
We can see that there is almost no coupling between the various dof !
However, the AA loop gain needs to be reduced a bit more as we can see that it introduces noise (eg comparing the green with the brown := OpLev reference)