NAOJ GW Elog Logbook 3.2

Aso-san, Marc
The air leakage of the gate valve was indeed due to a loose screw.
Aso-san tighten it more and no more audible sound nor air coming out.
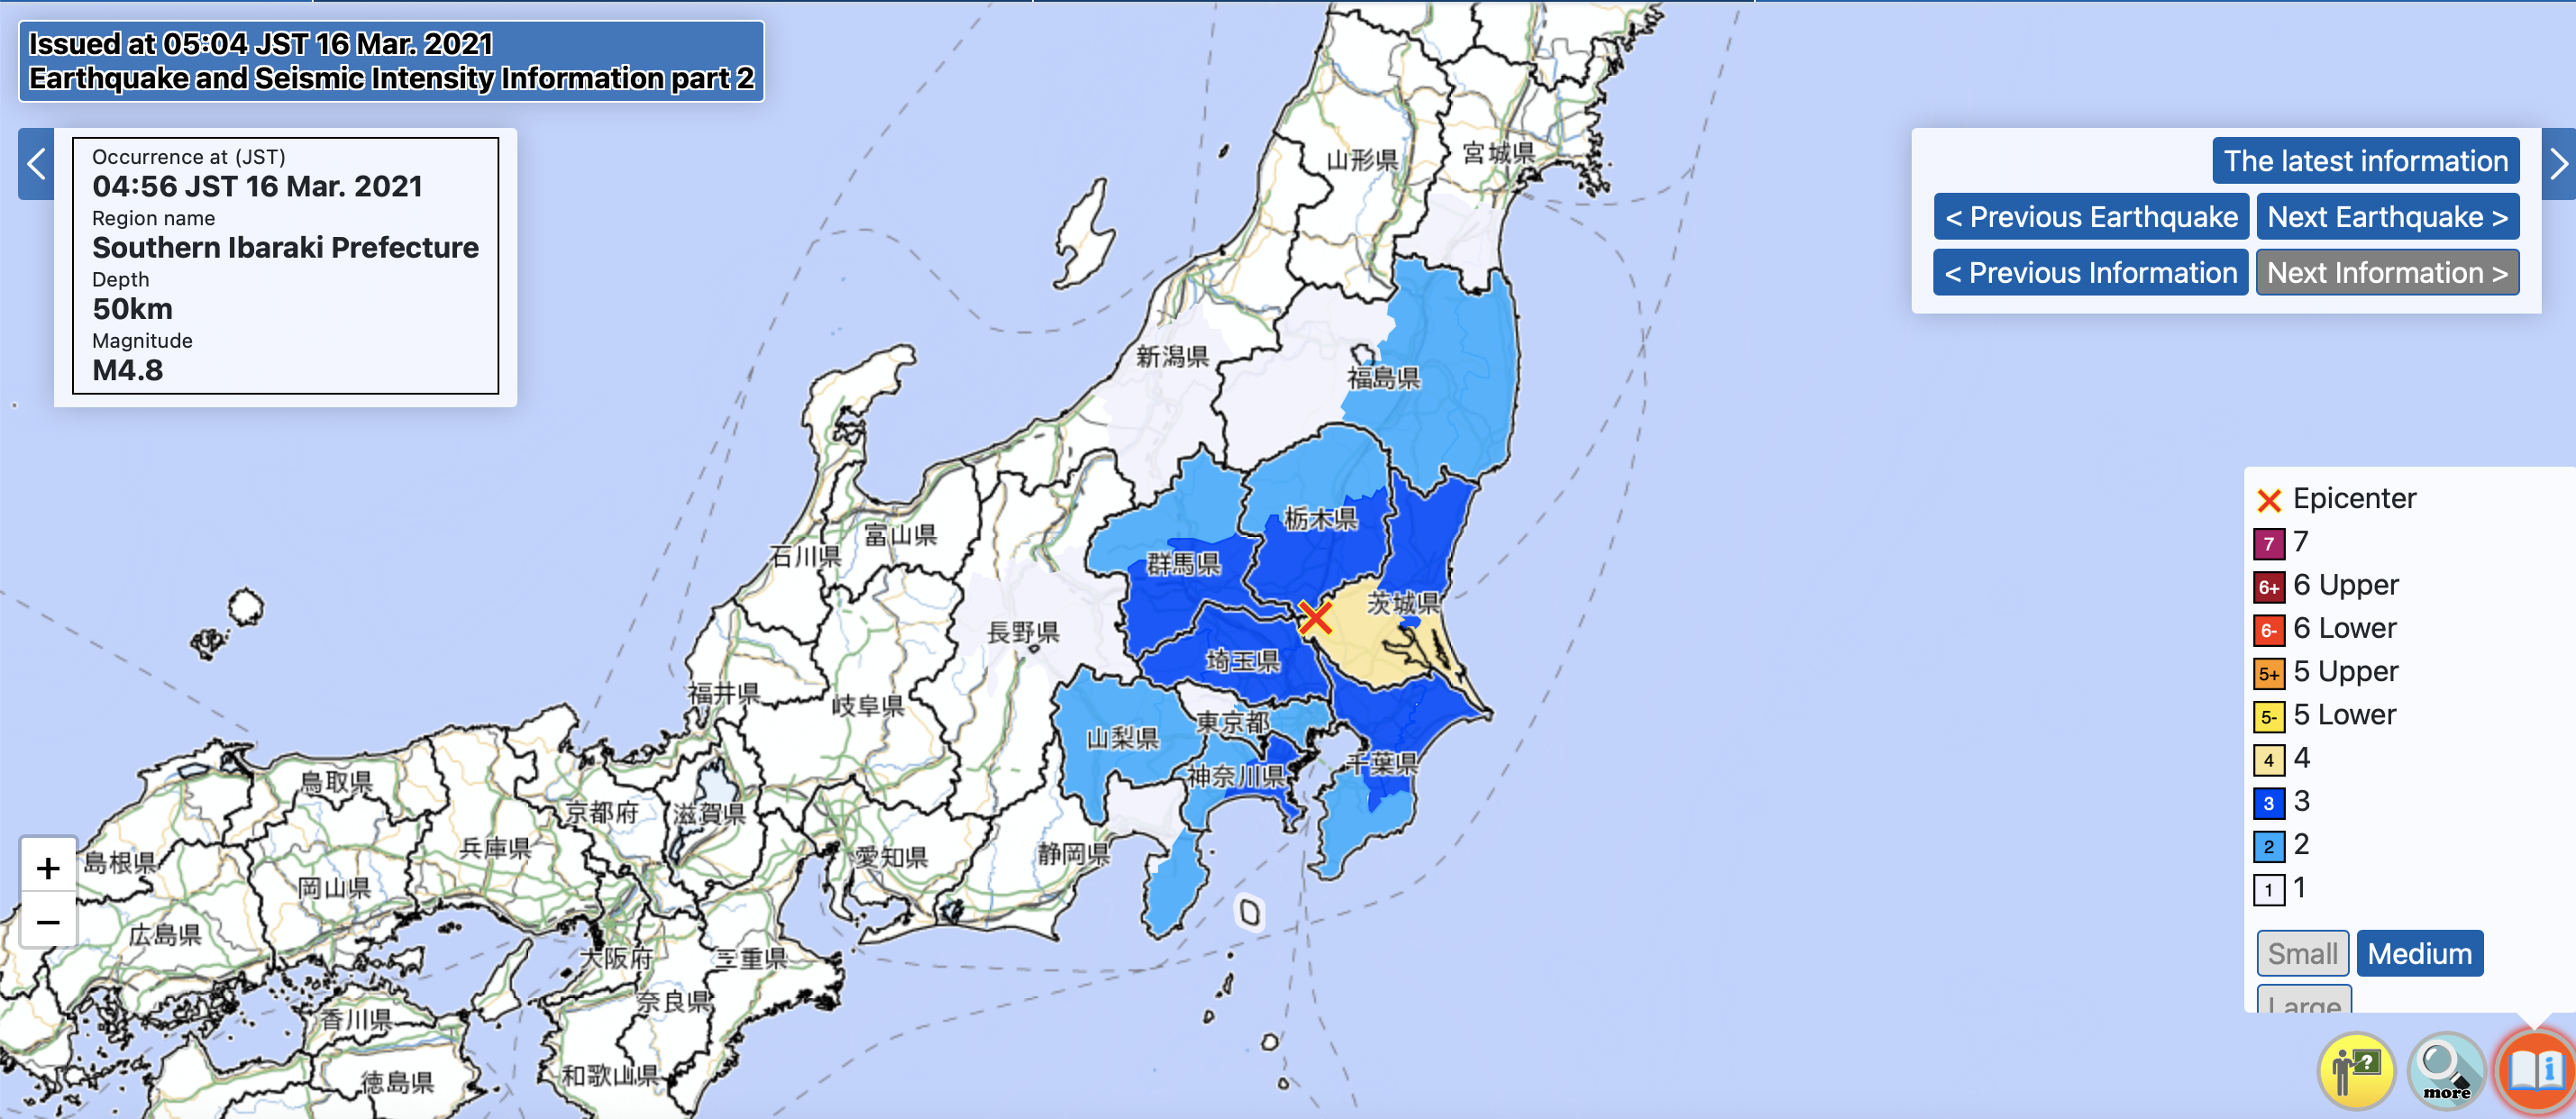
On Japanese standard time 04:56 JST 16 Mar. 2021, an earthquake happened close to Tokyo area. (attached figure one)
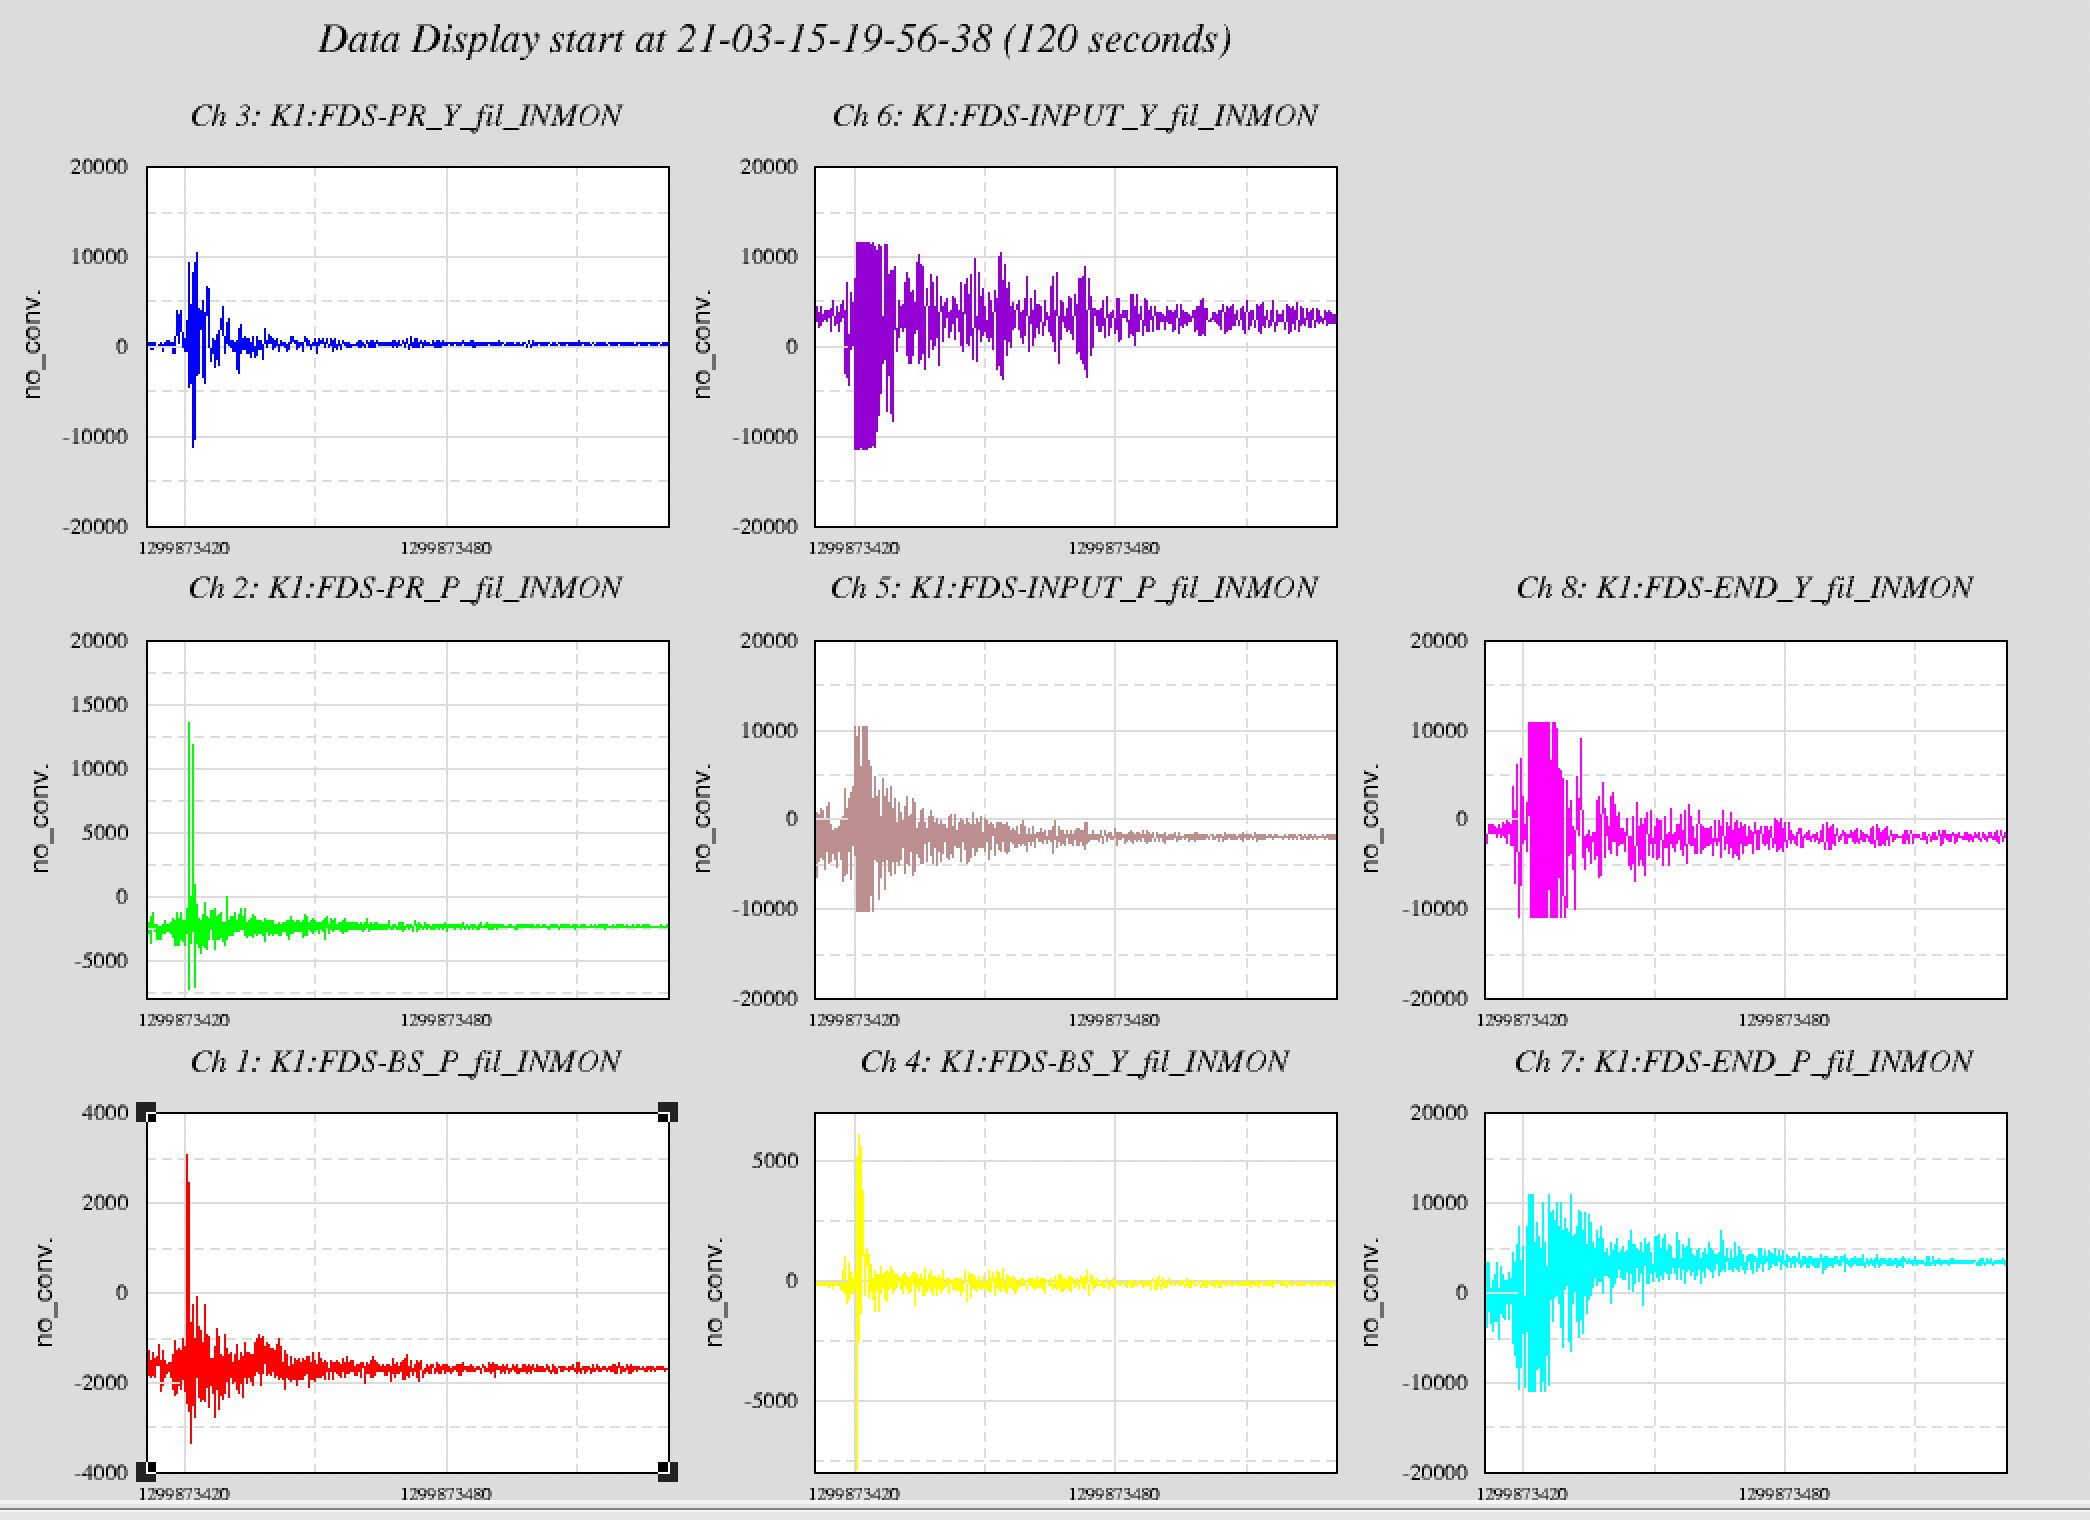
I checked the oplev signal during this time in the saved data of DGS. PR, input and end mirrors reached the maximum of oplev sensing range. Besides, this oscillation lasted for almost 20 seconds and the exponential decay lasted for almost 40 seconds. (attached figure two)
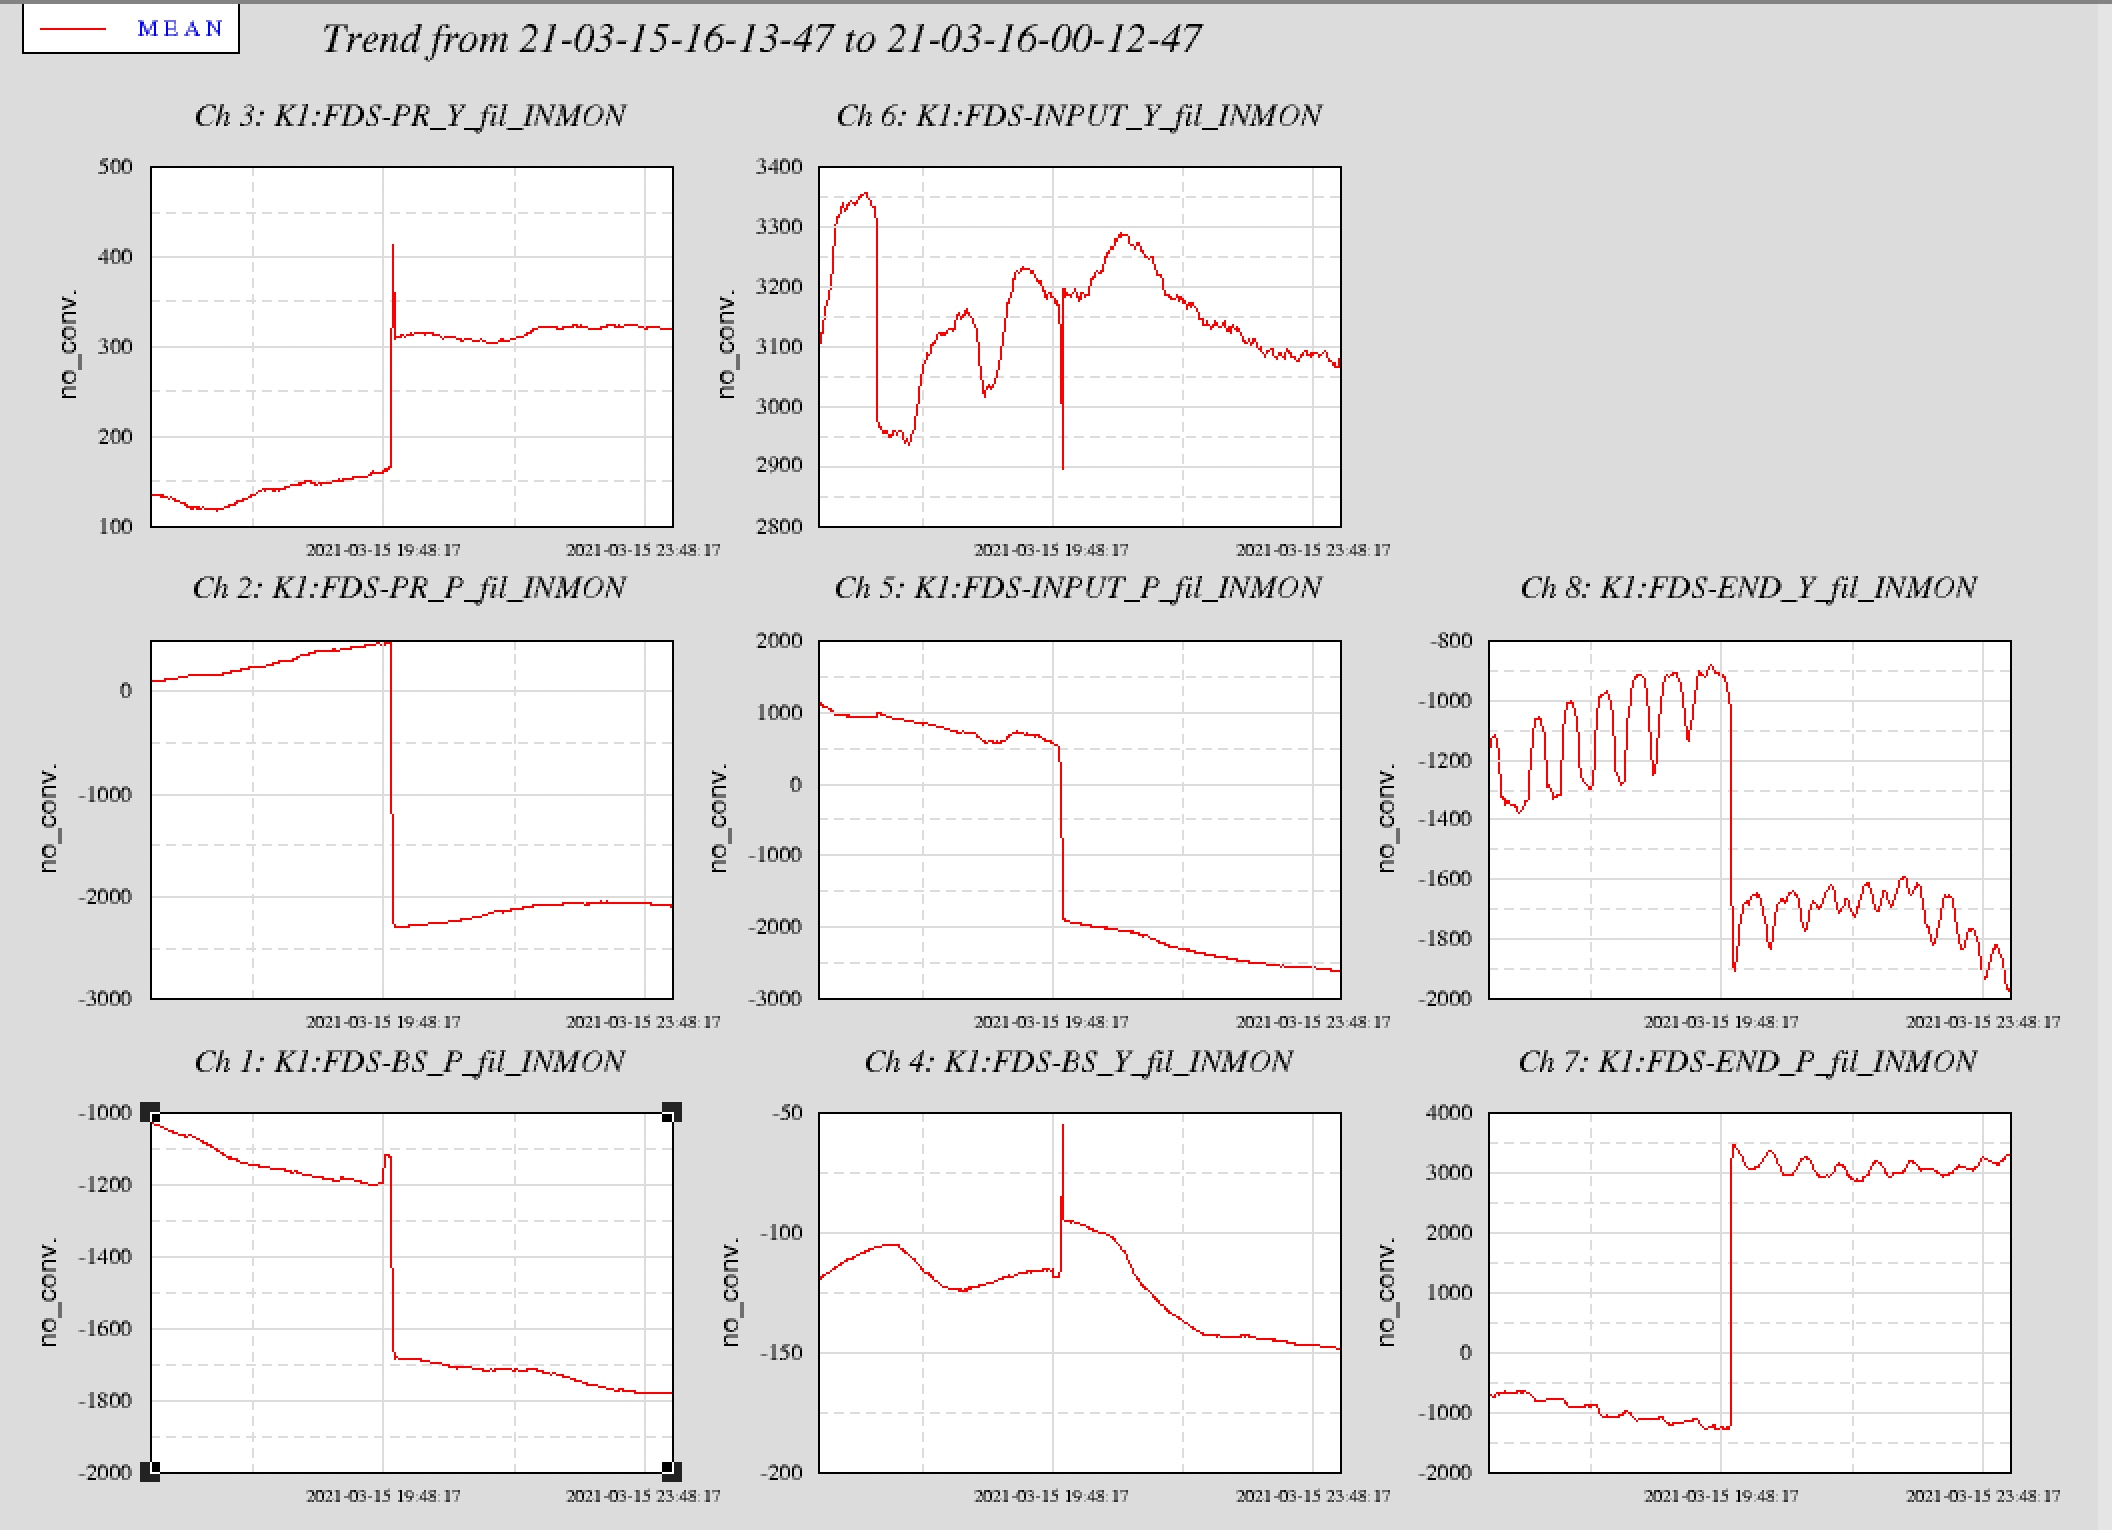
After the earthquake, all mirrors drifted away from their original position. (attached figure three)
| Yaw_original position | Yaw_new position | Pitch_original position | Pitch_new position | |
| PR | 150 | 320 | 500 | -2000 |
| BS | -120 | -90 | -1200 | -1700 |
| Input | 3200 | 3200 | 500 | -2000 |
| End | -900 | -1700 | -1200 | 3500 |
According to the above table, we are going to move picomotor to recover mirror position.
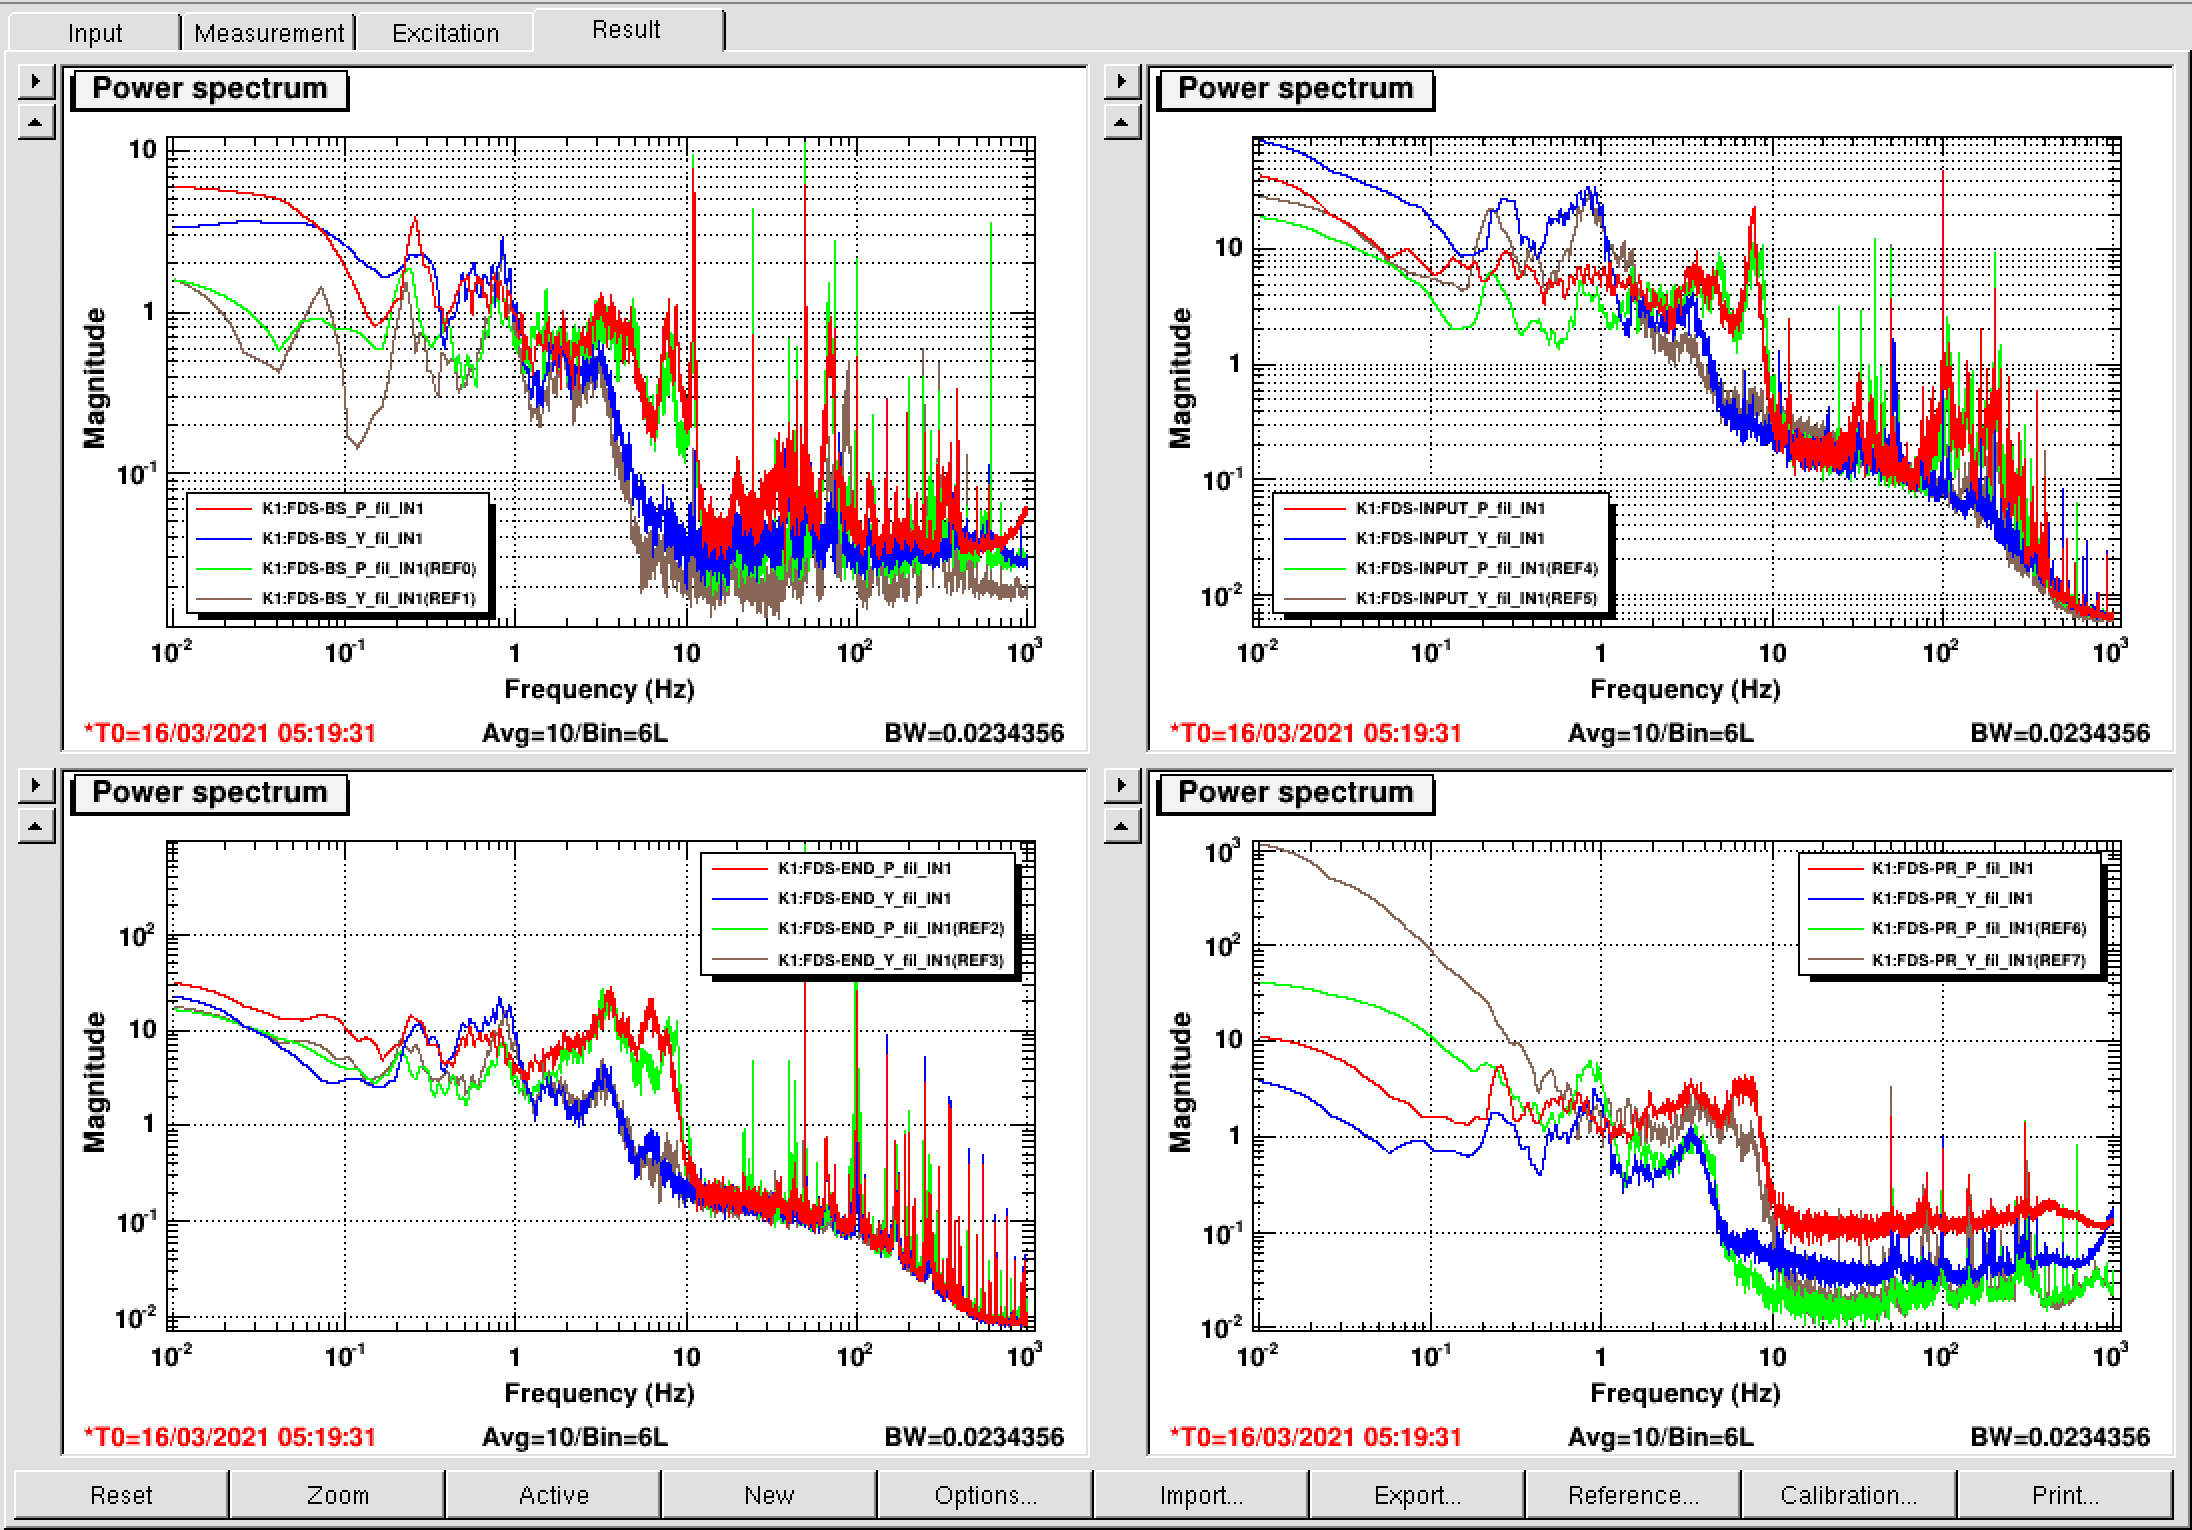
Before moving picomotor, I also checked the spectrum of all mirrors pitch/yaw. No touching induced peaks were found. (attached figure four)
Marc, Yuhang
Yesterday we wanted to check again QPD demodulations pahses before implementing the new driving matrix.
However, the BS pitch seemed to be totally out (180 offset required to get the beam on the end camera).
We had a look on one week data trend of every mirror oplev signal (attached pdf).
This large BS offset has 3 origins as indicated by the red arrows :
- An earthquake not too far from Tokyo in March 3d caused a -500 pitch offset of BS (also visible on IN and slightly on END but not so evident effects on PR )
-
Switching the air conditioning to 'cold mode' cause a 1500 pitch offset of PR. Indeed, PR is located directly under the air conditioning.
-
Strong rain/storm on March 13th cause a further 500 pitch offset of PR
Therefore we decided to use PR pitch picomotors to move PR back to its previous good position (~300 steps).
But this made the required BS offset -180... This is quite close to coils saturation (it corresponds roughly to 20 000 counts) so we might have to move again BS picomotors...
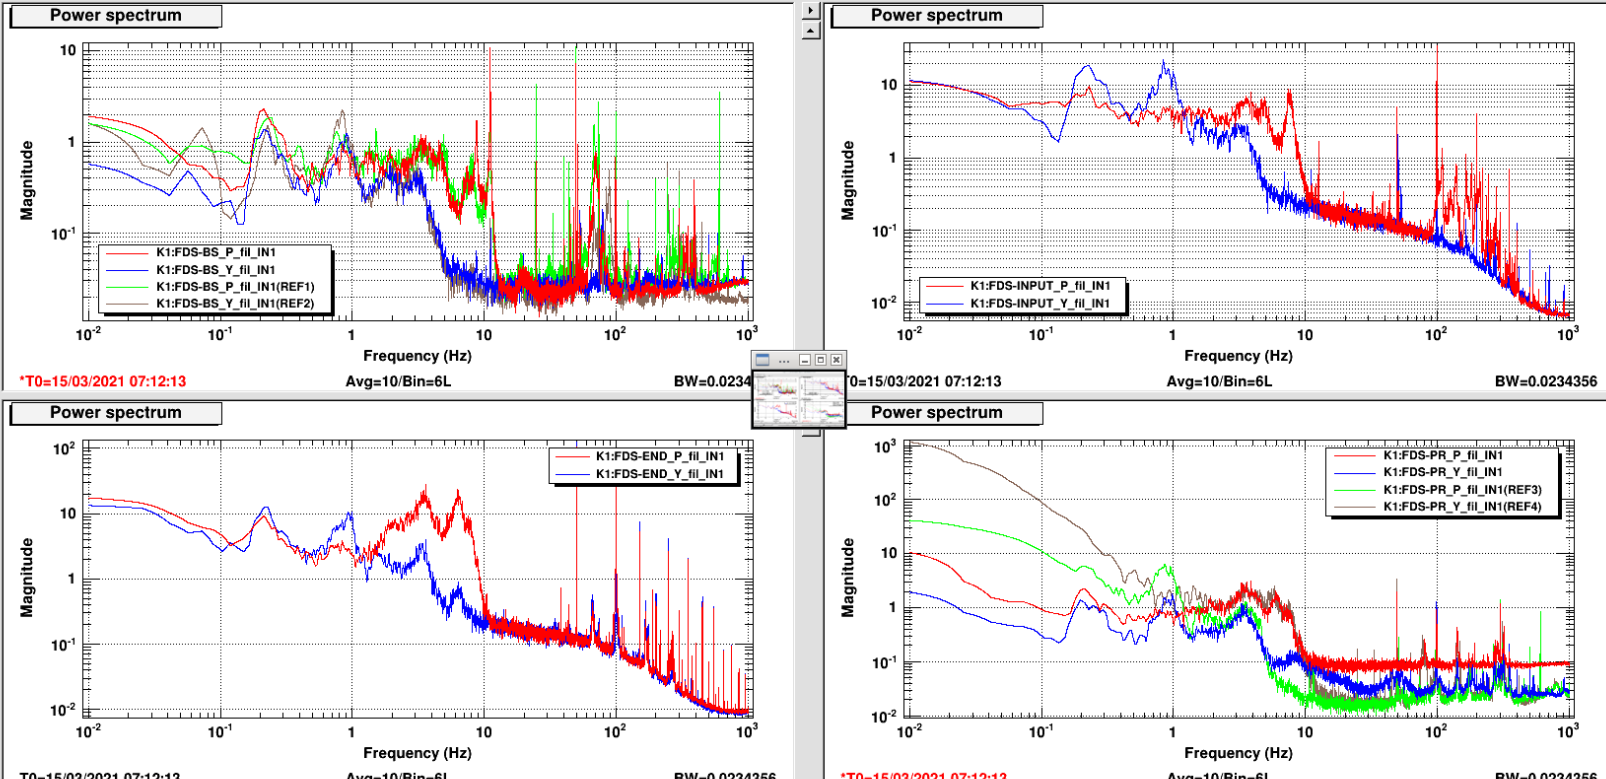
After the movement of PR picomotor we took the oplev signals (fig 1) where green/brown are references and blue/red yesterday data.
We can see that PR seems fine. However, comparing the low frequency spectrum of BS and PR between reference and yesterday datas, PR low frequency spectrum changed quite more than BS one. It seems that PR is far more sensitive to seismic activities than BS?
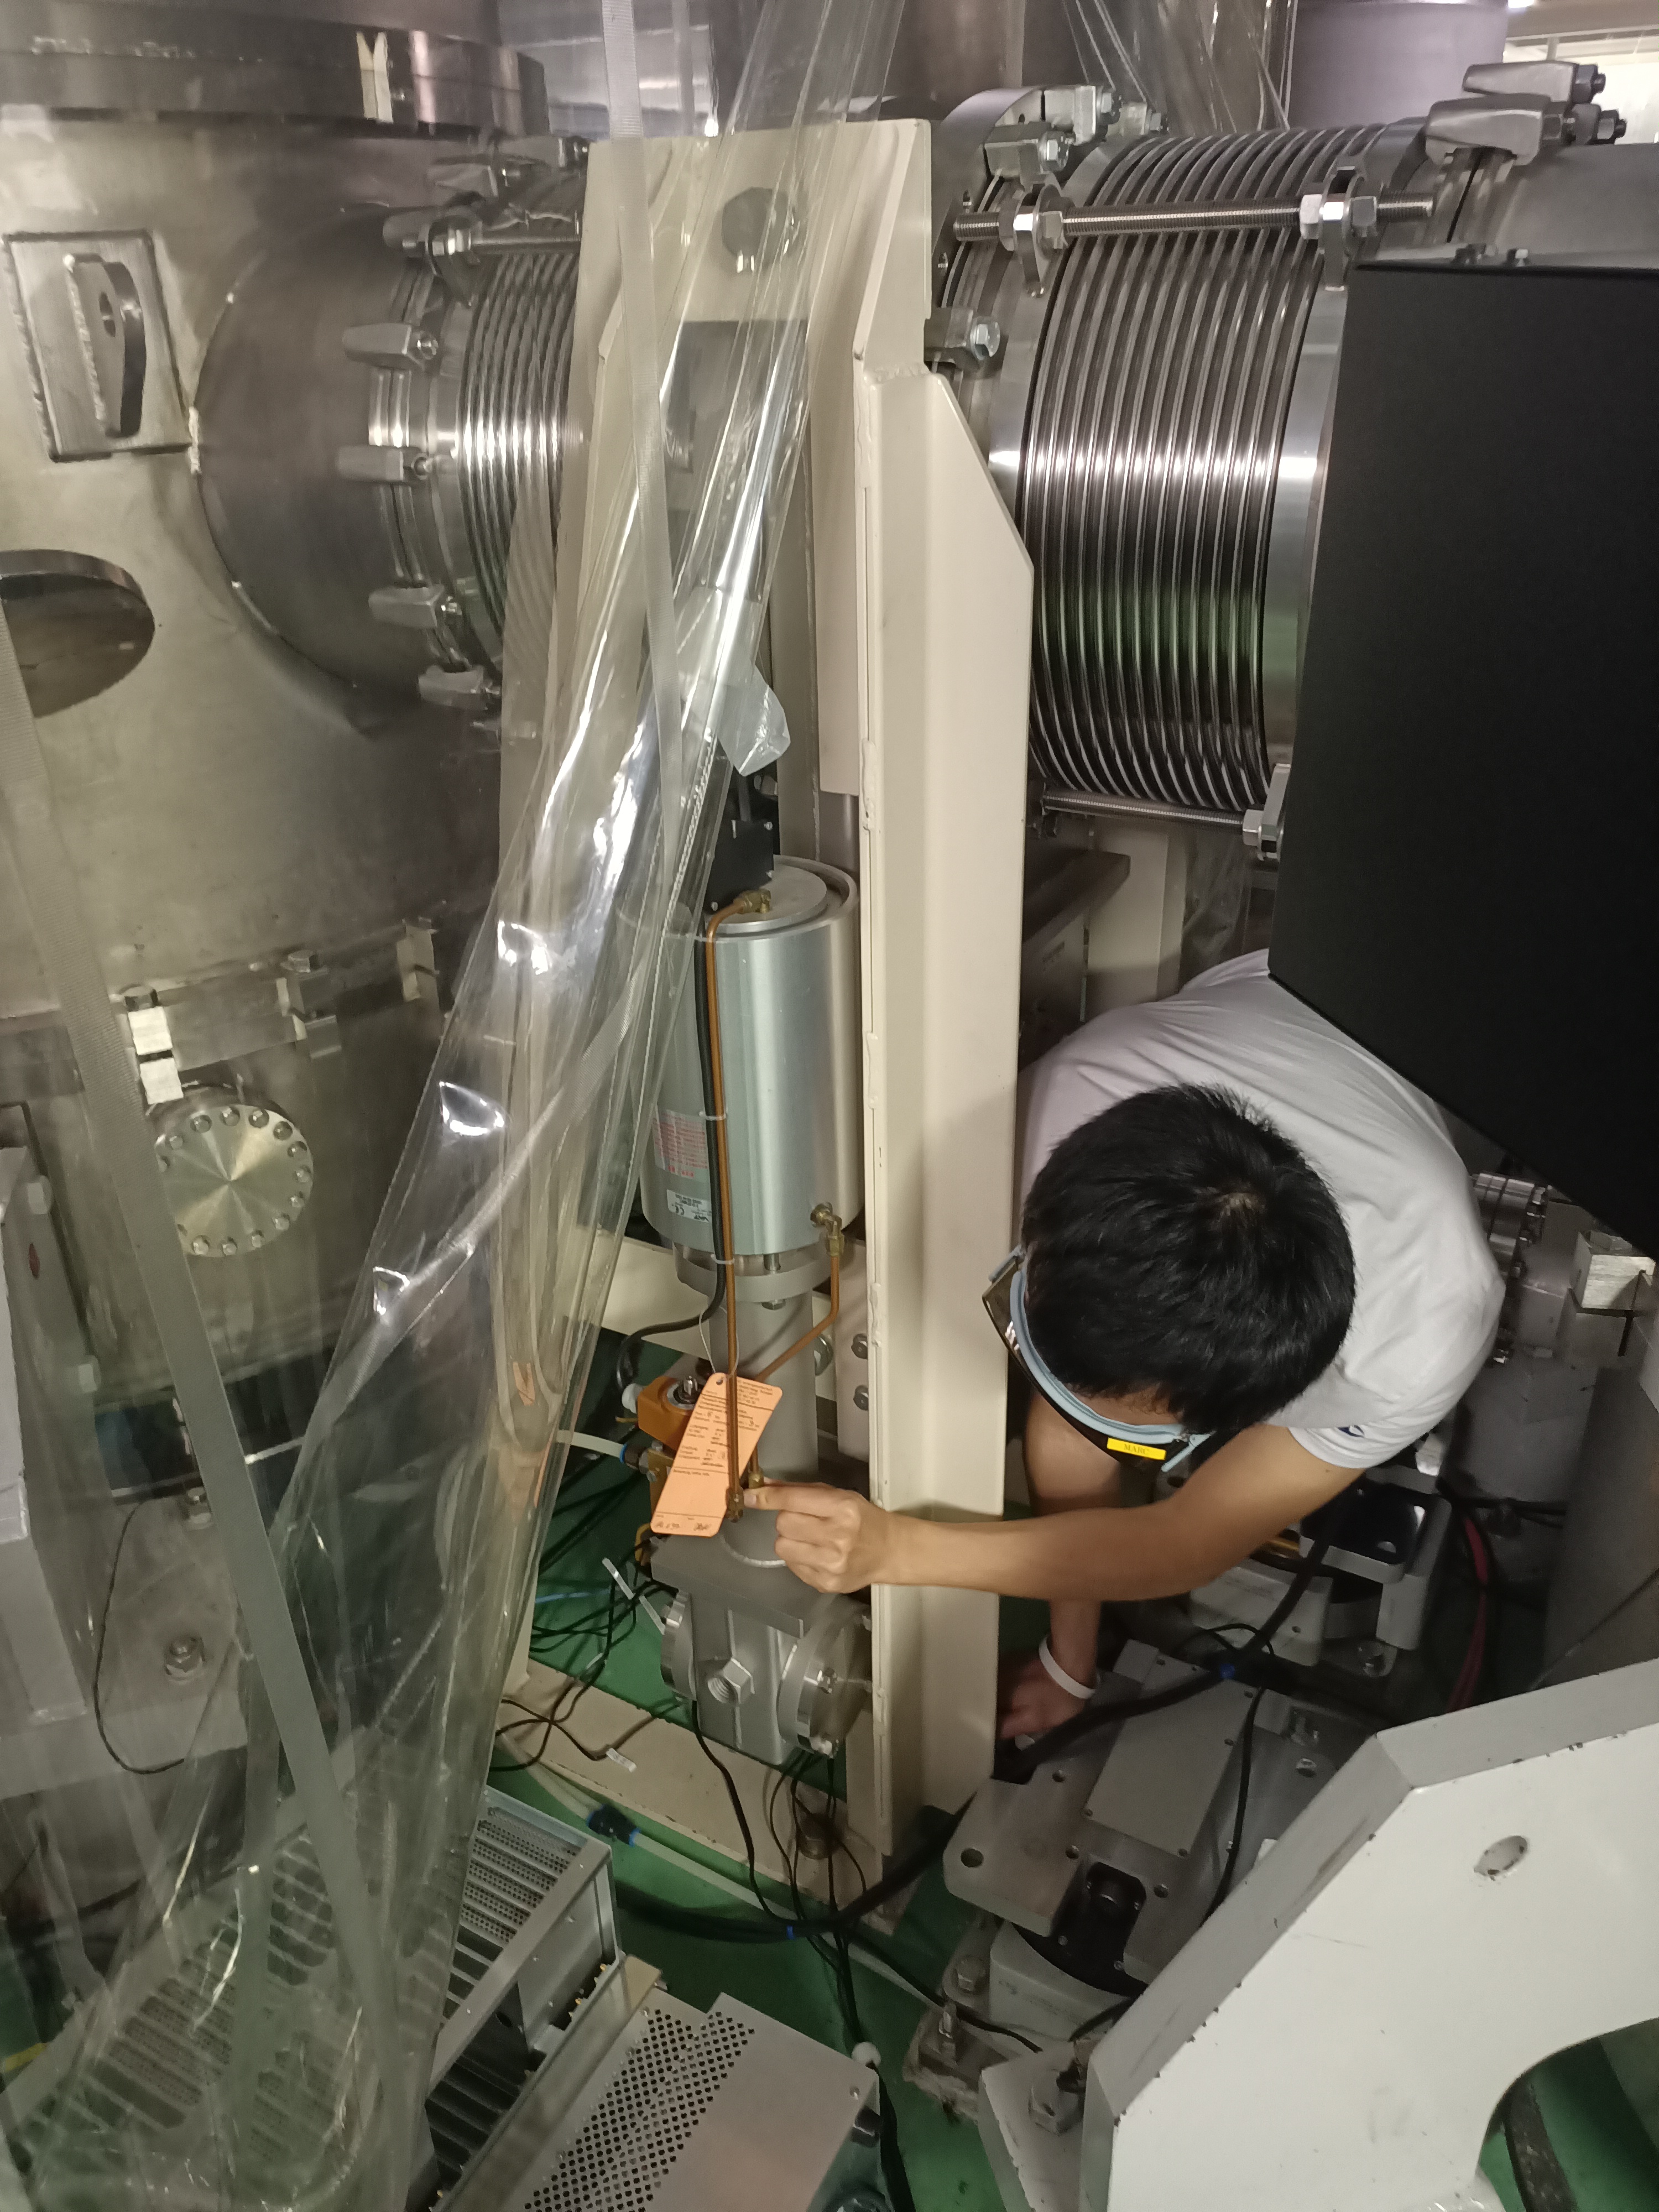
We also found out that there is an air leakage on the BS gate valve. It might be due to a loose washer pointed by Yuhang in Fig 2. It might be another after effect of the large earthquake as the air leakage sound was not so easy to hear.

Aso-san, Marc
The air leakage of the gate valve was indeed due to a loose screw.
Aso-san tighten it more and no more audible sound nor air coming out.
Marc, Yuhang
Yesterday we spent some time to tweak a program made by Julia Casanueva for Virgo automatic alignment and adapt it to our case.
Then, we tried to measure the sensing matrix.
However, the green beam was not anymore centered on the QPDs..
We found out that the last steering mirror before the QPDs board was not well fixed. We fixed it back but we could not recover the alignment by acting only on this mirror.
It could mean that another mirror on the green reflection of the FC has been misaligned but we couldn't find which one so we acted on the both galvos to recenter the beam on the QPDs.
We measured the sensing matrix by injecting a 2Hz line on Input and End mirror pitch (300 amplitude) and yaw (200 amplitude) and extracted a driving matrix and phases to get all signal on I quadrature.
Today, we saw that the phases are tuned at the level of each segment so we will have to tweak a bit more the program as it gives the optimal phases at the level of pitch and yaw (not individual segment).
Anyway, today we tuned each segment phase 'by hand' to get all signal on I quadrature by either looking at the 11 Hz resonance of pitch or injecting a 2 Hz line. During this measurement the misalignment of the FC affected the accuracy of the measurement so we had to realign it, but also there were moment with large changes of the optimal phases...
The new phases are :
| segment 1 | segment 2 | segment 3 | segment 4 | |
| QPD1 | 125 | 125 | 120 | 127 |
| QPD2 | -16 | 145 | -15 | -9 |
We completed the arrangement of the optics described in 2393.
A bit of misalignment from an ND filter in front of the 250mm lens was corrected, and some slight account had to be made for the phase shifter not being perfectly vertical (i.e. introducing pitch misalignment from horizontal incidence). The IRMC mode matching was optimised through alignment and fine tuning of the 75mm and 250mm lens positions, and we recovered the transmission of 1.79 mW of TEM00 from the IRMC (power meter measurement).
We will compare the new result to that of 1904
Michael and Yuhang
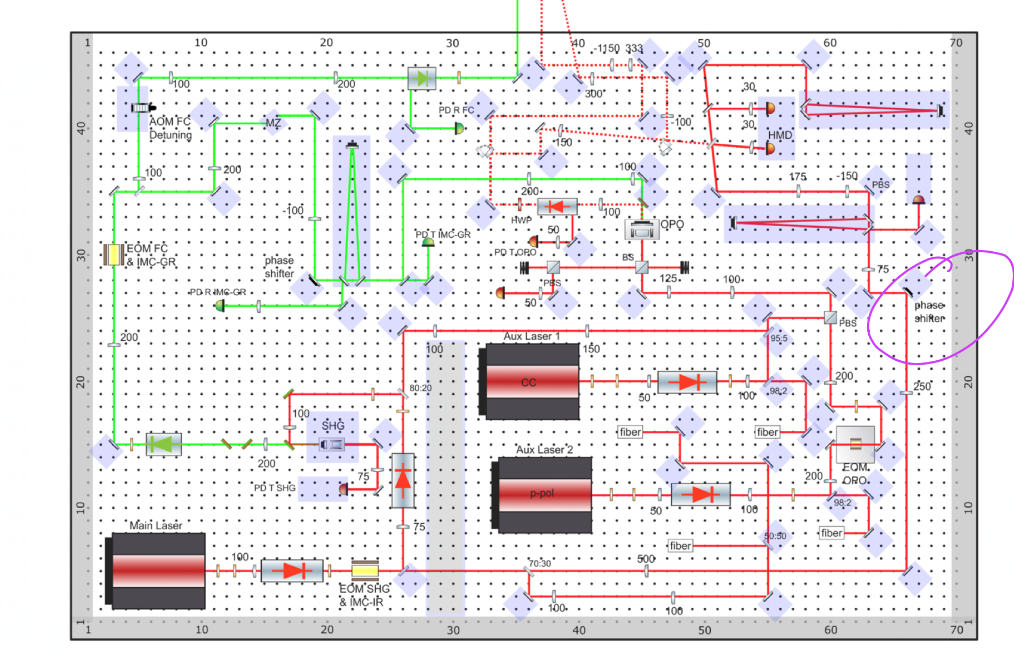
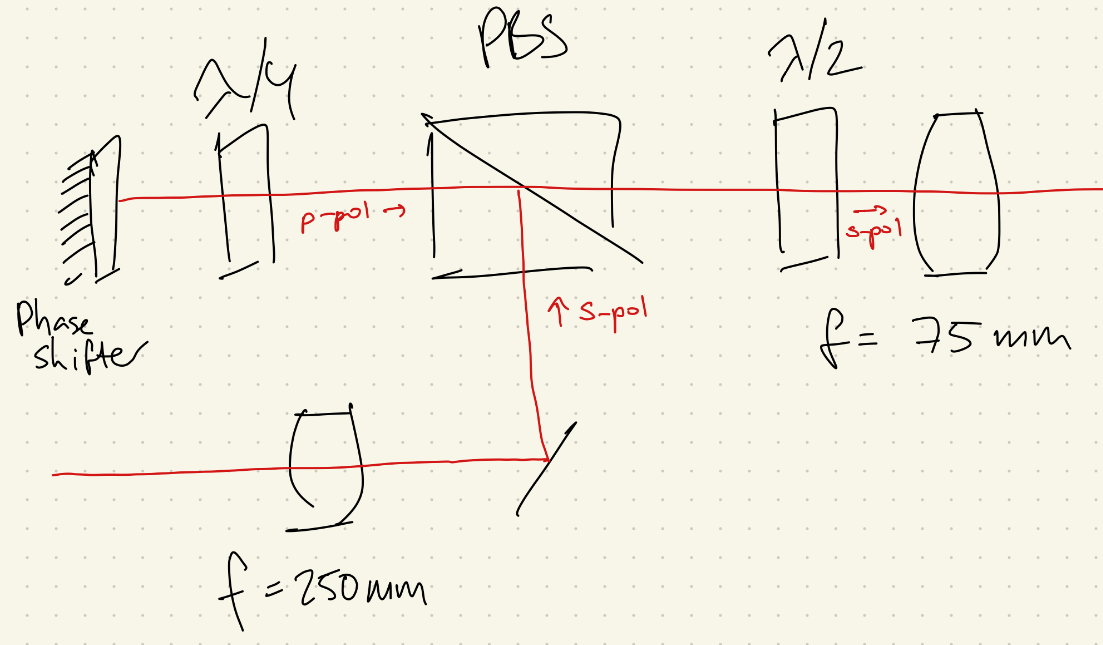
We worked on replacing the phase shifter for the beam going into the IRMC, highlighted in figure 1. Afterwards we will also look at the one going into GRMC. The angle of incidence causes beam jitter noise when the phase shifter acts on the beam. We decided to replace this with a perpendicular incidence setup as per the sketch in figure 2, using a PBS and waveplates.
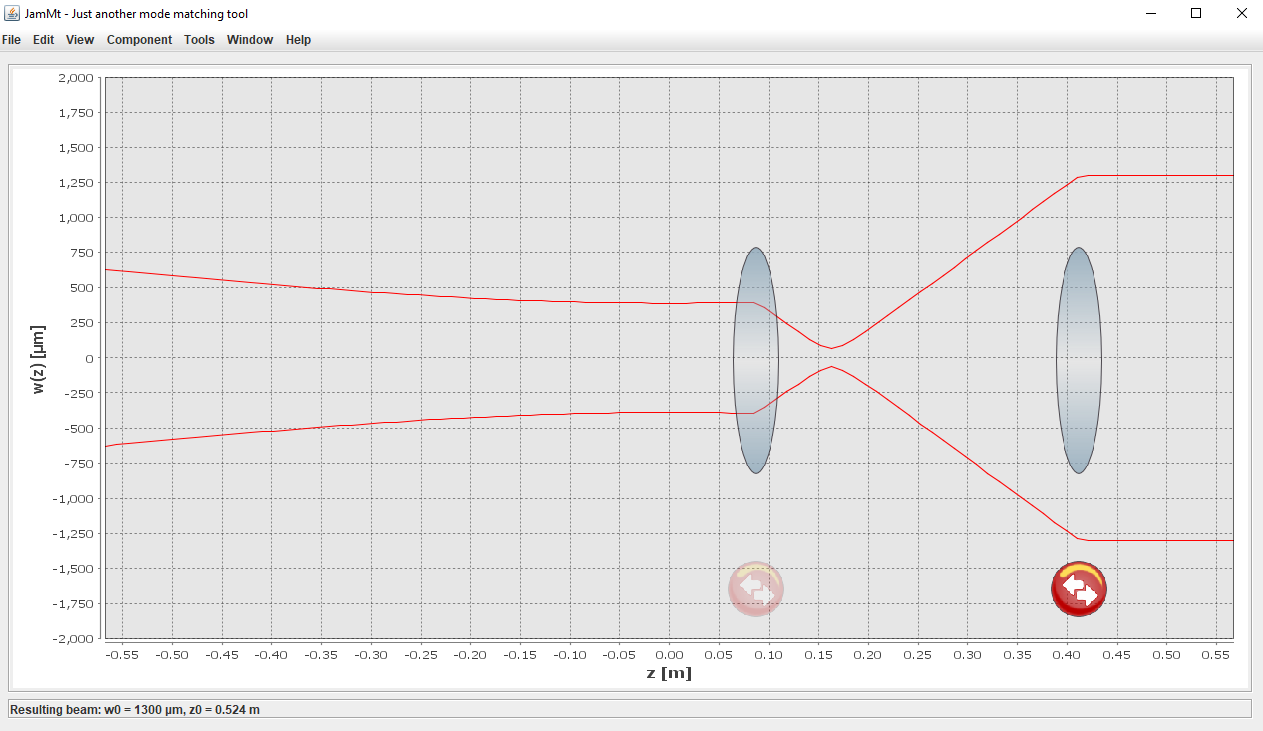
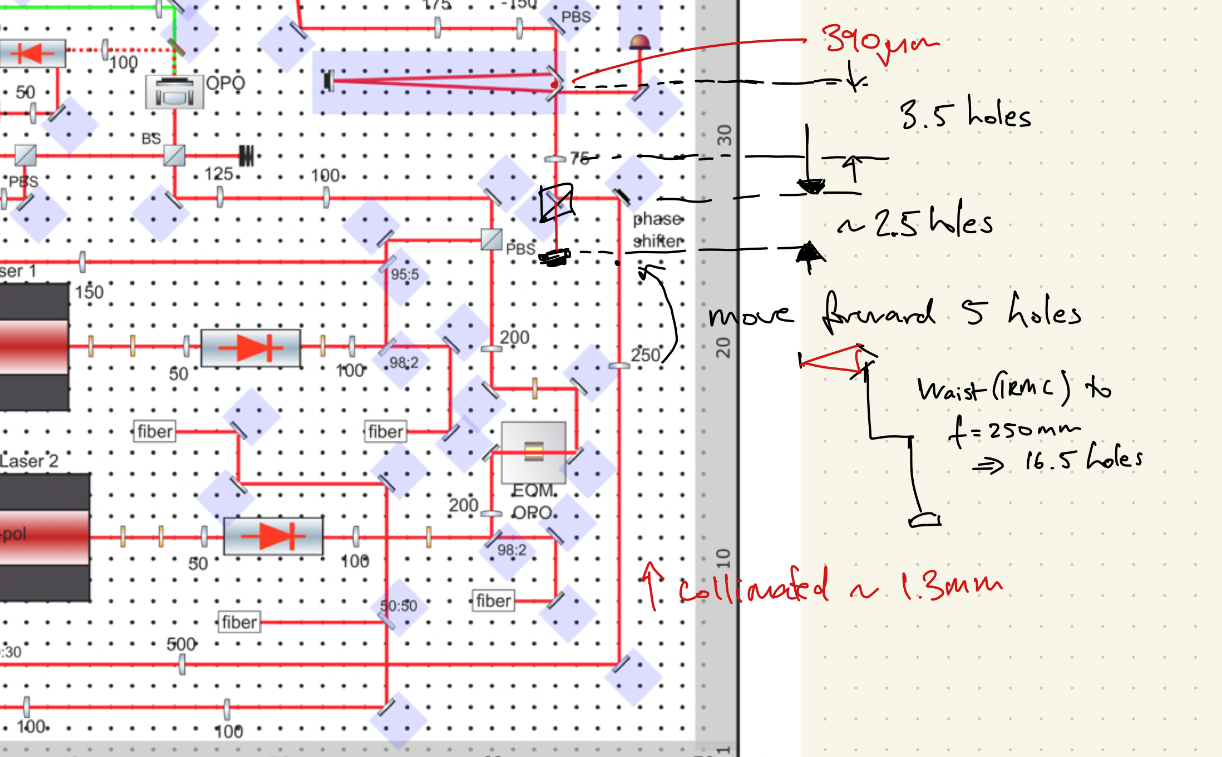
We have reference for the values of the IRMC (390 µm beam waist, 1.8 mW transmitted power). Using the reference waist and the distances of the holes, the beam should be collimated before the 250 mm lens (fig 3). So there is not much need for complicated rearrangement of the lens positioning. We just have to move the 250 mm forward by however much the path length is from the PBS to the phase shifter and back. Fine tuning of the lenses can be done via the mount. A rough indication of the distances is shown in fig 4.
We took the following items:
PBS: CVI PBS-1064-100
HWP: CVI QWPO-1064-08-2-R10
QWP: CVI QWPO-1064-09-4-AIR-R10
During the aligment we made sure to recheck the beam propagating along the west end of the table to the 250 mm lens, to make sure it aligned with the holes and was consistent with the more recently aligned beam height from the SHG (76 mm).
Using the power meter, the power before the PBS was 4.14 mW. After double passing through QWP and PBS, it was ~ 3.8 mW.
Akutsu-san, Marc, Matteo
In agreement with Akutsu-san we plan to use the ATC clean room to assemble the new OPO.
Fortunately, there is an IR laser installed on one corner that we can use. After the laser source, there are some optics (Faraday Isolator, lenses) so that the beam should be collimated.
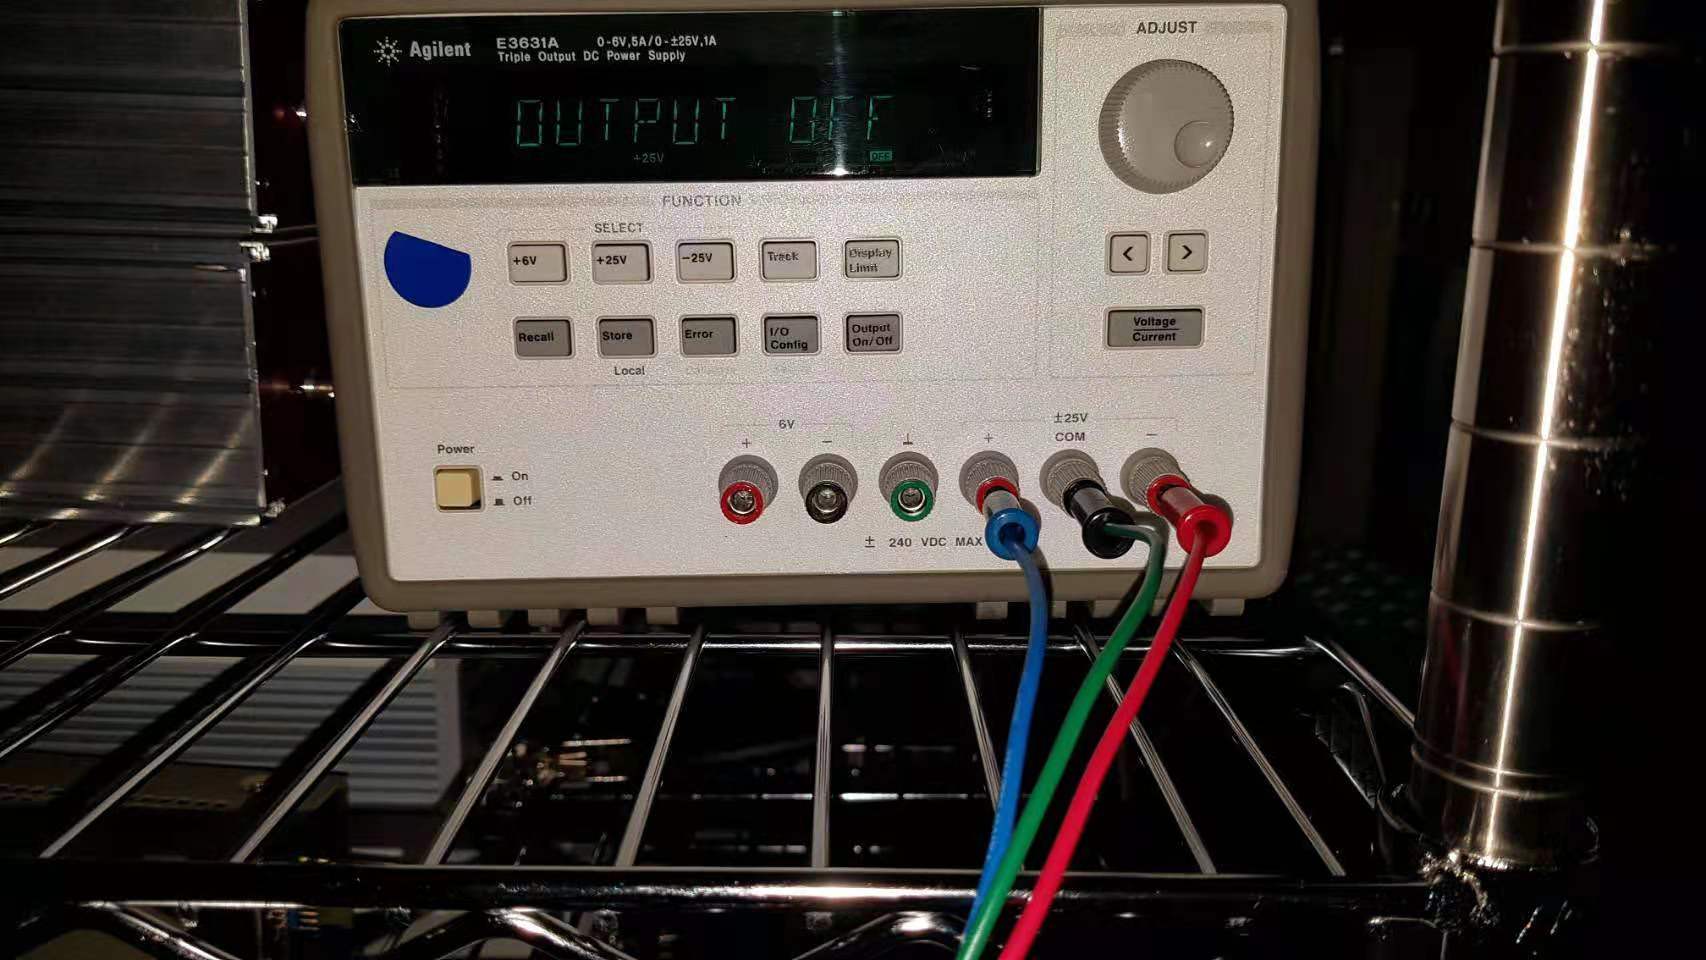
The procedure to turn on the laser is the following :
- Connect power supplies
- Turn on the +5V supply (largest black button)
- Press 'stand-by' button on the laser source to get out of the standby mode
There are few components around this laser setup that we can displace for the assembly (scale, forks, pillar) so that with 2 steering mirrors we have enough space to use this laser.
PS :
- We have to bring new clean suits and we can also bring the old ones of this clean room for the next time we clean the clean suits
- we'll need a periscope, beam profiler, mounts, forks, few lenses, safety glasses, etc ...
Marc, Matteo
Last Friday I flipped the surface reference sample and tried to further tweak the alignment without much improvement.
Yesterday, we decided to measure the beams profile.
Unfortunately the automated LabView program had some error and we had to do measurement one step at a time...
I installed first the razorblade vertically (2 cm in front of the last hole of the translation stage toward the imaging unit) and scanned both the red and IR beams on the Y/Z axis.
[Note that connecting the DC output of the powermeter went smoothly despite troubles to read the powermeter through the other cable]
Then I turned the razorblade horizontally (54mm above the translation stage) and scanned both the red and IR beams on the X/Z axis.
Actually the razorblade cut the beam not on the razor edge... meaning that we have to take into account the 28mm width of the blade.
I finished to write some MATLAB code to automatically extract all measurement data from yesterday, fit them using a program wrote by Manuel.
But It is still needed to check the screenshots 1 by 1..
Marc, Matteo
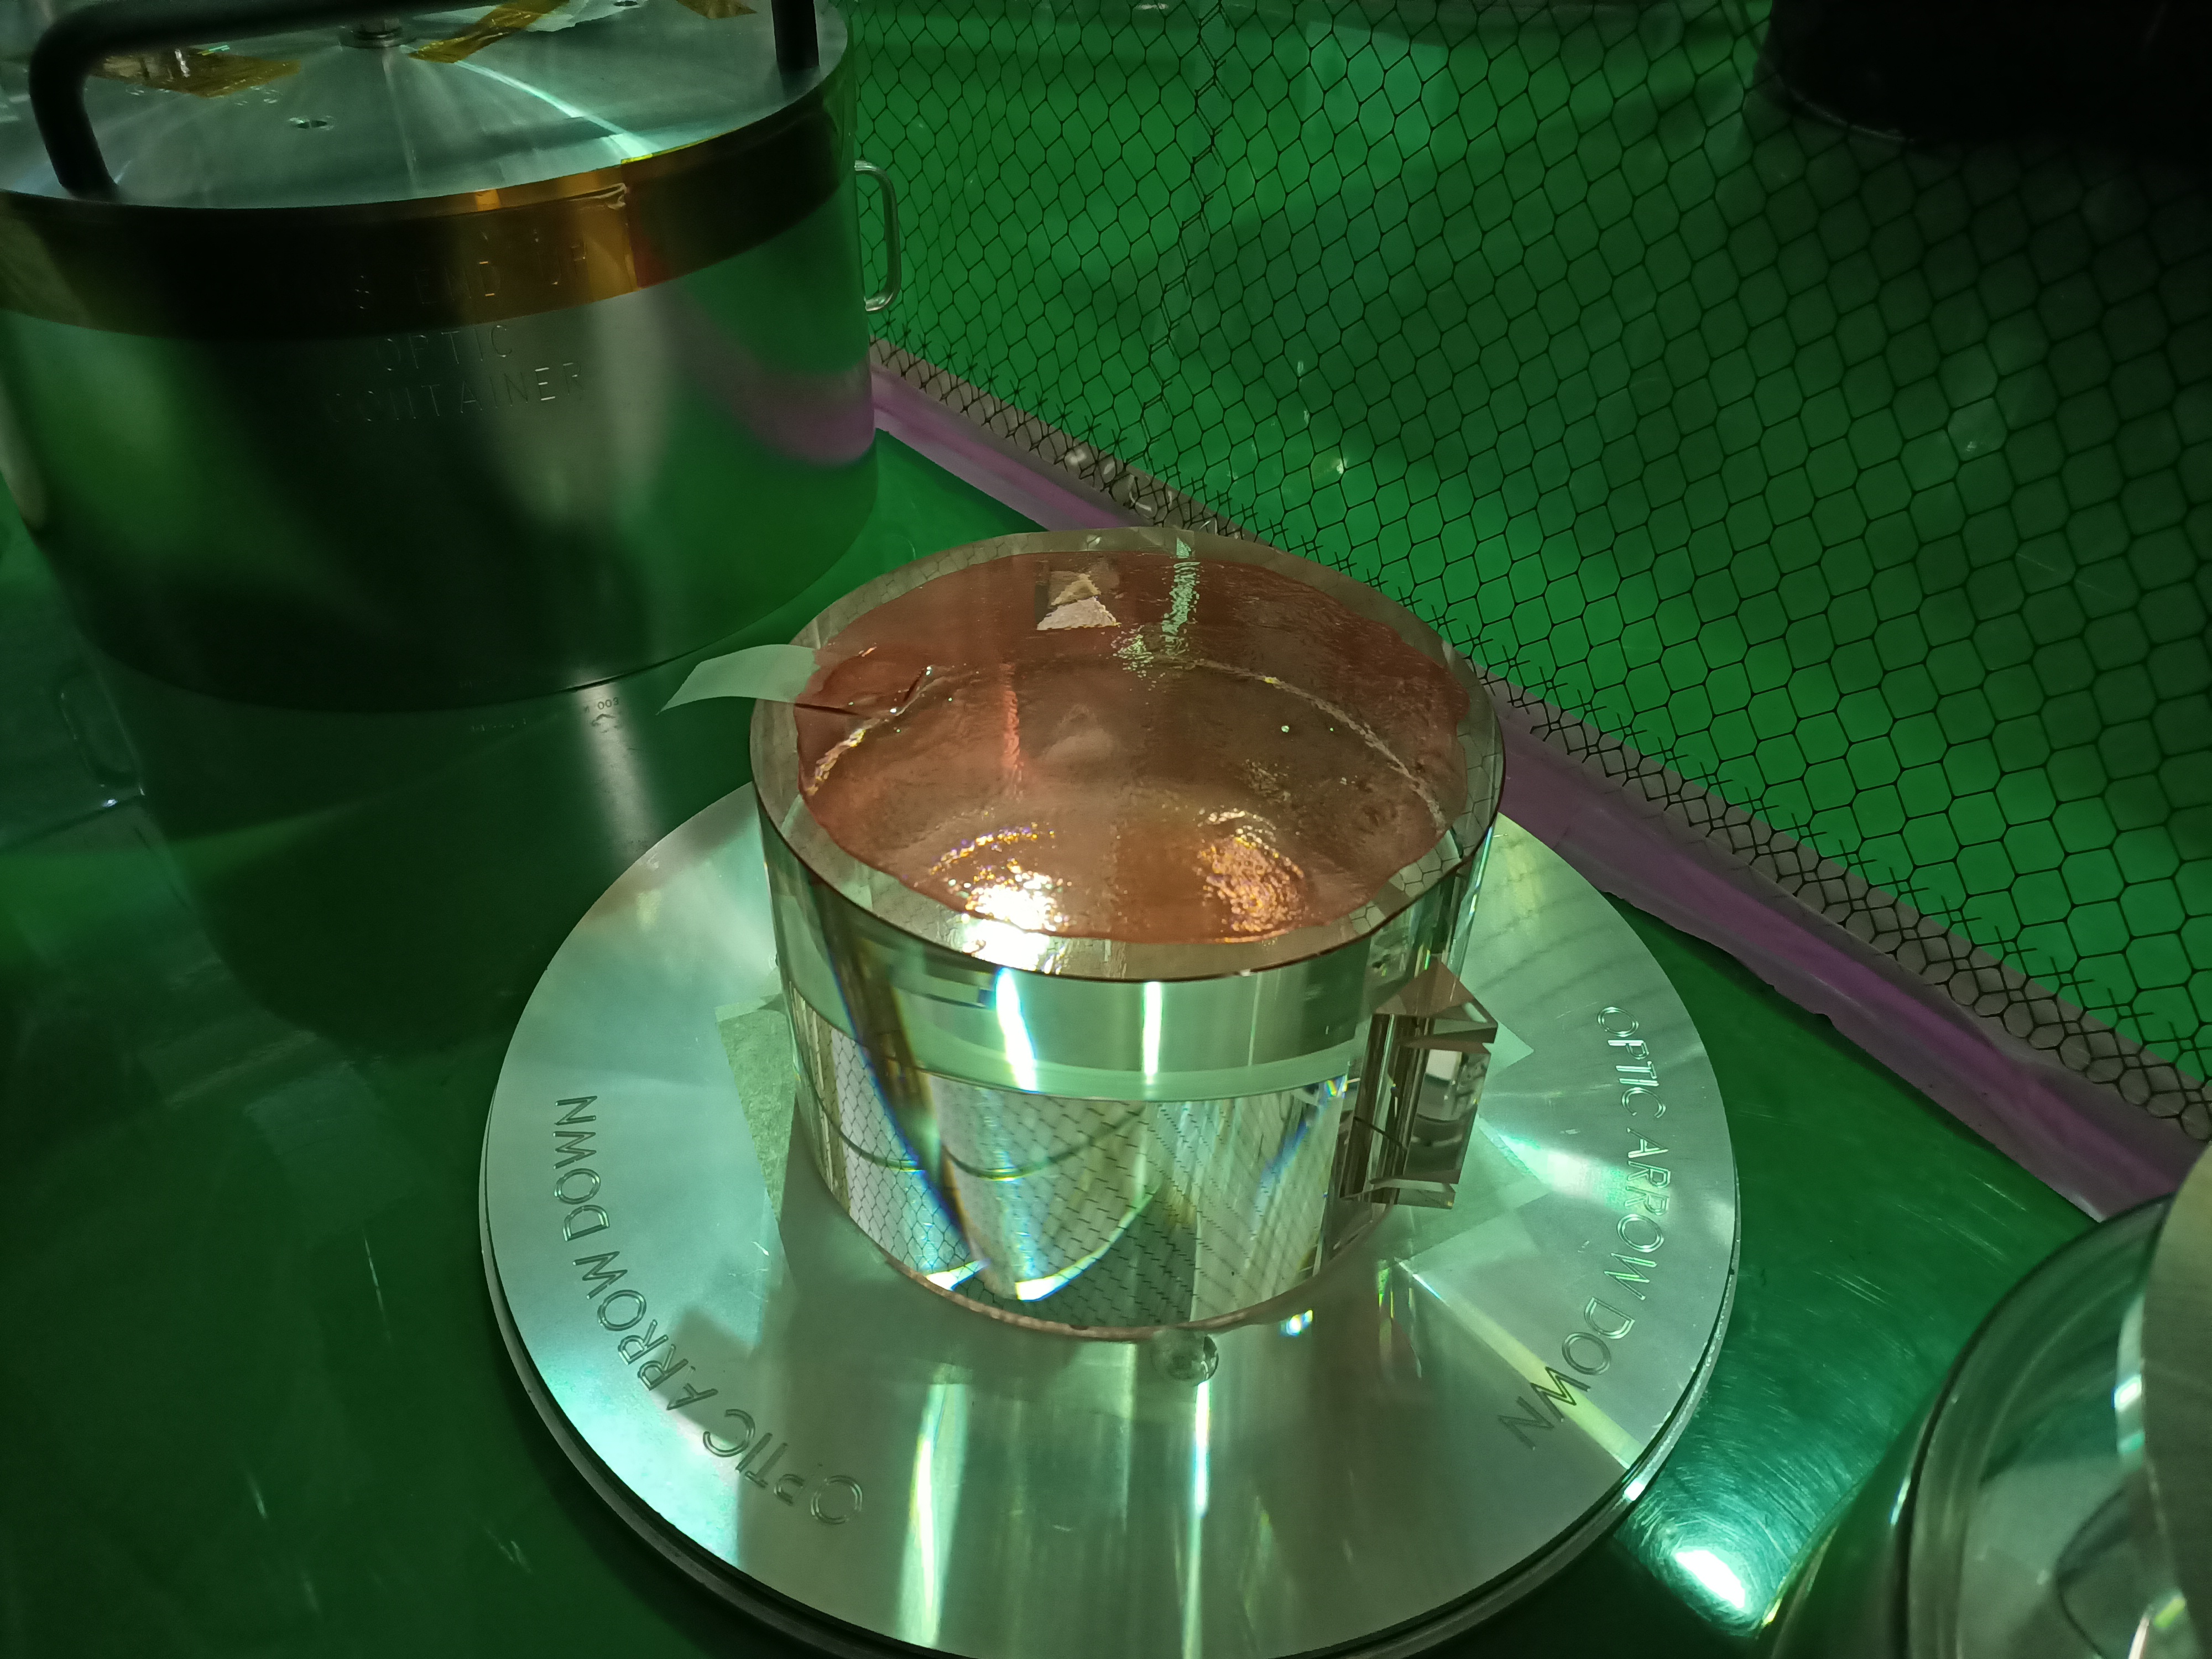
Yesterday we removed the first contact applied on KAGRA spare, flipped the mirror and applied first contact on the other surface (Fig 1)
Michael and Yuhang
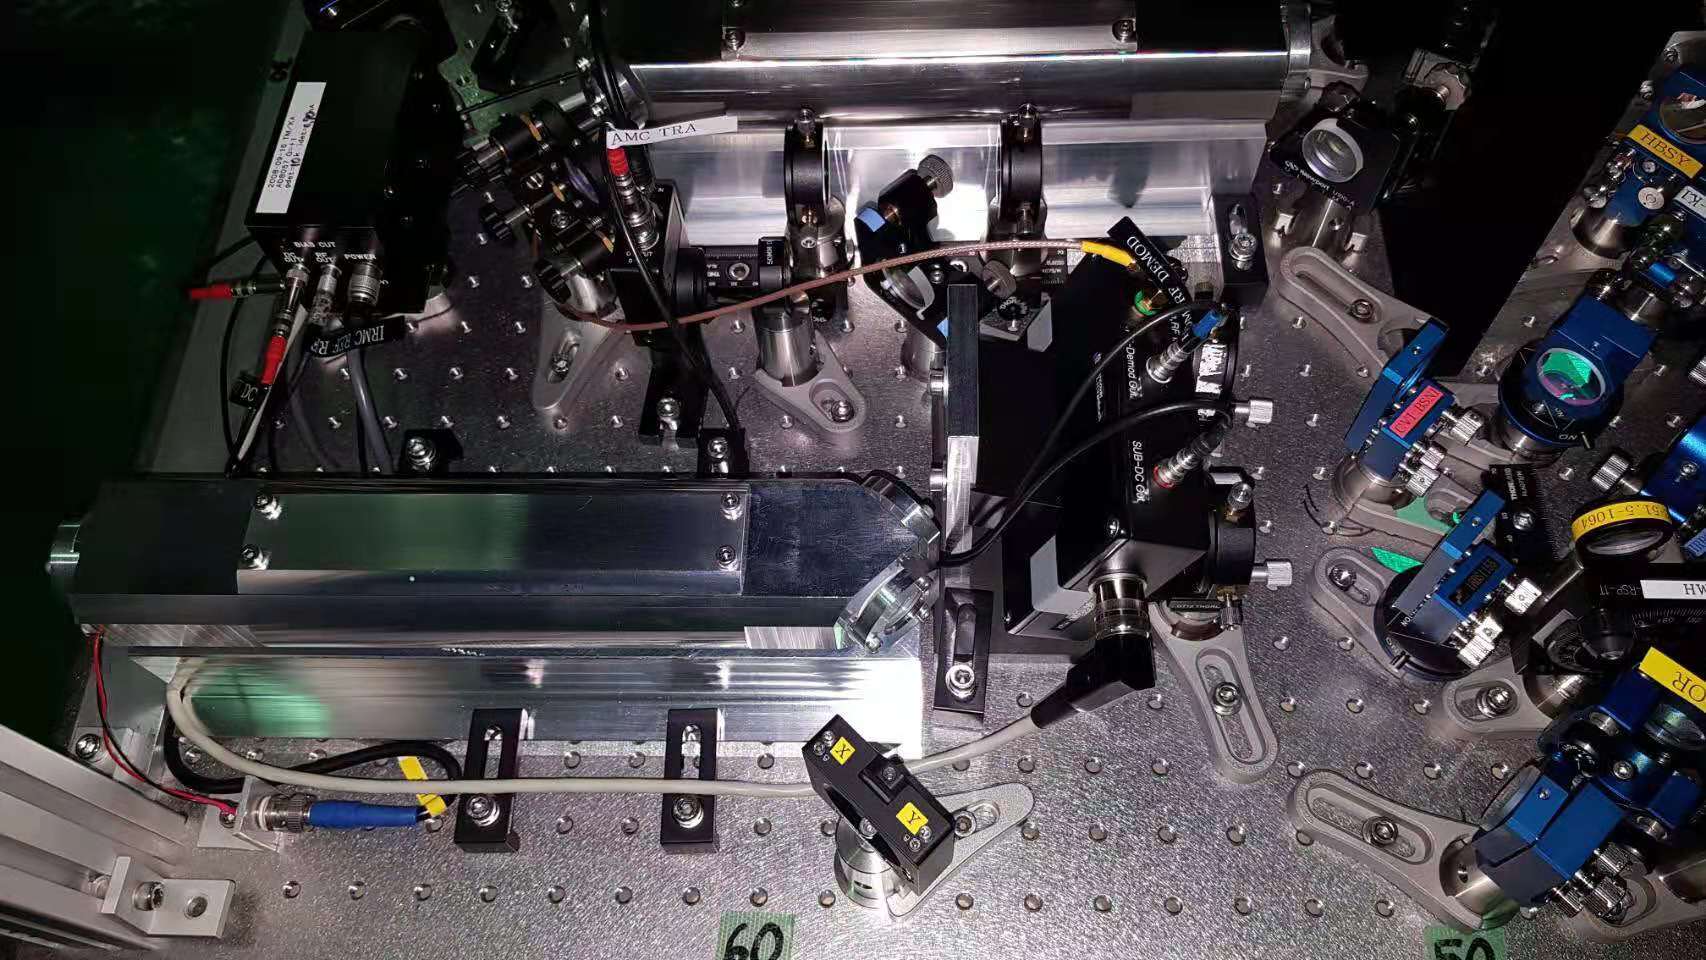
We replaced the big mirror mount in front of AMC with a compact one. (attached figure 1: the replaced mirror. attached figure 2: the gap between replaced mirror and board)
We have made homodyne DC cable, homodyne power cable, AMC DC PD power cable go through the appropriate hole. (figure 3: extended cable on homodyne power side. figure 4: current cables situation around homodyne)
To close bench, we still need to drill holes on board to let GR inj/ref and IR inj/ref go through (three holes are expected).
Marc, Michael and Yuhang
We have characterized some signal and noise of CCFC PD in elog2384. However, the pump power was 30mW in that case. According to the simulation and experiment, for the current system, 18mW of pump power would be better. Therefore, we did more test with 18mW pump.
In the attached figure, some signal and noise levels are shown. From this plot, 18mW pump power seems to be not large enough. Indeed, we also tried to close anyway the loop with such small error signal. But we couldn't find a good filter configuration to make the loop closed proporly.
I confirmed the coating of the surface reference sample is on the side with the written part. Therefore the correct orientation is with that side first (i.e. facing the periscope).
The discrepancy between the current and old measurement as well as the slight asymmetry can be caused by not optimal alignment of pump beam.
Aritomi, Marc, Matteo
Today we cleaned a bit the computer room and brought the KAGRA spare to the clean room. We putted first contact on the surface facing outside the protection box.
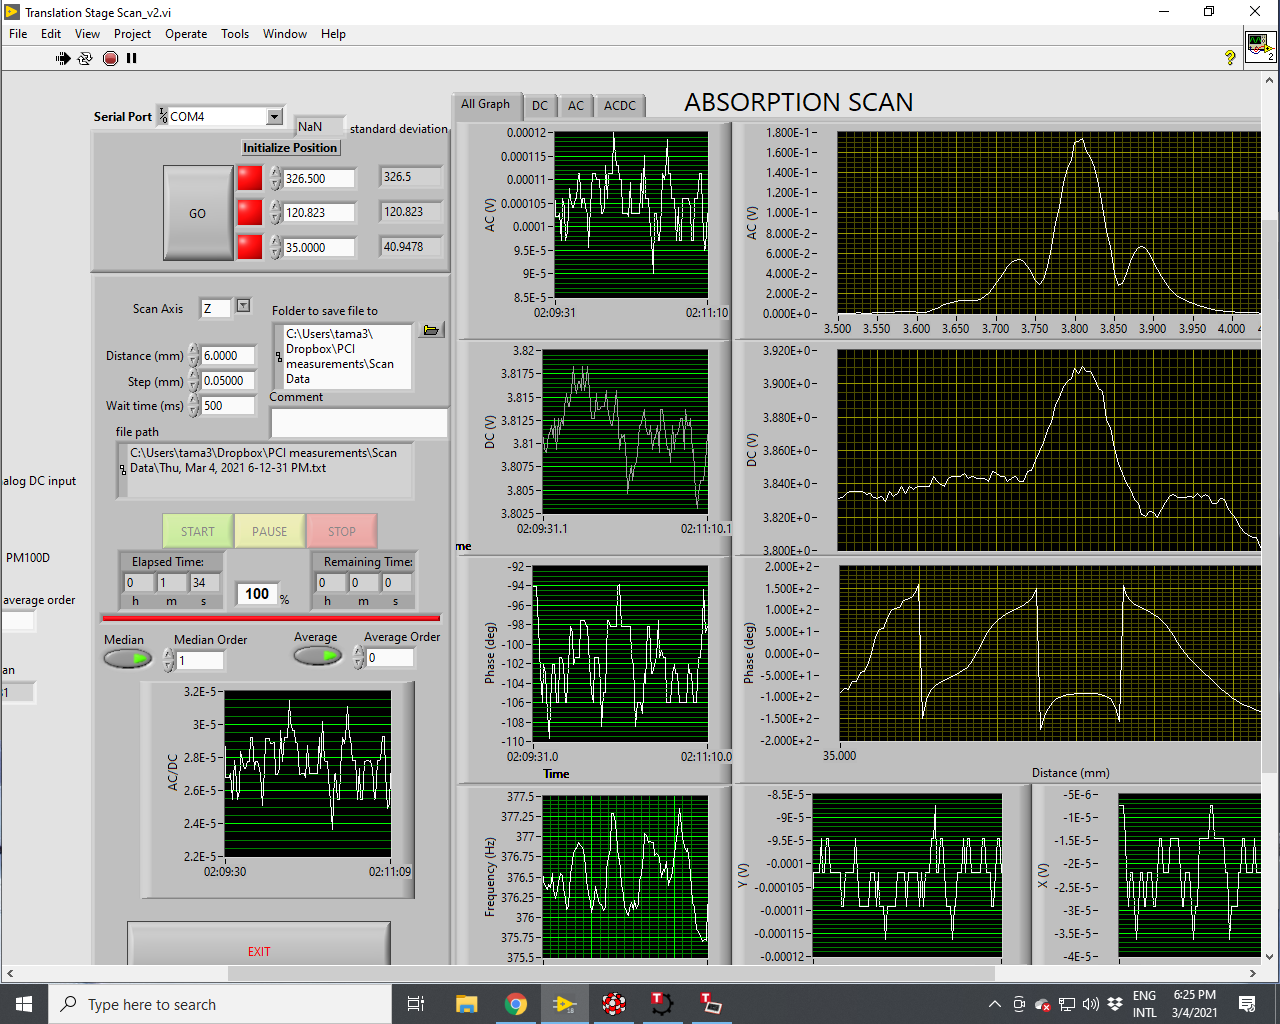
Then, we followed the realignment procedure described on the wiki and installed the surface reference sample to realign the setup with the goal of reproducing the calibration done in elog 1619 : R_surf = AC_surfref/(DC_surfref*P_in*abs_surfref) = 16.9 [1/W]
First, we putted the surface with the sample name facing the laser (PS : mirror center in z is 38 mm). Results are presented in figure 1 and gives (with abs_surfref = 0.22) : AC_surfref = 0.17V, DC_surfref = 3.91V, P_in= 16mW -> R_surf = 12.4 [1/W]
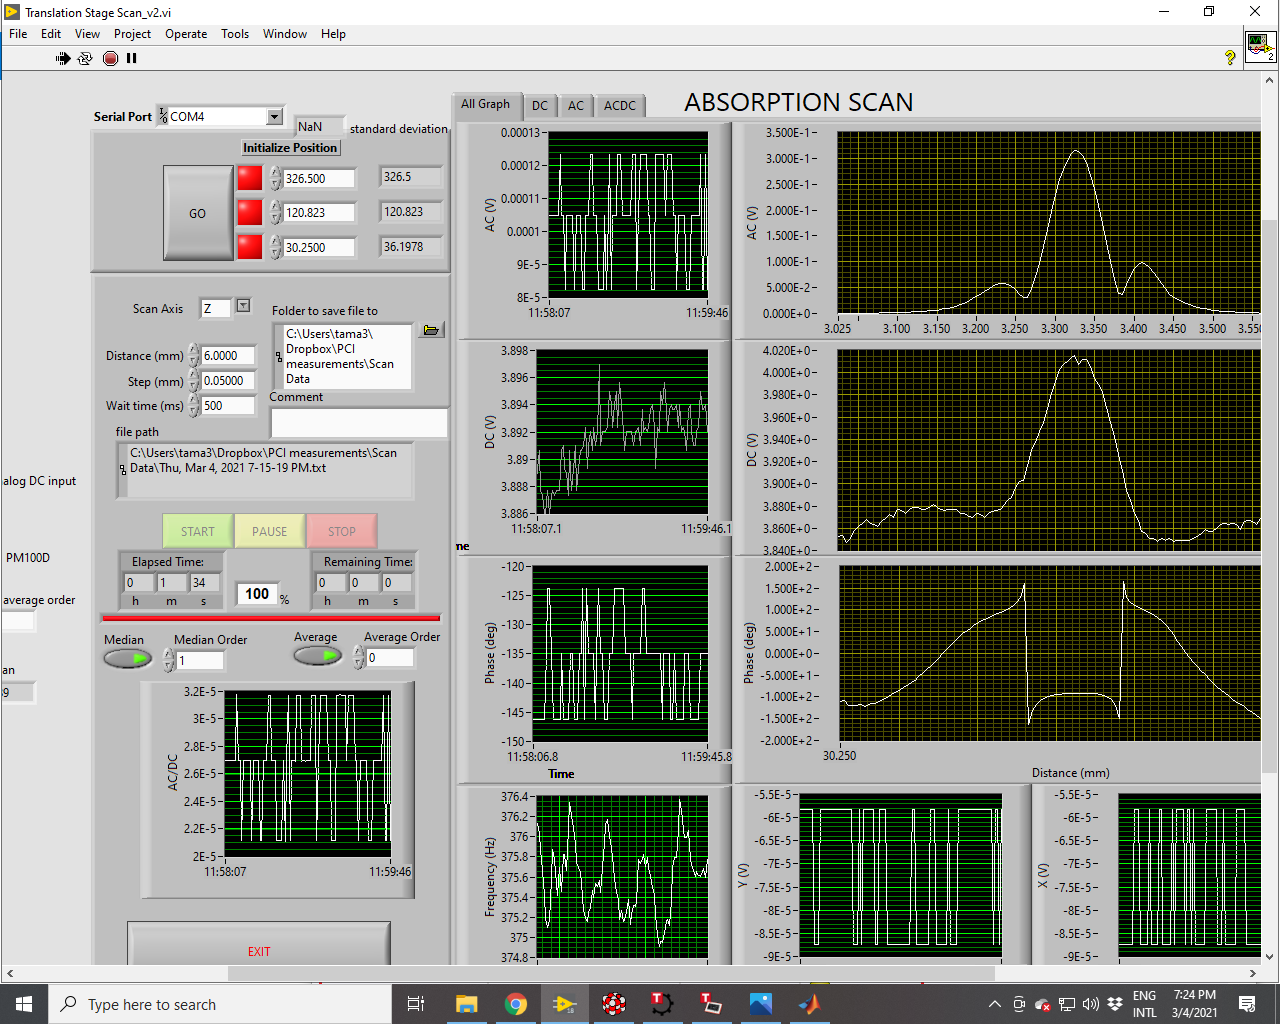
Then, we flipped the reference sample (PS : new center at 33.25 mm) to check if it could explain the discrepancy wrt to elog 1619.
During a scan, there were some troubles with some connections and we got several error messages from LabView... We had to restart the computer to use LabView again but there is still some troubles with the power-meter ( detected but not able to connect to the computer)
The result of this configuration is presented in figure 2 and gives : AC_surfref = 0.31V, DC_surfref = 4.01V, P_in= 15mW -> R_surf = 23.4 [1/W]
This time the AC measurement is not as symmetrical as expected so we'll further tune the alignment tomorrow.
I confirmed the coating of the surface reference sample is on the side with the written part. Therefore the correct orientation is with that side first (i.e. facing the periscope).
The discrepancy between the current and old measurement as well as the slight asymmetry can be caused by not optimal alignment of pump beam.
Marc, Matteo
We also notice that the readout photodiode is misaligned even without sample.
Michael and Yuhang
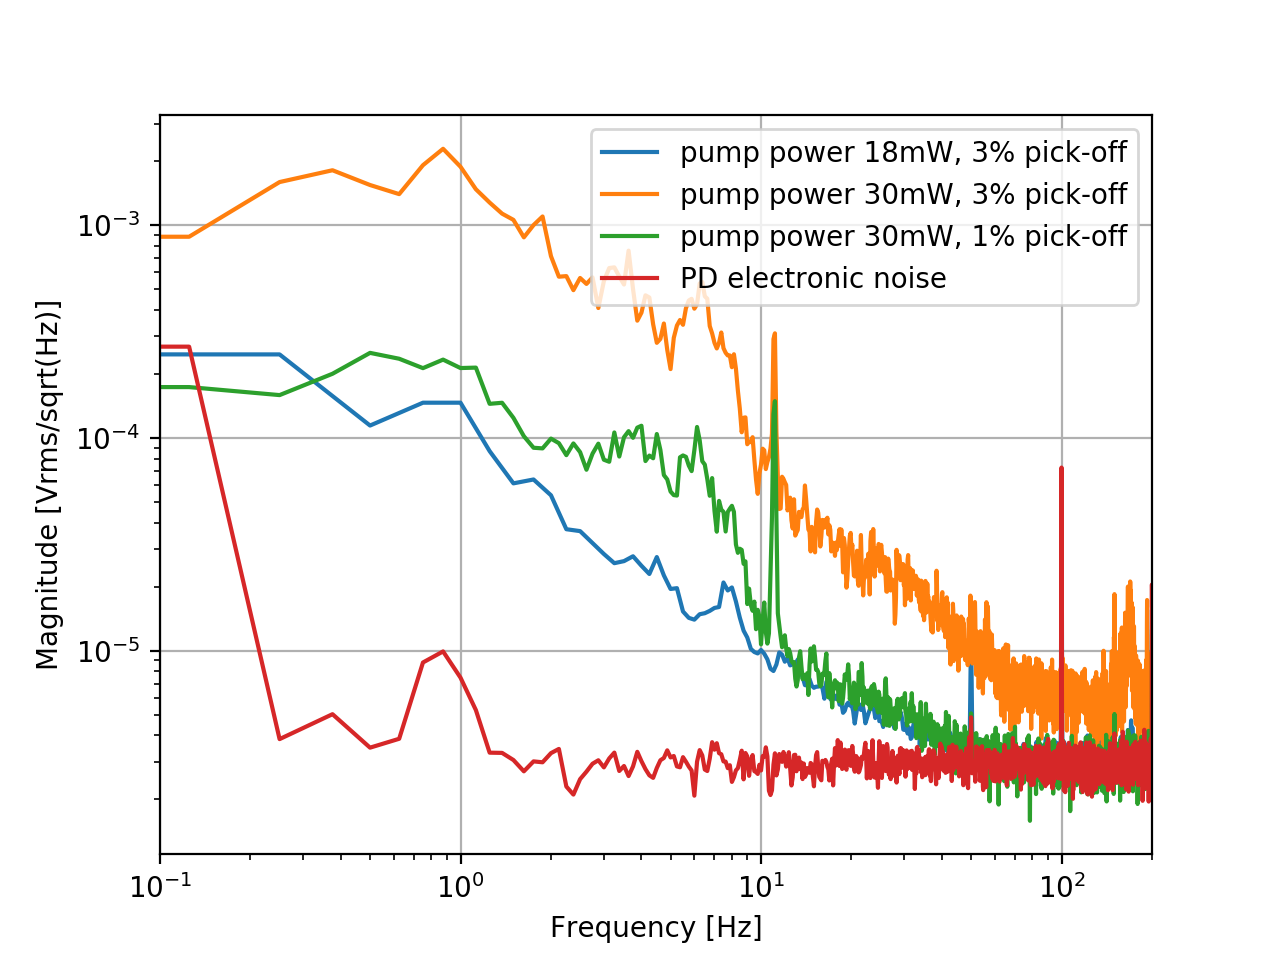
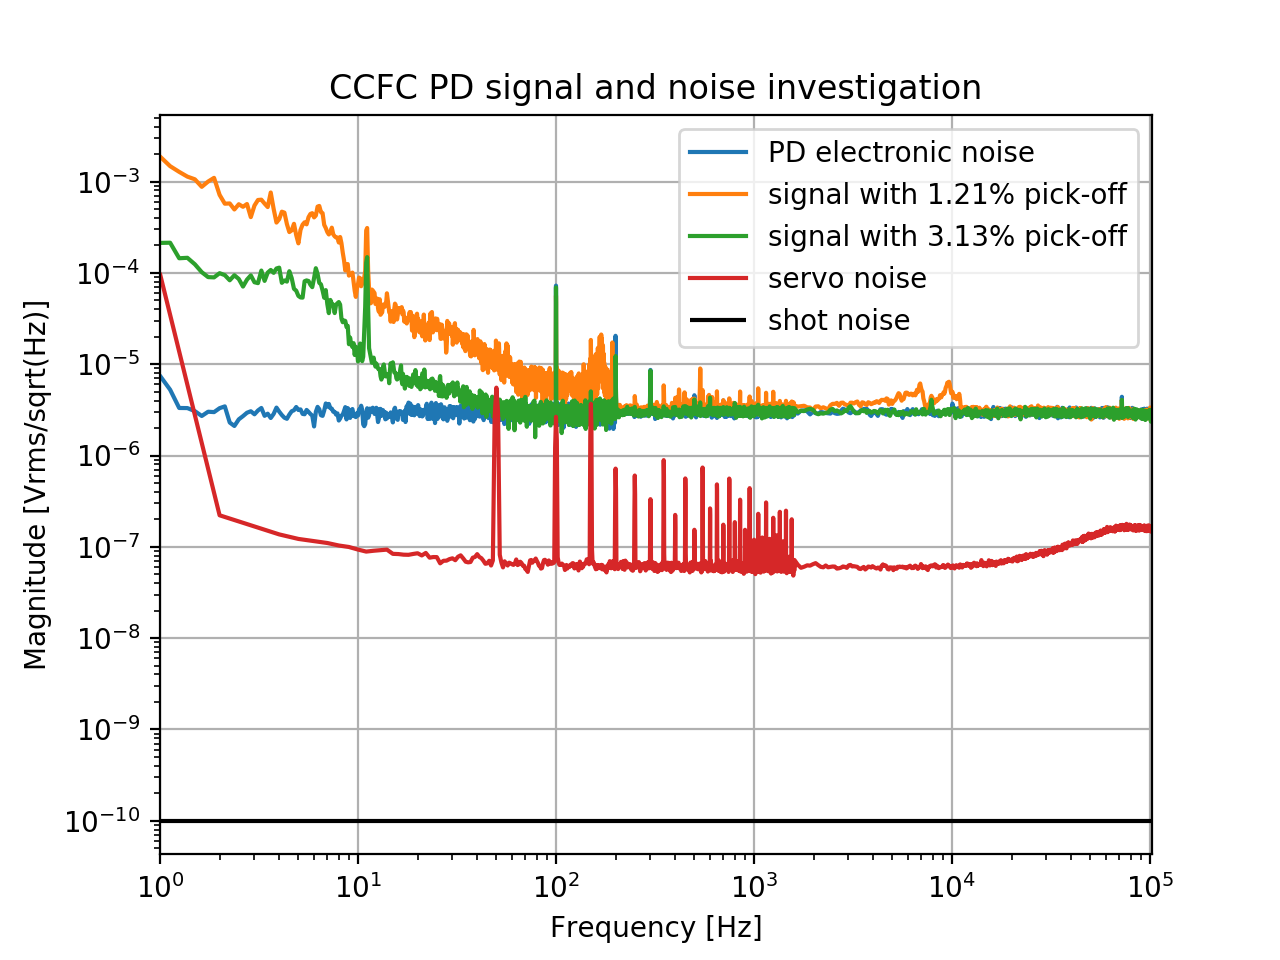
Today, we investigated various signal and noise level from CCFC PD. In addition, the servo noise is also added to be compared with signal level.
Attached figure shows their comparison. There are two signals measured in the figure. One comes from picking off signal with beam sampler(~1%), the other comes from BSN11(~3%). The splitting ratio was measured with power meter (offset has been subtracted).
From this measurement, BSN11 would be suitable for the signal pick-off. By using this signal, probably a bandwidth of ~50Hz could be achieved without reinjecting noise. We will try to lock FC with BSN11.
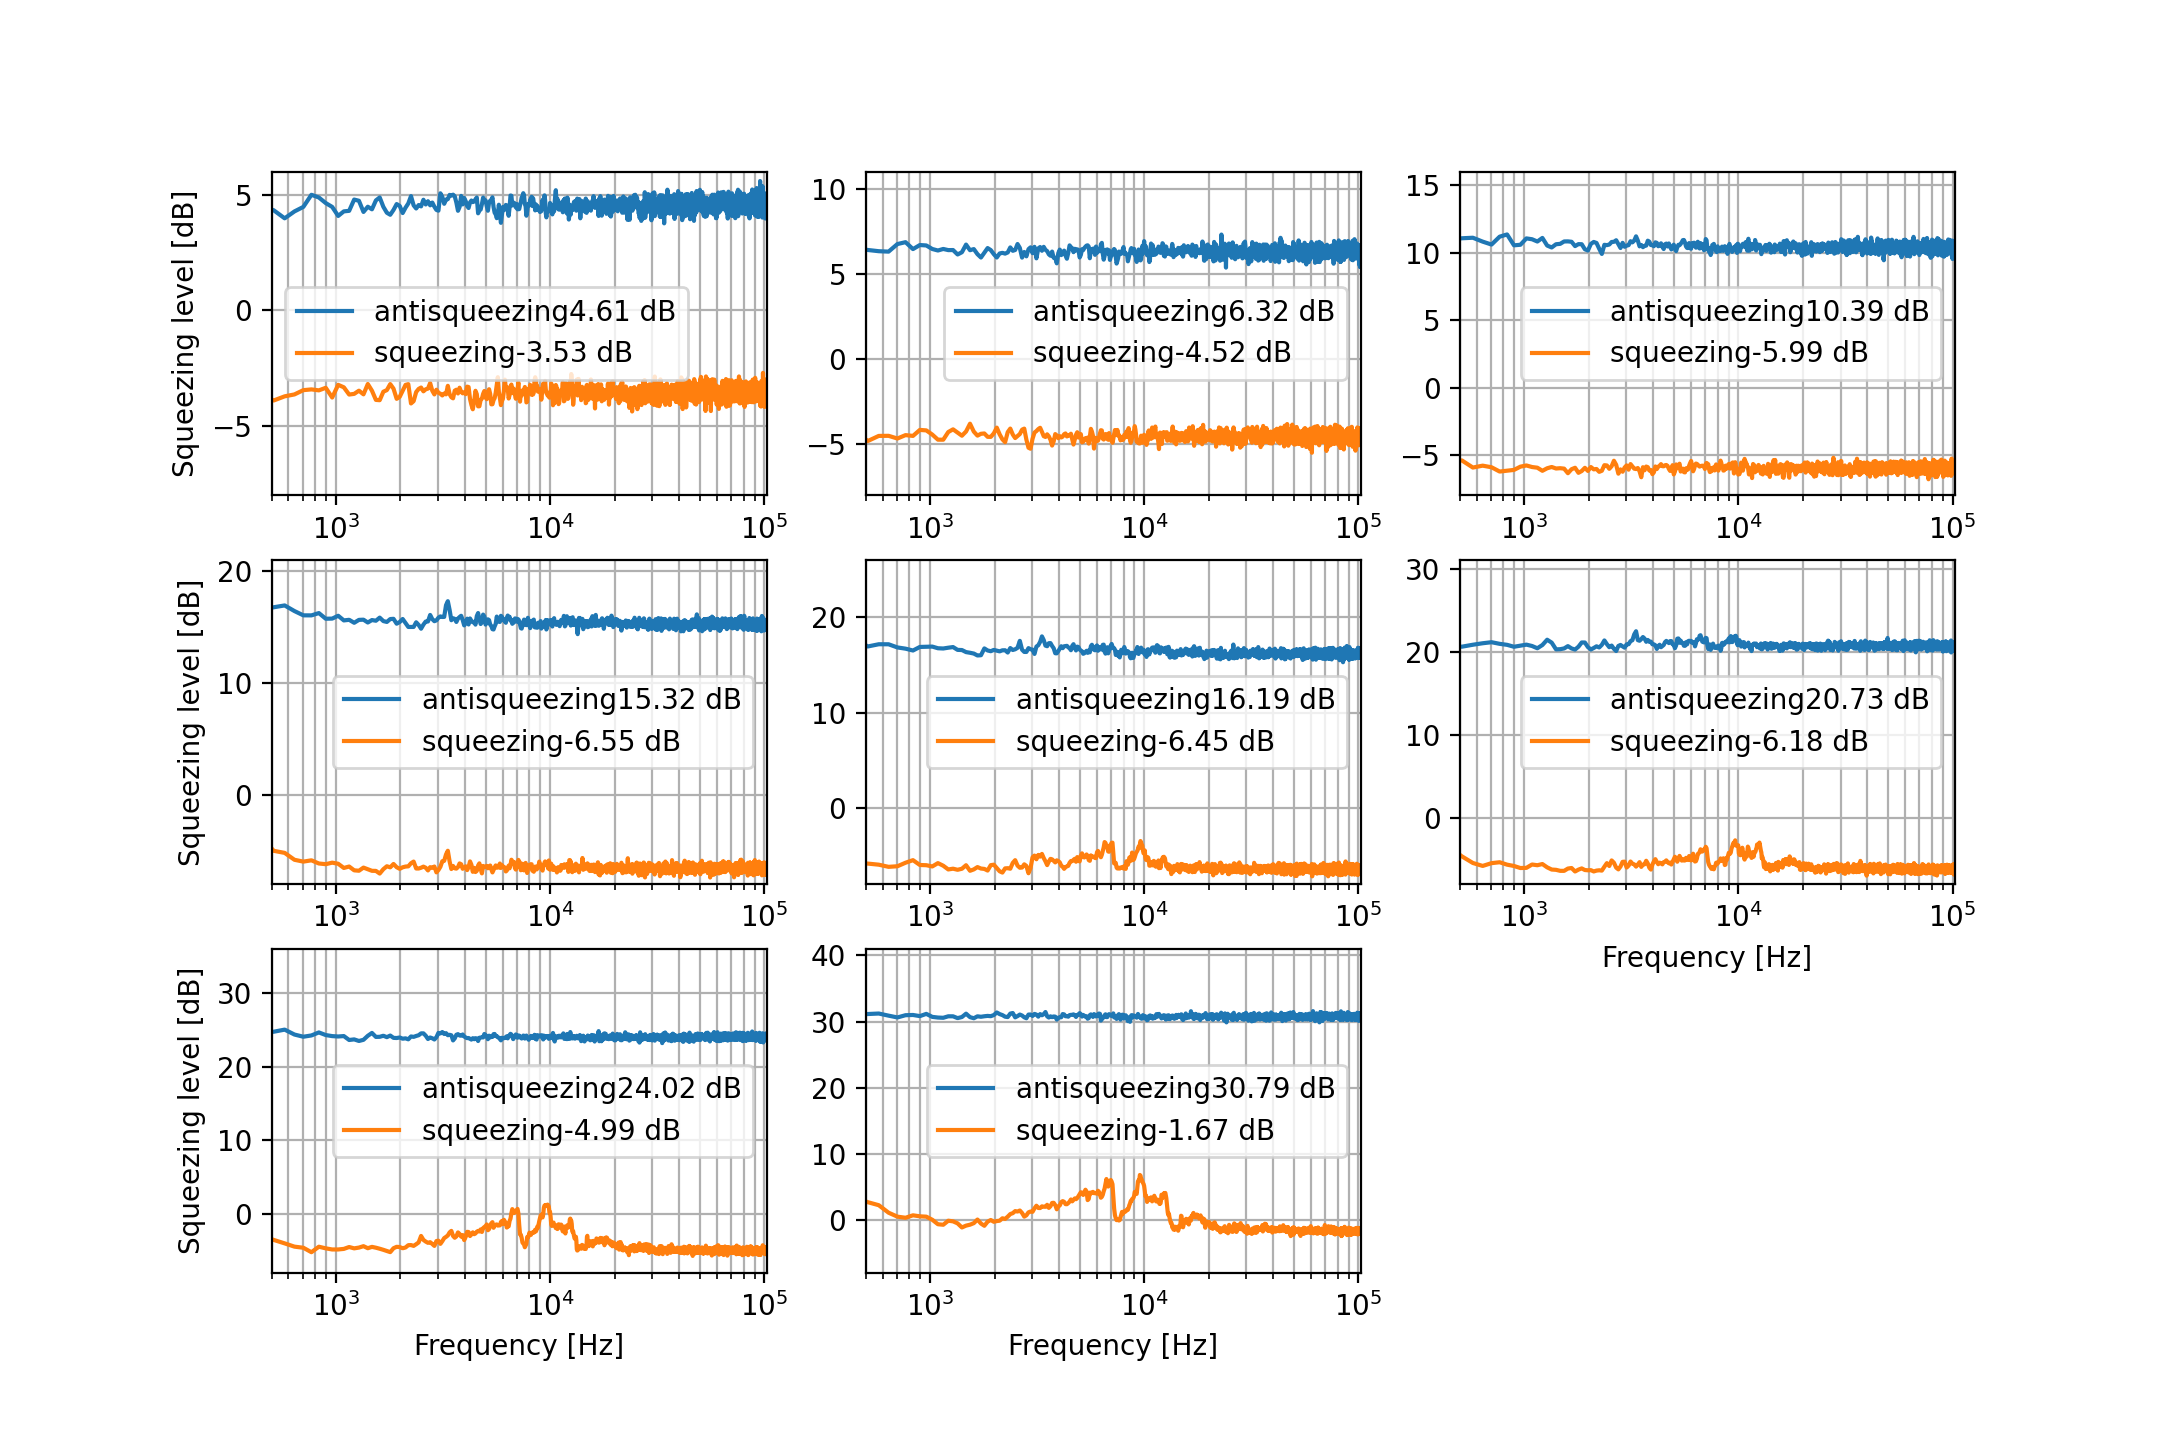
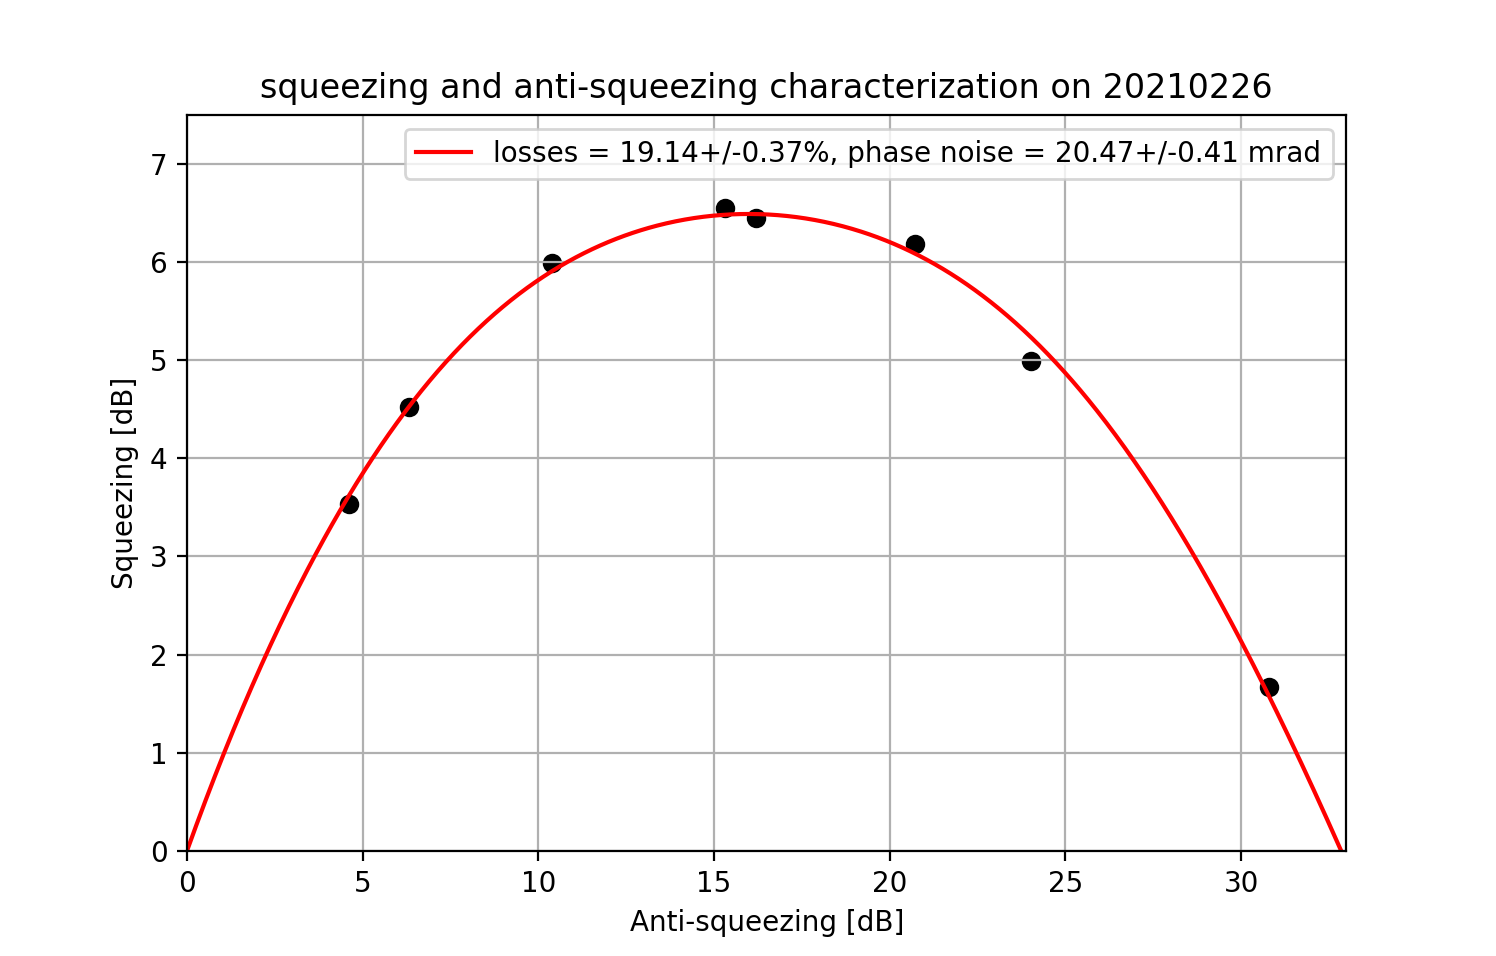
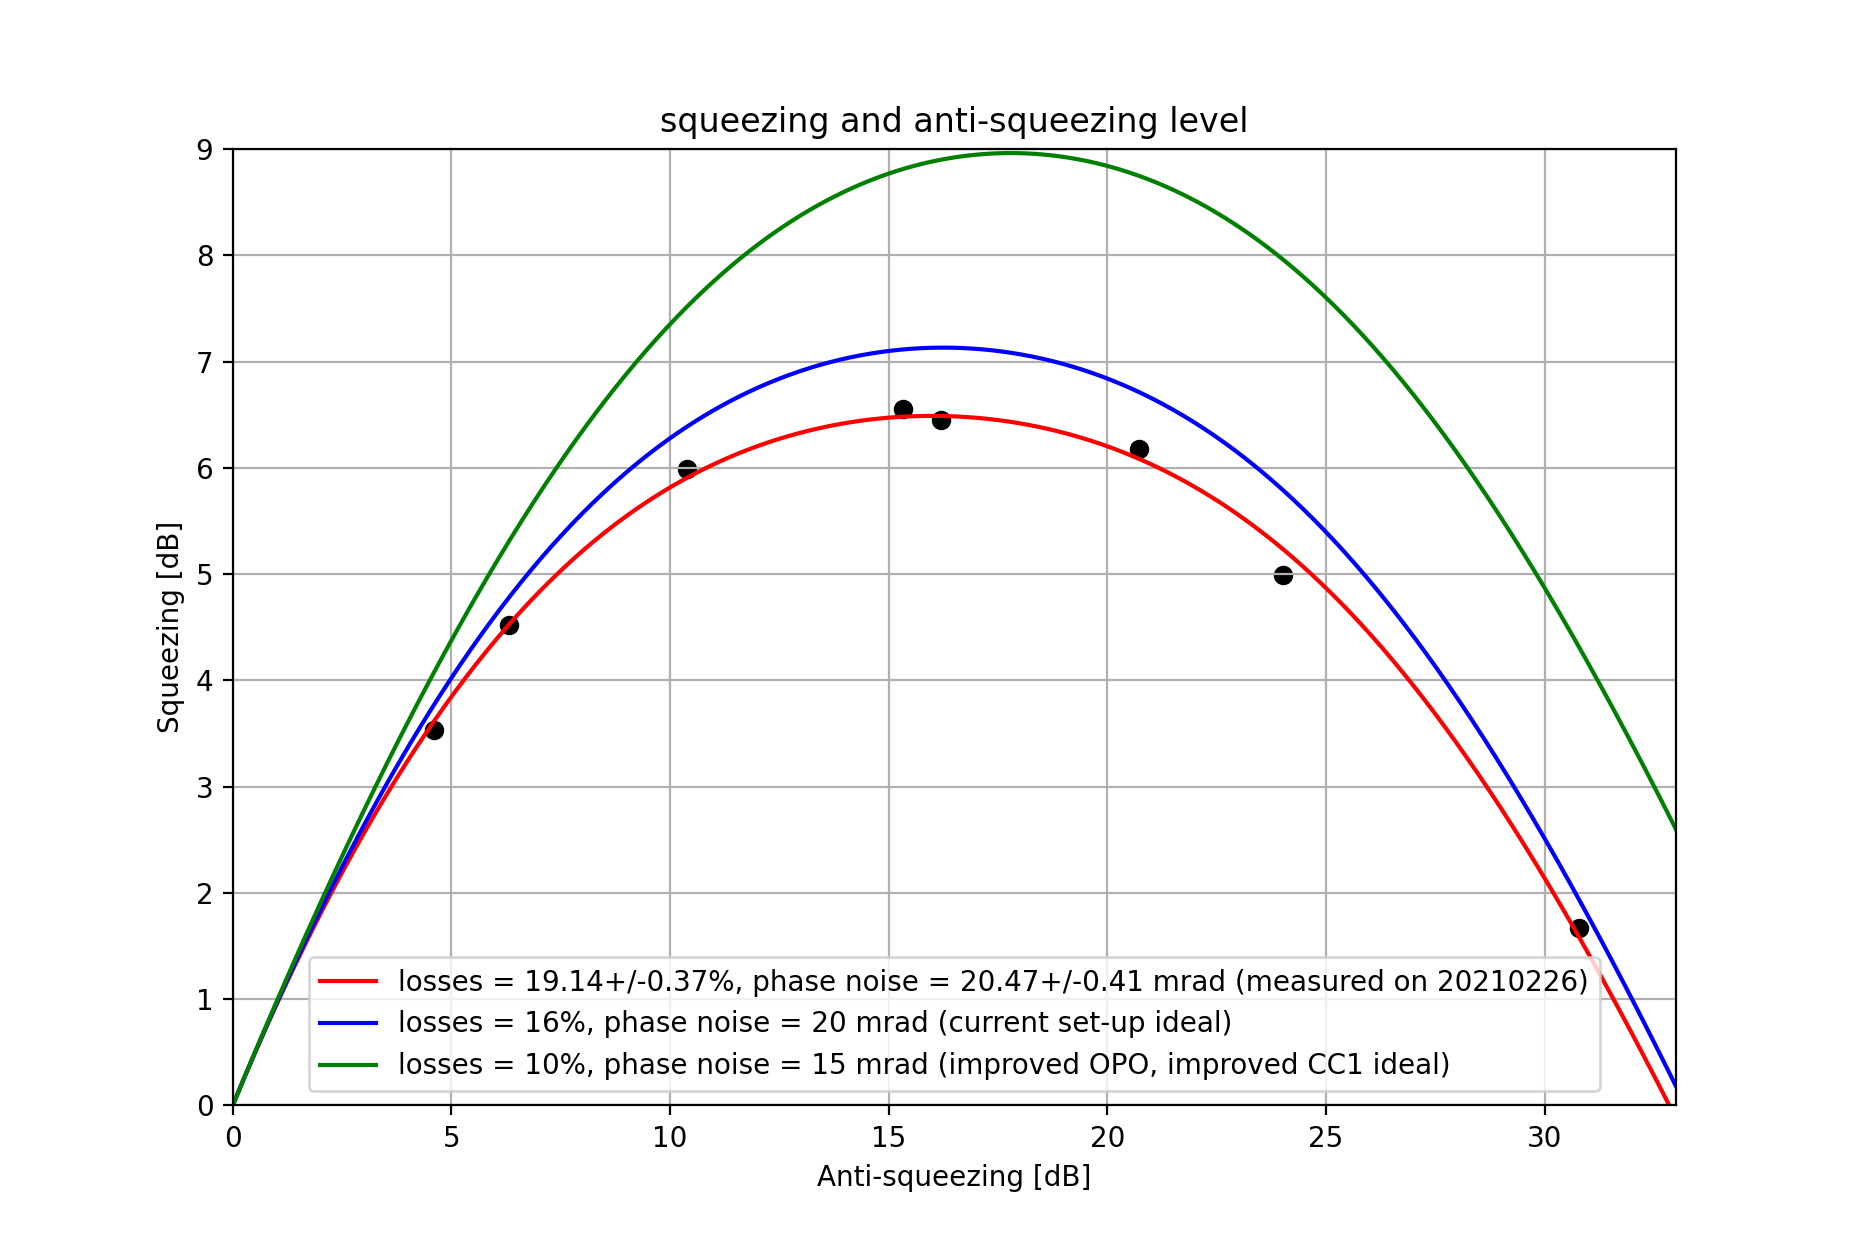
We made further anti-squeezing and squeezing measurement. This measurement indicates optical losses to be 19.1%, phase noise to be 20.5mrad.
Therefore, we still have 3% optical losses which are not known.
The ideal sqz-asqz for current set-up and improved set-up are shown as well.
Marc, Michael, Yuhang
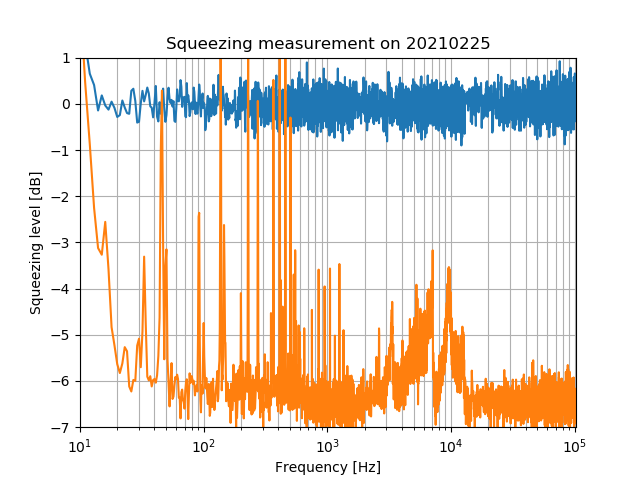
Recently, homodyne alignment was optimized. Frequency independent squeezing was remeasured. From this measurement, 6.5dB squeezing was measured. Compared with the measurement in elog1837, 1dB more squeezing has been achieved. The main difference between these two measurements is the homodyne alignment.
In this measurement, 37mW pump power was used. Therefore, there should be 15dB original squeezing.
If we assume 20mrad of phase noise, 6.5dB squeezing corresponds to 19% optical losses.
If we assume 30mrad of phase noise, 6.5dB squeezing corresponds to 17% optical losses.
The old measurement was indicating 26% optical losses. Therefore, at least 7% optical losses has been reduced.
The known losses are 1-(1-7e-2)*(1-1e-2)*(1-3e-2)*(1-2e-2)*(1-3e-2)*(1-1e-2) = 16%. 7% OPO intra-cavity losses, 1% dichroic mirror, 3% Faraday isolator, 2% mirror and lens losses, 3% homodyne efficiency/quantum efficiency, 1% classicial noise. Therefore, about 1% to 3% optical losses are not figured out. We will make more characterization tomorrow.
We made further anti-squeezing and squeezing measurement. This measurement indicates optical losses to be 19.1%, phase noise to be 20.5mrad.
Therefore, we still have 3% optical losses which are not known.
The ideal sqz-asqz for current set-up and improved set-up are shown as well.
Marc, Yuhang
Today we got the FC flashes back.
We acted on all picomotors to realign the beam and remove the OpLev offset.
We then took spectra of the OpLev signals and saw that the End Mirror one showed a broadband increase of the noise floor.
This was due to one of the steering mirror screw being almost loose. Therefore we put it to a better situation and compensated it by acting on the steering mirror on the OpLev laser bench.
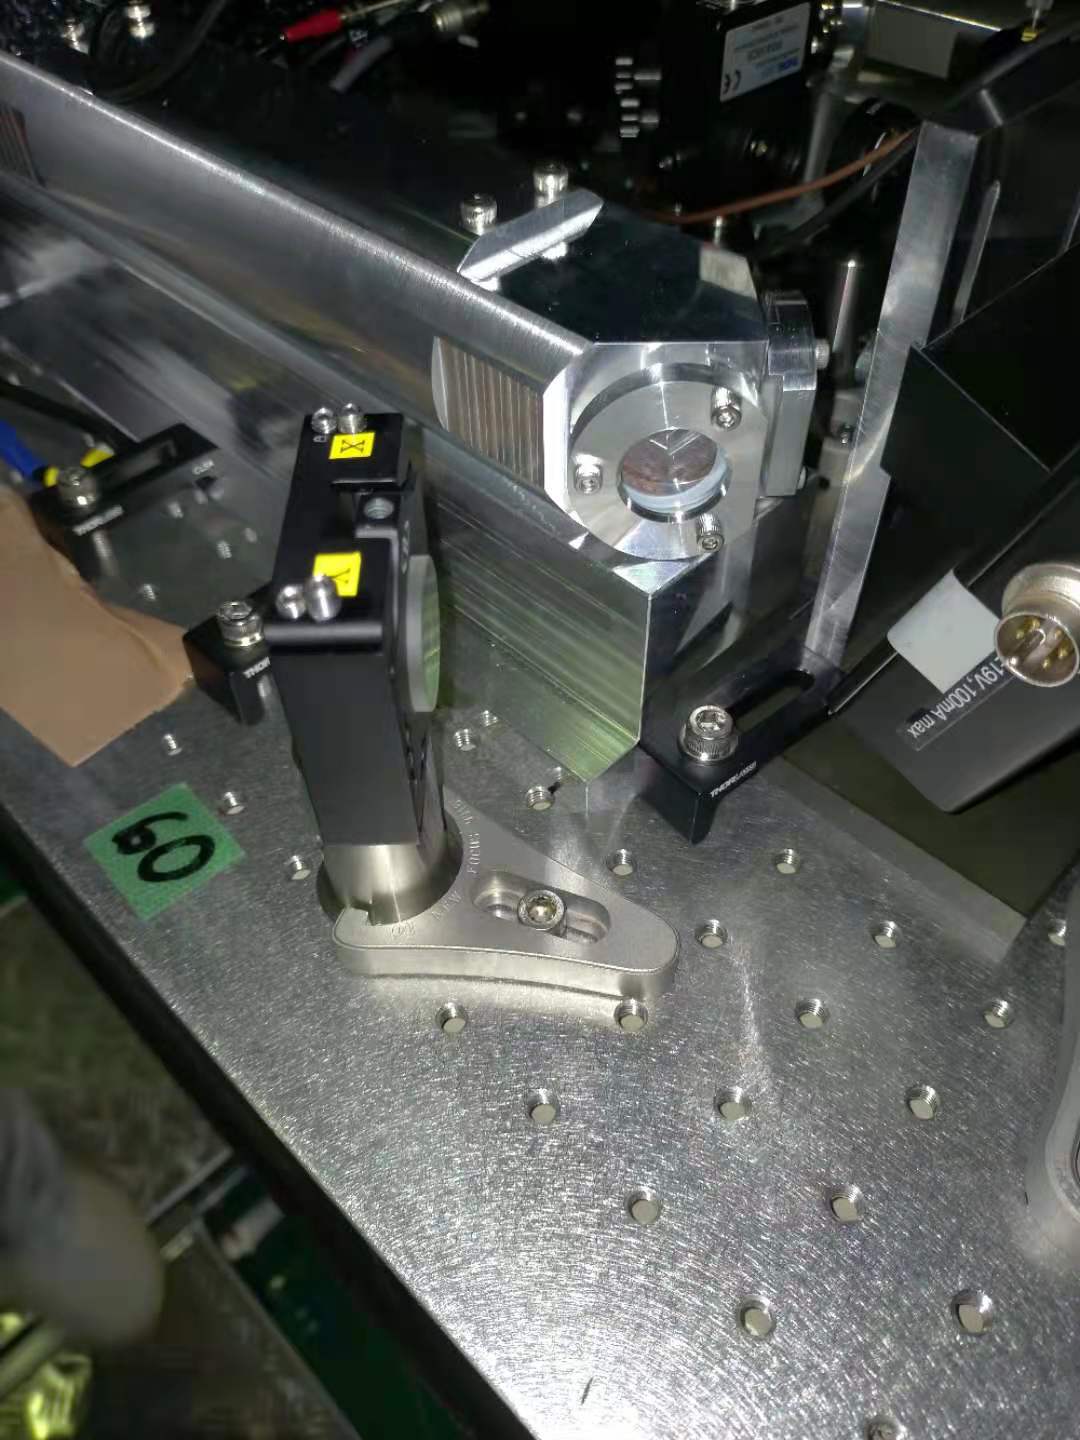
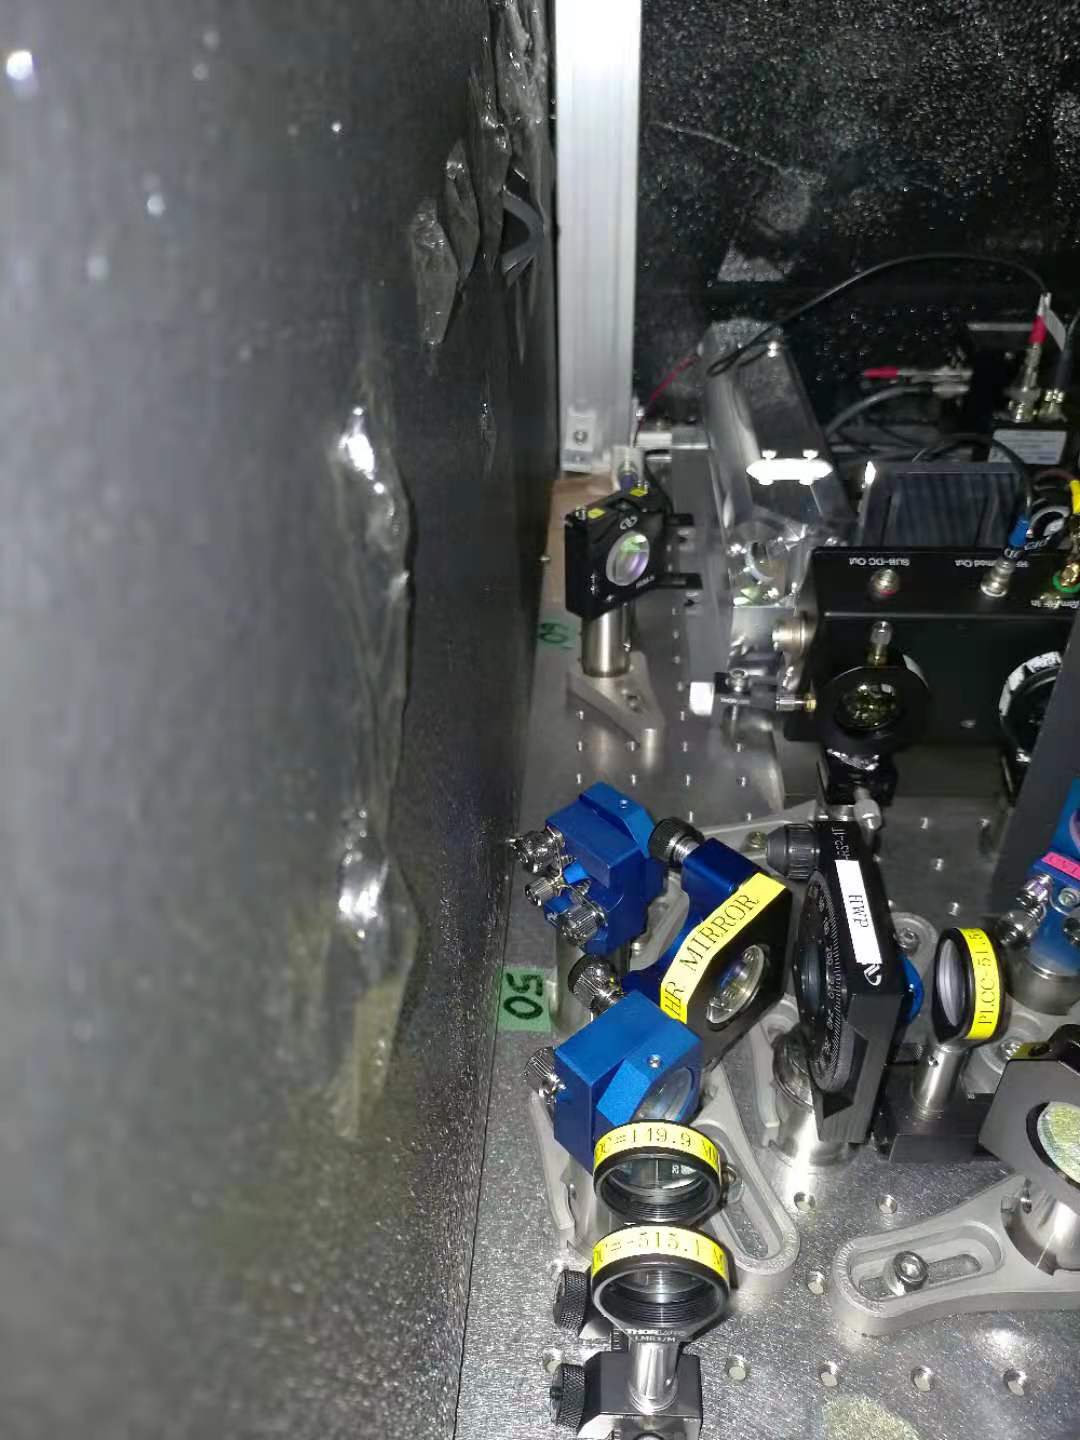
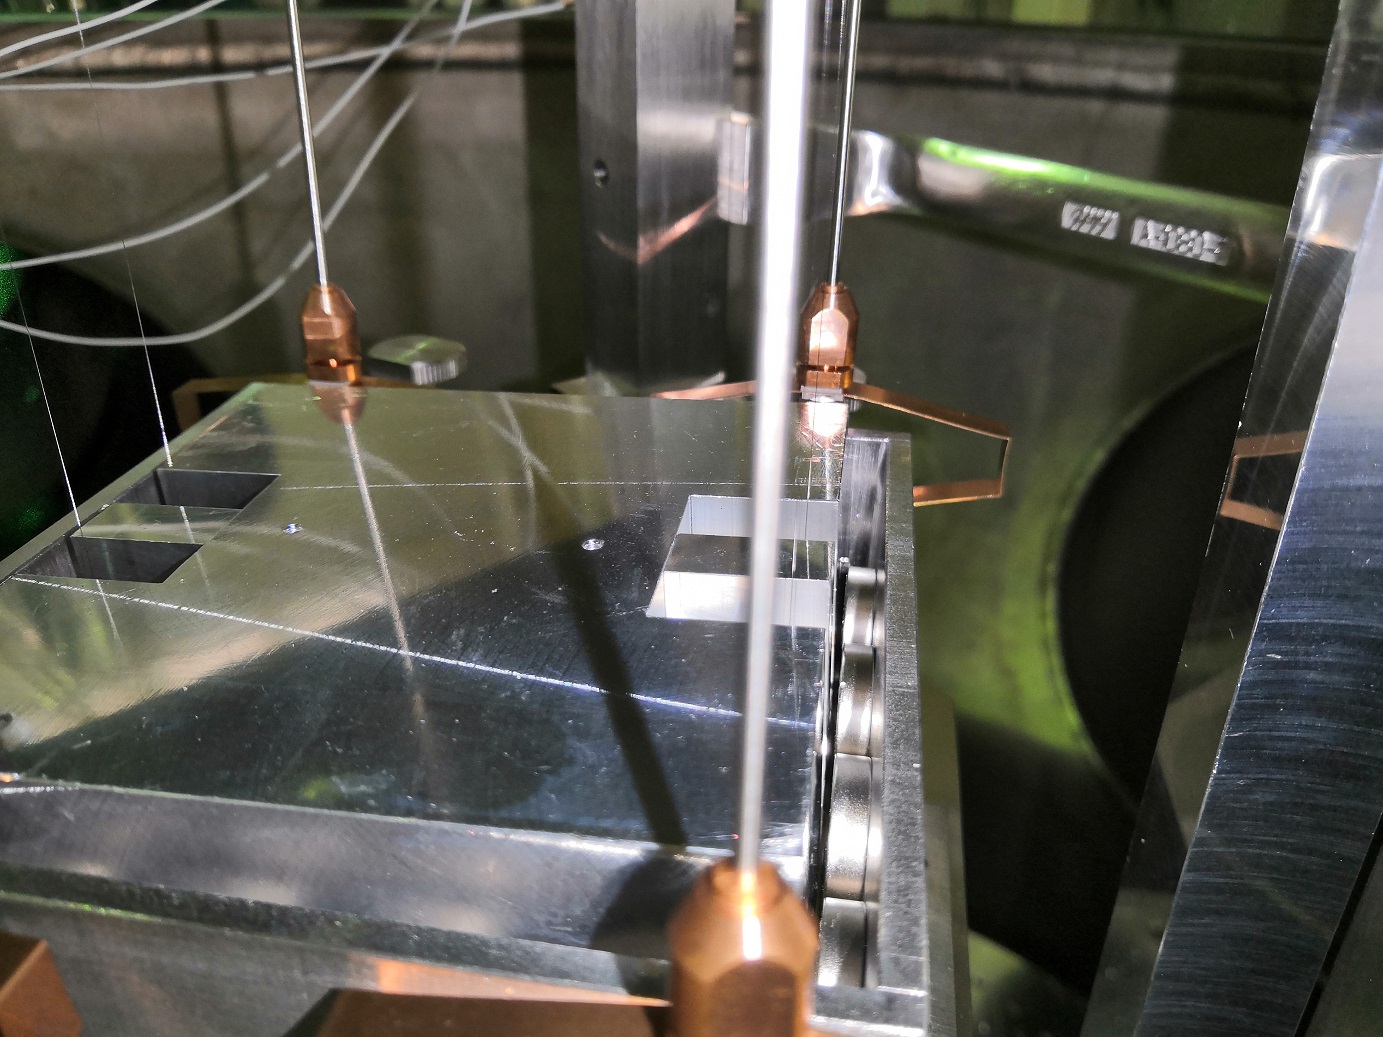
We also changed the optical density before the End Mirror PSD as it was previously not so well fixed (fig 1 : current situation)
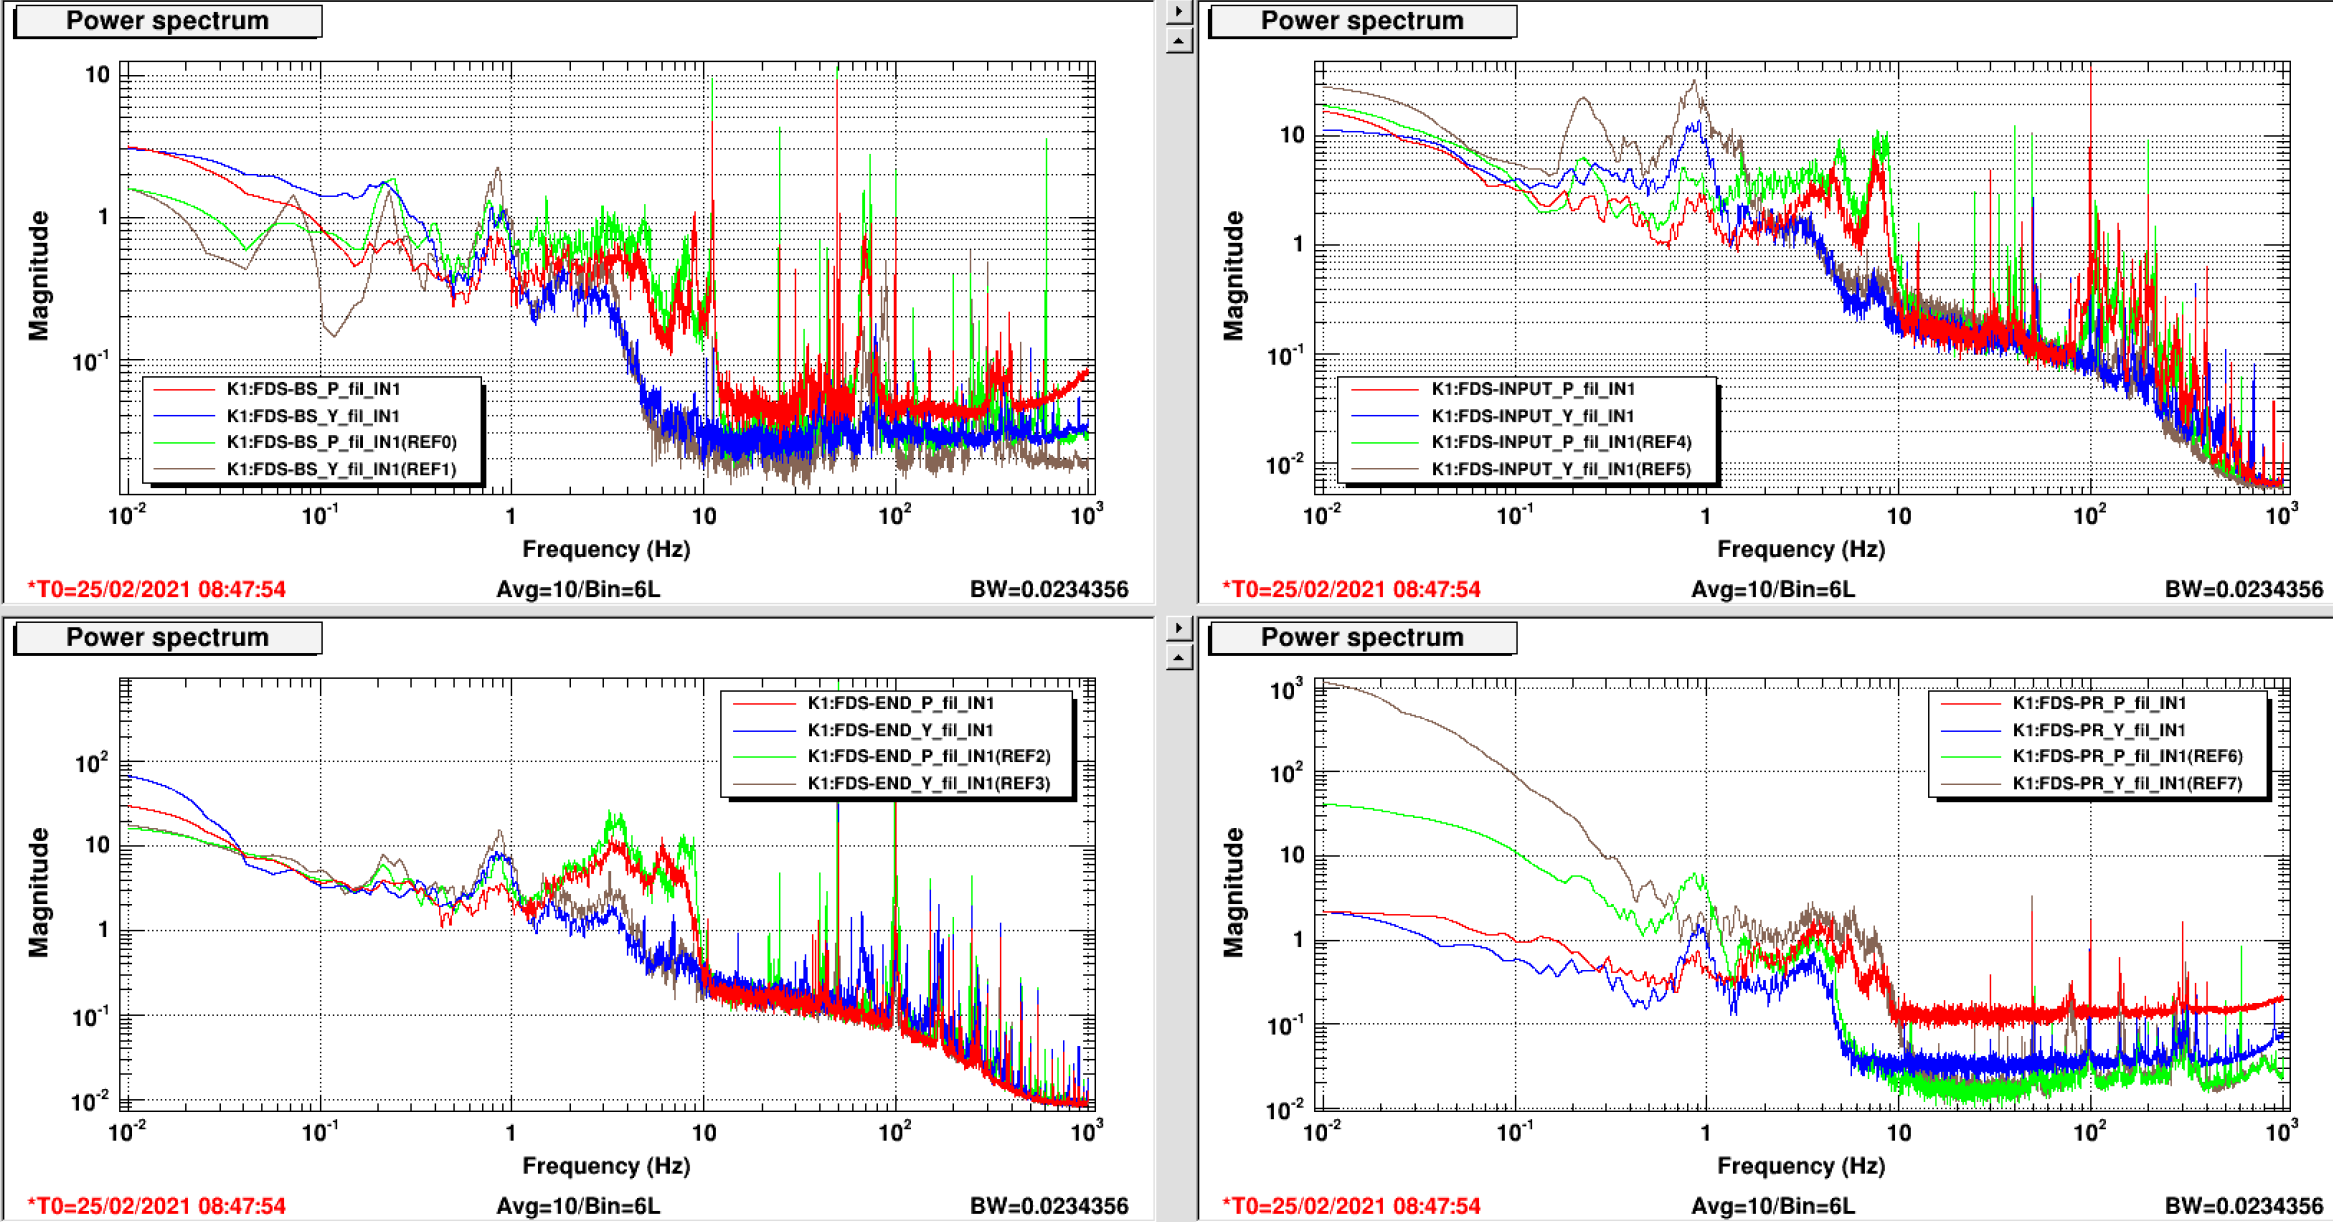
The current Oplev spectra are represented in Fig2 with green/brown the references and blue/red the current ones :
- PR and BS show the high frequency noise increase that we hope to solve by using the KAGRA QPDs
- End pitch exhibits a new peak on pitch around 6 Hz
- BS pitch exhibits a new peak on pitch around 9 Hz
Before locking the FC we would like to further tune the OpLev. Indeed, we fixed all their optics but then did not retune the PSD positions nor check the diagonalizations.
These may explain the new peaks on BS and End Mirror as their optics were moved quite a lot
PS : the second target is on remote mode and End mirror picomotors have been disconnected
[Takahashi, Matteo, Yuhang, Marc, Michael, Aso]
We opened the BS chamber and recovered the suspension.
- Opend the BS chamber from the top.
- Checked the status of suspension. The gap between the south-west side of IM and the IRM (magnet box) was too small (<0.5mm).
- Shifted the suspension point of IRM to south-west. The gap became larger (>1mm).
- Measured the TF of suspension. It was consist with the previous one.
- Aligned the BS using the IR beam.
- Closed the chamber and started evacuation. Opend the GV for the TMP on BS after the evacuation with the big RP.
The KAGRA QPDs will be used for the TAMA OpLev.
In order to prepare their installation, I checked the available space for these QPDs.
The most critical one is the Input Mirror ones : there is only a lateral space of 70 mm between the various beams. Also, the longitudinal space between the first QPD and the end of the window optical table is 60 mm.
As the KAGRA QPDs have horizontal size at the order of 62 mm (and vertical 73 mm) , it will be required to design our own cover box.
For all the others OpLev there sould not be any critical space constraints