NAOJ GW Elog Logbook 3.2
YuefanGuo - 00:42, Thursday 11 May 2017 (465)
Measure the green beam
According to Matteo's suggestion, the beam waist and size of the green and infrared may have some different, so it is better to measure the green beam come out from the cavity.
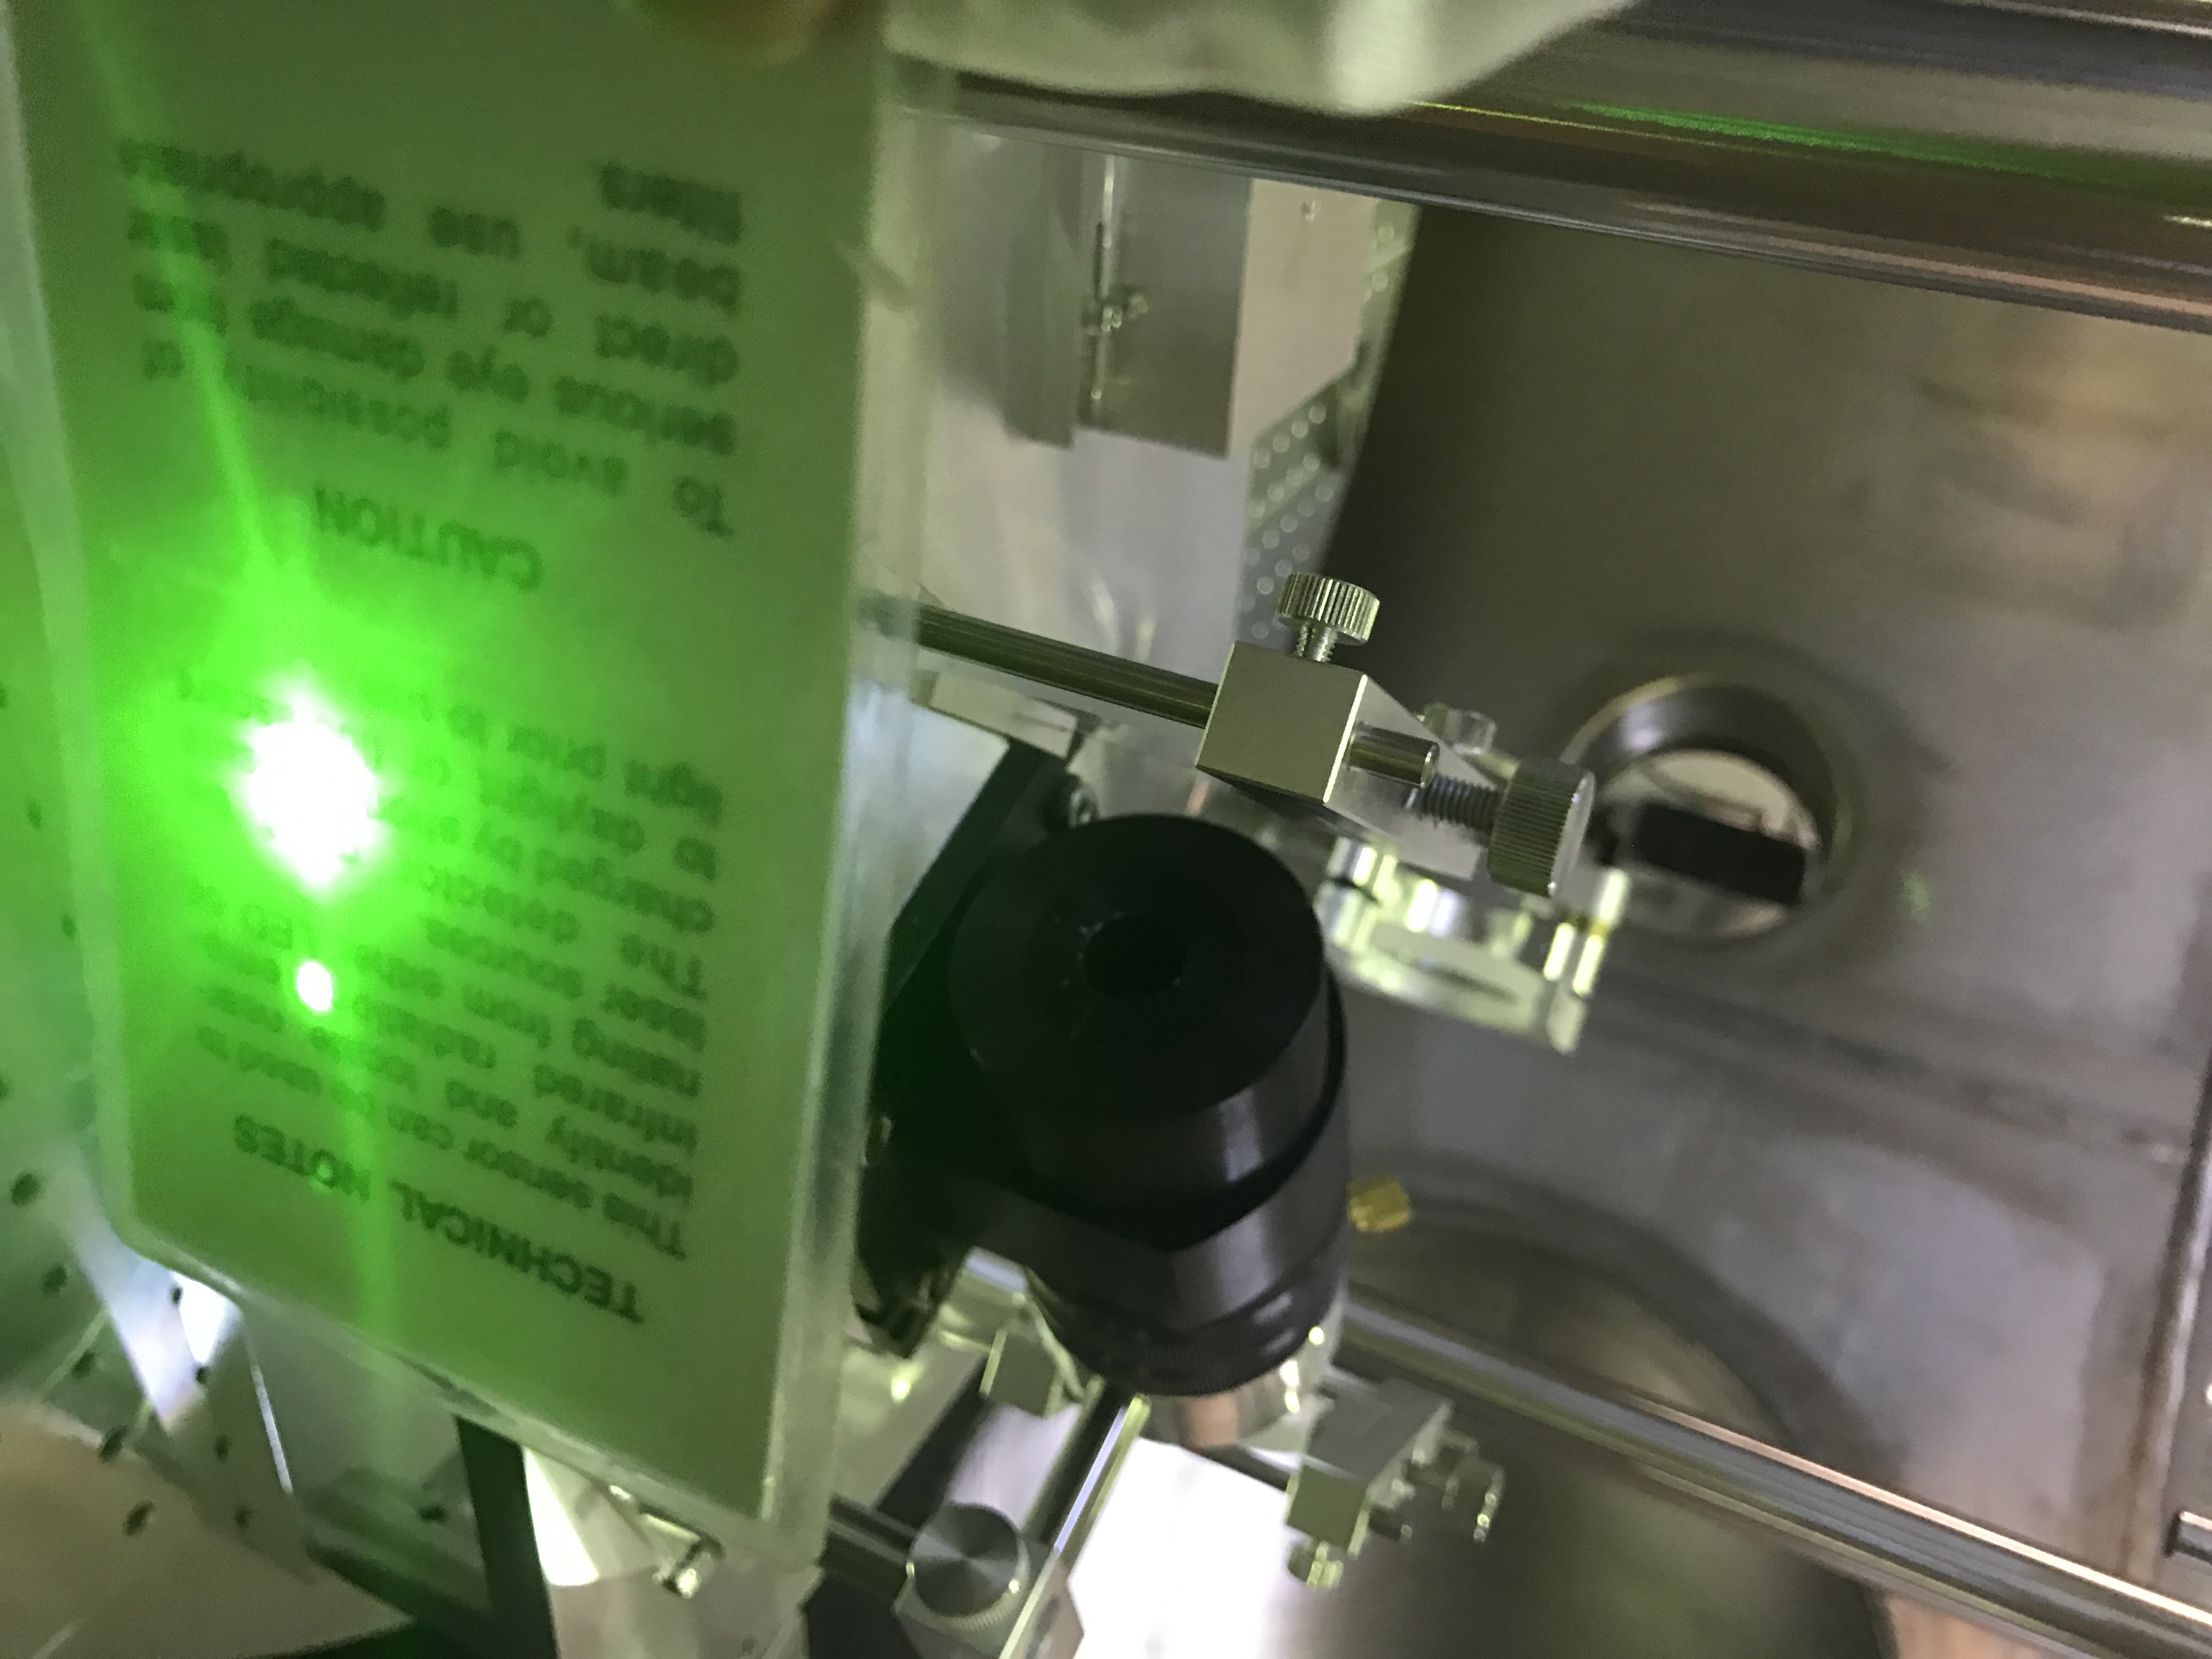
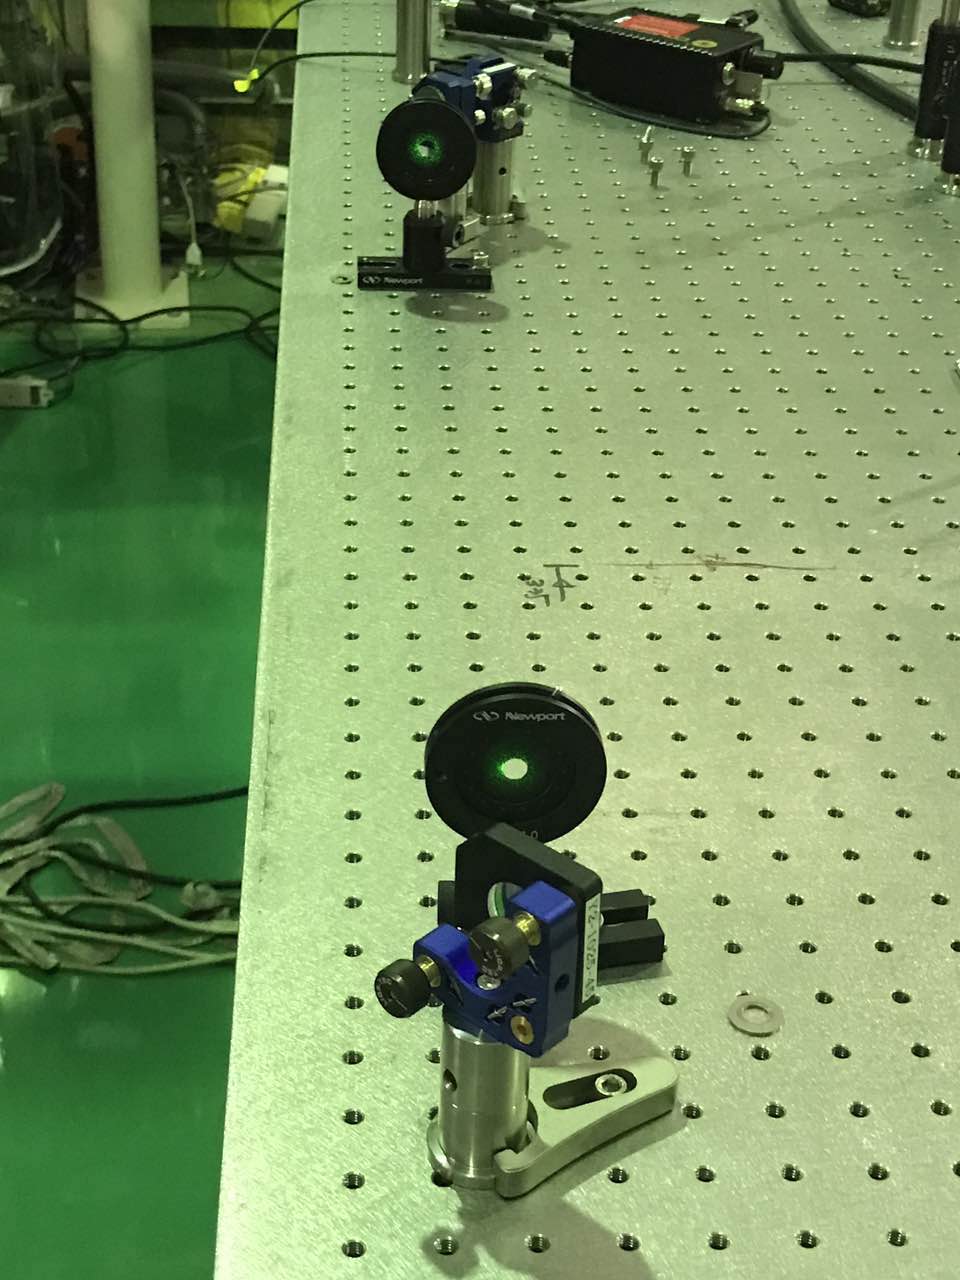
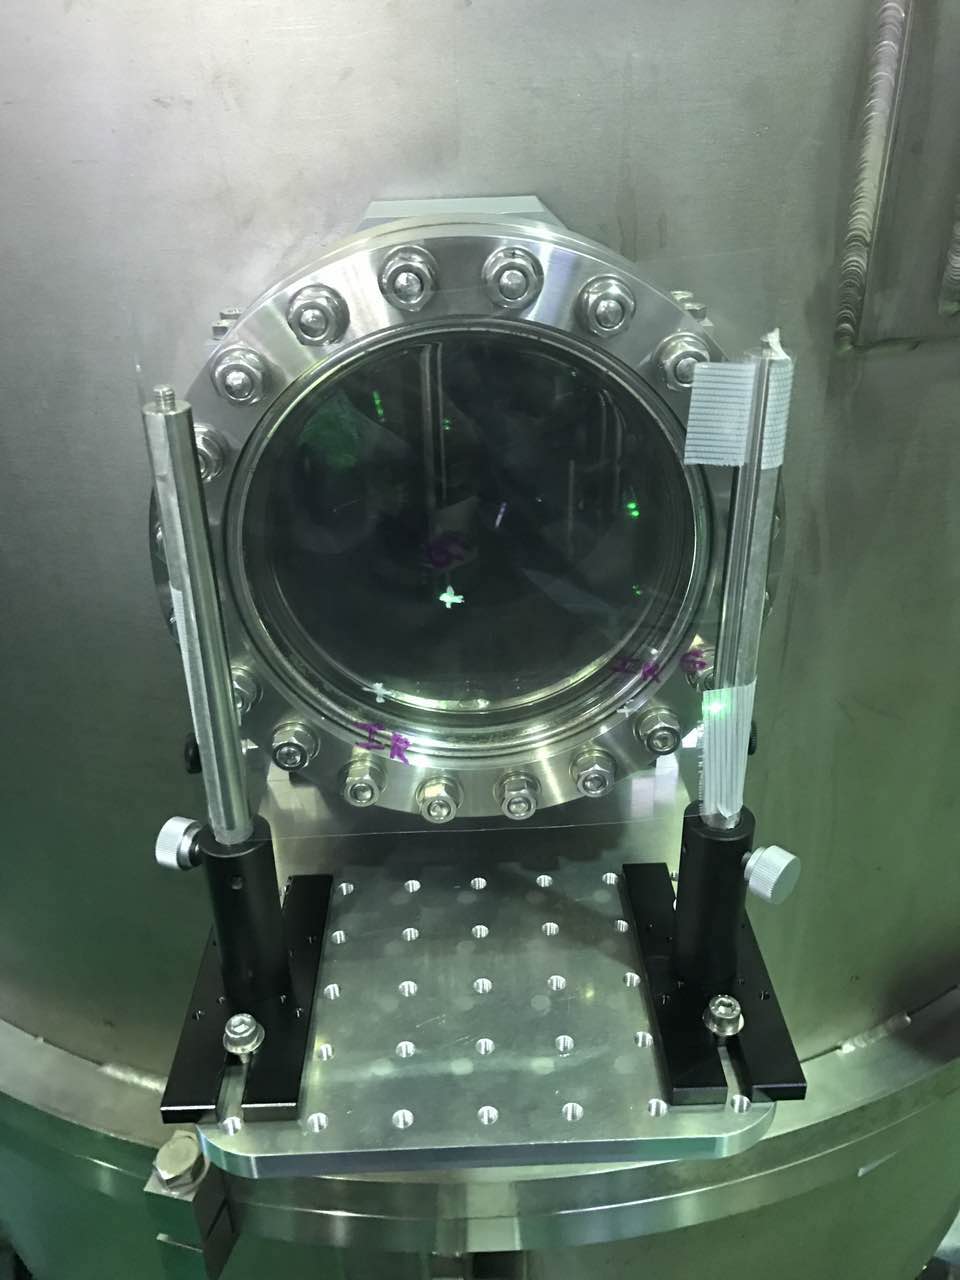
So today we remove the two dichroic, the lens and Faraday, finally we had enough space to put the beam profiler and do some measurement, but even like this, we only can took three points,after the third point, we still had space but the beam size is too large to measure. The beam profiler has two axis,v and w, the first time we took three data points, two of them is fine, the beam size in two axis is similar, but one point had a large difference. So after the calculation, the beam waist and position in these two axis is very difference(one has half size of the other). Then we did the second measurement, this time the result is good, and we got the beam waist size was 36 micrometer instead of 52 micrometer(the beam waist size of the infrared), and the beam position is 15.5cm away from the input port of cavity instead of 7.5cm(infrared).
Although we got this result, we still have the suspect that maybe the astigmatism is from the cavity, since the beam size is too large, the measurement may have some error.
Then because we already remove the dichroic, we tried to turn it to make the two beams from two surface of the mirror can be separated. But we turned the mirror little by little almost 360 degree, the two beam still become into one. So we thought maybe the wedge is too small, even it separate the two beam, but the beam size increase too quickly, then the main beam will cover the other.
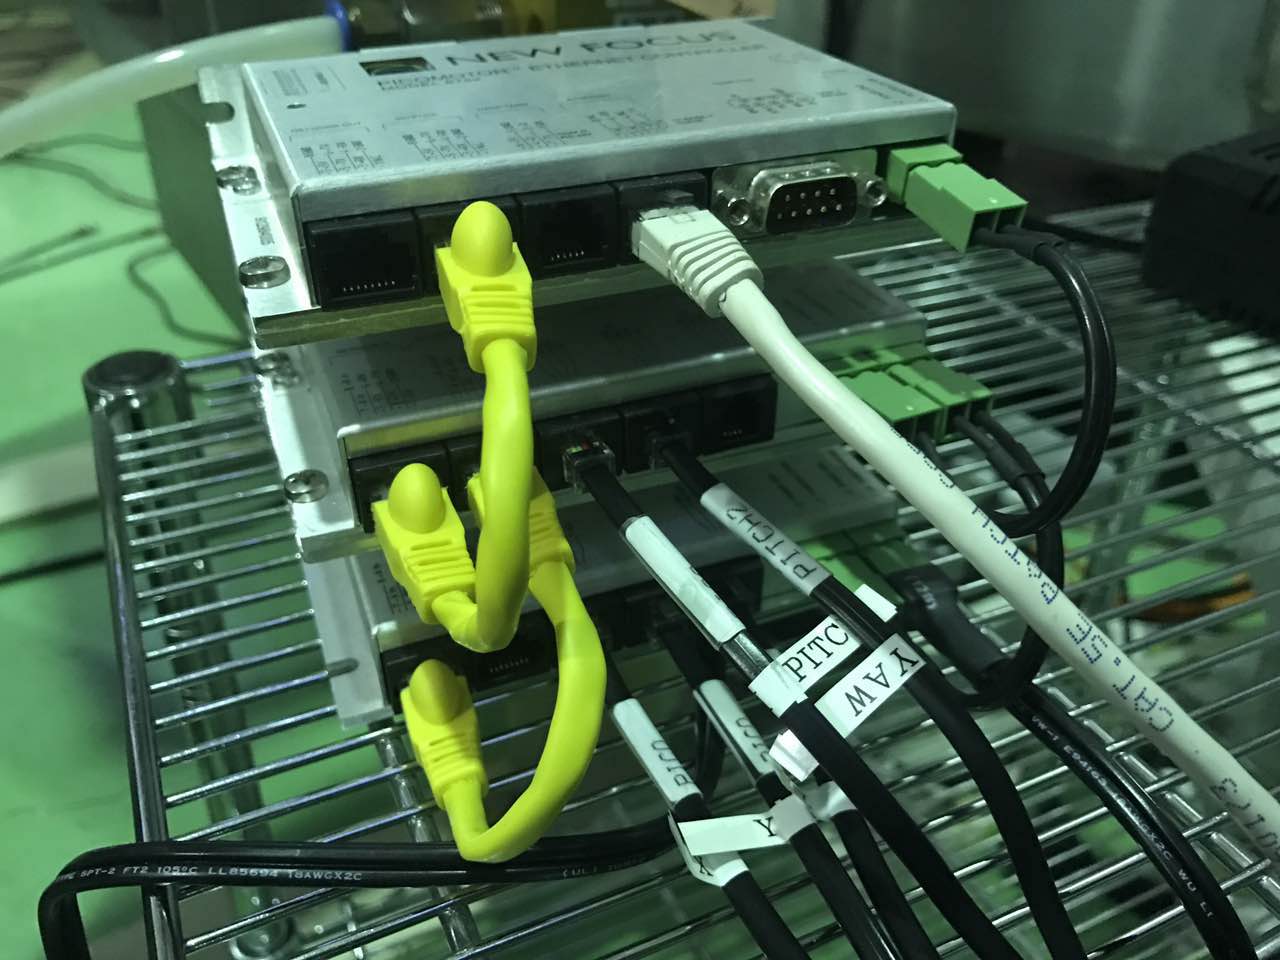
Before the holiday, we found out the picomotor which controls the yaw of BS mirror cannot be controlled by the computer. And we checked the cable, from the driver to the connected part of the picomotor and the cable, it works well. Also we exchanged the port between pitch and yaw, after pitch works well, so the problem is also not from the driver. So Marc checked again the picomotor, he thought the problem is inside the picomotor,and we planned to change the it after we finished the green path and need to align the beam.
So today we remove the two dichroic, the lens and Faraday, finally we had enough space to put the beam profiler and do some measurement, but even like this, we only can took three points,after the third point, we still had space but the beam size is too large to measure. The beam profiler has two axis,v and w, the first time we took three data points, two of them is fine, the beam size in two axis is similar, but one point had a large difference. So after the calculation, the beam waist and position in these two axis is very difference(one has half size of the other). Then we did the second measurement, this time the result is good, and we got the beam waist size was 36 micrometer instead of 52 micrometer(the beam waist size of the infrared), and the beam position is 15.5cm away from the input port of cavity instead of 7.5cm(infrared).
Although we got this result, we still have the suspect that maybe the astigmatism is from the cavity, since the beam size is too large, the measurement may have some error.
Then because we already remove the dichroic, we tried to turn it to make the two beams from two surface of the mirror can be separated. But we turned the mirror little by little almost 360 degree, the two beam still become into one. So we thought maybe the wedge is too small, even it separate the two beam, but the beam size increase too quickly, then the main beam will cover the other.
Before the holiday, we found out the picomotor which controls the yaw of BS mirror cannot be controlled by the computer. And we checked the cable, from the driver to the connected part of the picomotor and the cable, it works well. Also we exchanged the port between pitch and yaw, after pitch works well, so the problem is also not from the driver. So Marc checked again the picomotor, he thought the problem is inside the picomotor,and we planned to change the it after we finished the green path and need to align the beam.
YuefanGuo - 00:29, Wednesday 10 May 2017 (464)
More attempt to astigmatism
Before the holiday we tried to move the lens to improve the beam shape, but still have some limitation, so we thought it maybe because the beam size is too large at the input port of the Faraday Isolator. So we tried to move the Faraday further from the lens, to let the beam converge more, but even we move the furthest we can, the beam is still large compared to the Faraday. Then we thought maybe we can change the lens into another one with smaller focal length, now we are using 100mm one.
But if we change to one with 50mm focal length,there is a possibility that the before the beam goes out from the Faraday it will expand. So I did the simulation today. I used the initial beam waist is 52.7 micrometer and 82.2cm away from the output of EOM, this is the value we had from the infrared beam, I am not sure if the green beam has the same size and position as the infrared one, but if I did the simulation with 100mm lens in its position now, the simulation result is close to the real beam size on the bench, so I did the after simulation with this starting point. Then I tried to change the lens to 50mm one in the simulation, and got the result in the first picture. The length of the Faraday is about 5cm, so if I put the beam waist at the center of the Faraday, the beam size at the input and output port of the it will be 762 micrometer in diameter which I think it is small enough.
But if we changed like this, there may be another problem, the aberration on the first lens will be much serious, since the beam size on the first lens does not change, but the focal length reduce.
We got the PBS for green today, so we can check the polarization of the green beam. If I remember right, we got pure P polarization went into the cavity, so the green should be S polarization, so we adjust the waveplate to maximum the S polarization.
YuefanGuo - 01:41, Thursday 27 April 2017 (463)
BS suspension mirror has been changed
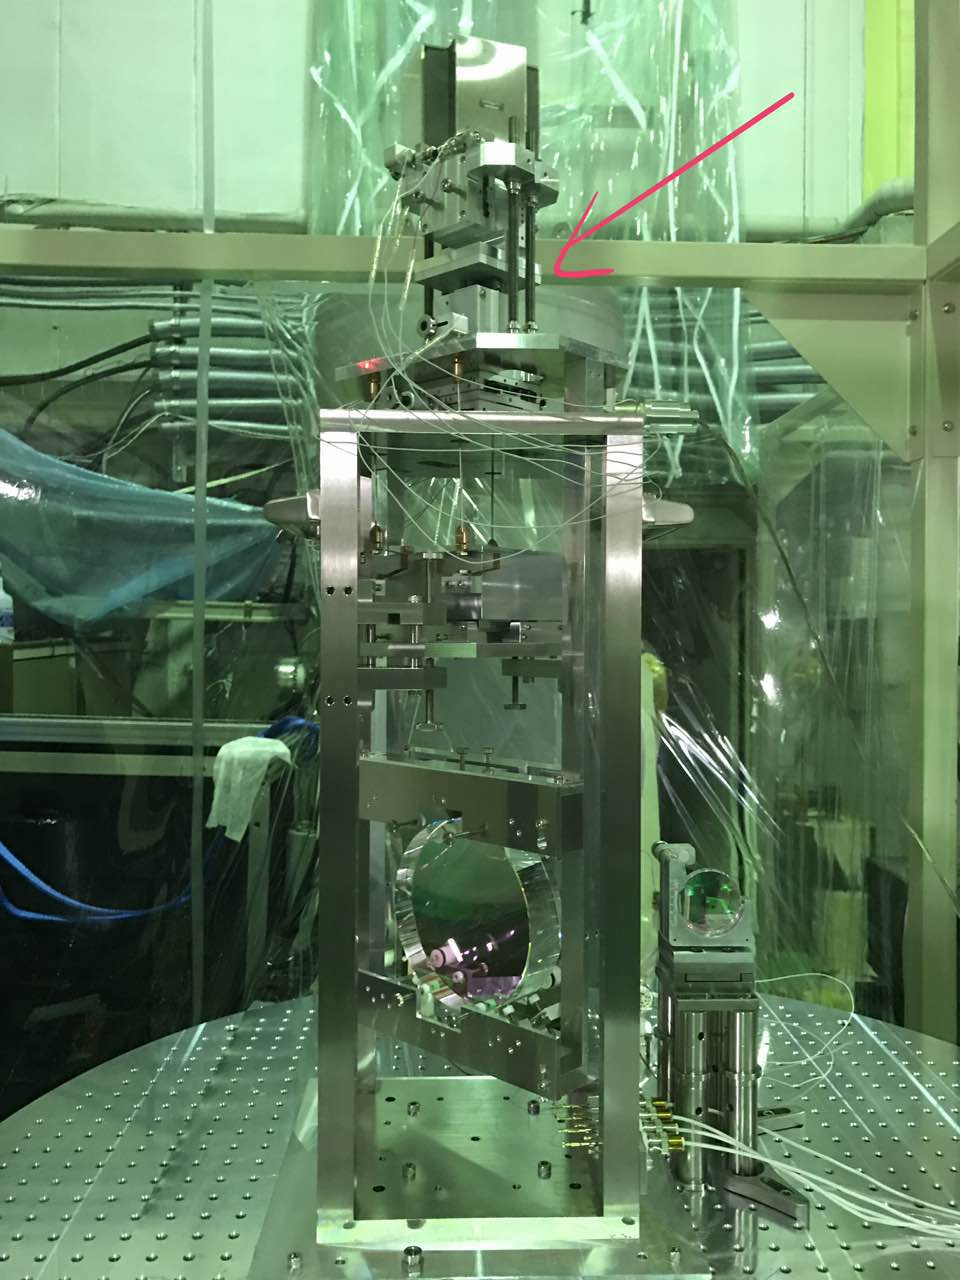
From yesterday afternoon we tried to remove the dummy mass on the BS suspension and change the real mirror.
Yesterday afternoon we tried to lower the inter-medium mass first, but we round out one of the top four screw is very hard to loose(pic 1), so we tried to lower the mass with one of the picomotor. But only with the picomotor the wire was not loose enough to remove the mirror, so finally we managed to turn that screw, and today when we need to fasten it, we changed to another screw.
So today we tried to put the real mirror on the wire, the stand-off and the magnet are all stick well, but since the real mirror is a little bit smaller, the white stopper on the up side of the mirror can not help a lot. Also when we try to put some intense on the wire to lift if from the stoppers, the mirror tilt a lot, so we turn the pitch picomotor to make it more or less vertical.
Then we tried with picomotor to align the beam again, while we were trying we found out the yaw picomotor of BS suspension does not work, we checked a bit, for now we can only say it is not the problem of the driver.We will try to fix this problem tomorrow morning. Then we tried to align with move the picomotor by hand, so we did align the beam, but maybe because the quality of mirror becomes higher, there are too many reflection everywhere, so the beam on the 290m target looks much worse than before.(pic 2)
The other thing is that we checked the picomotor driver for the end room yesterday and also checked again today, it works well both the top layer and the port layer. Now we have enough drivers.
Images attached to this report
RaffaeleFlaminio - 11:10, Tuesday 25 April 2017 (462)
Displacement of the NM2 optical bench
Participants: Takahashi, Flaminio, Guo, Eisenmann
Yesterday we move the optical bench in the NM2 chamber in order to have the beam
approximately passing on the beach axis. To do so the beam was previously positioned so to
pass approximately at the center of the two windows on the gate valves in the center area
(between the BS chamber and the NM2 chamber and between the NM2 chamber and the tube)
and reaching the target at 290 m.
YuefanGuo - 00:54, Tuesday 25 April 2017 (461)
Found the reason of astigmatism
Today the beam seems pretty low on the PR mirror, so we moved the pitch of the 2inch mirror first and aligned the beam everywhere, then we moved the input mirror bench about 2cm right to put the mirror in the right position.
With putting two aperture on the bench (pic 1), we set the position of the beam, and started to move the lens, at first when we just turn the screw in horizontal direction to center the beam on the lens, the beam is still elongated. Then we tried to turn the lens a little bit,then we found out the elongated changed to the vertical direction. If look at picture 2, it is not very obvious, but when we tried to send the beam far away, the beam is longer in the vertical direction a lot. We thought the reason of the beam shape is because of the large beam and short focal length(150mm), since the spherical aberration, when the beam pass the spherical surface, the light away from the axis does not focus on the same point as the light along the axis, so the more we off the center of the lens, the beam elongated more. So then we will try to center the beam better on the lens.
But the other strange thing is that the beam at 290m target is still elongated on horizontal direction(pic 3), this situation is the same when we tried to use the aperture to force the beam to beam round, then at the first target it looks good, but then on the second target it is pretty long in horizontal. We need to have a better beam and then try to find the possible reason of this.
The other things we discovered on Friday is that why when we center on all the mirror and also second target, we were off center of the first target. Then first target has a axial precession like the Earth's axis, so if we turn it to the other face it will be well centered also.
Images attached to this report
YuefanGuo - 00:51, Saturday 22 April 2017 (460)
Several work has been done
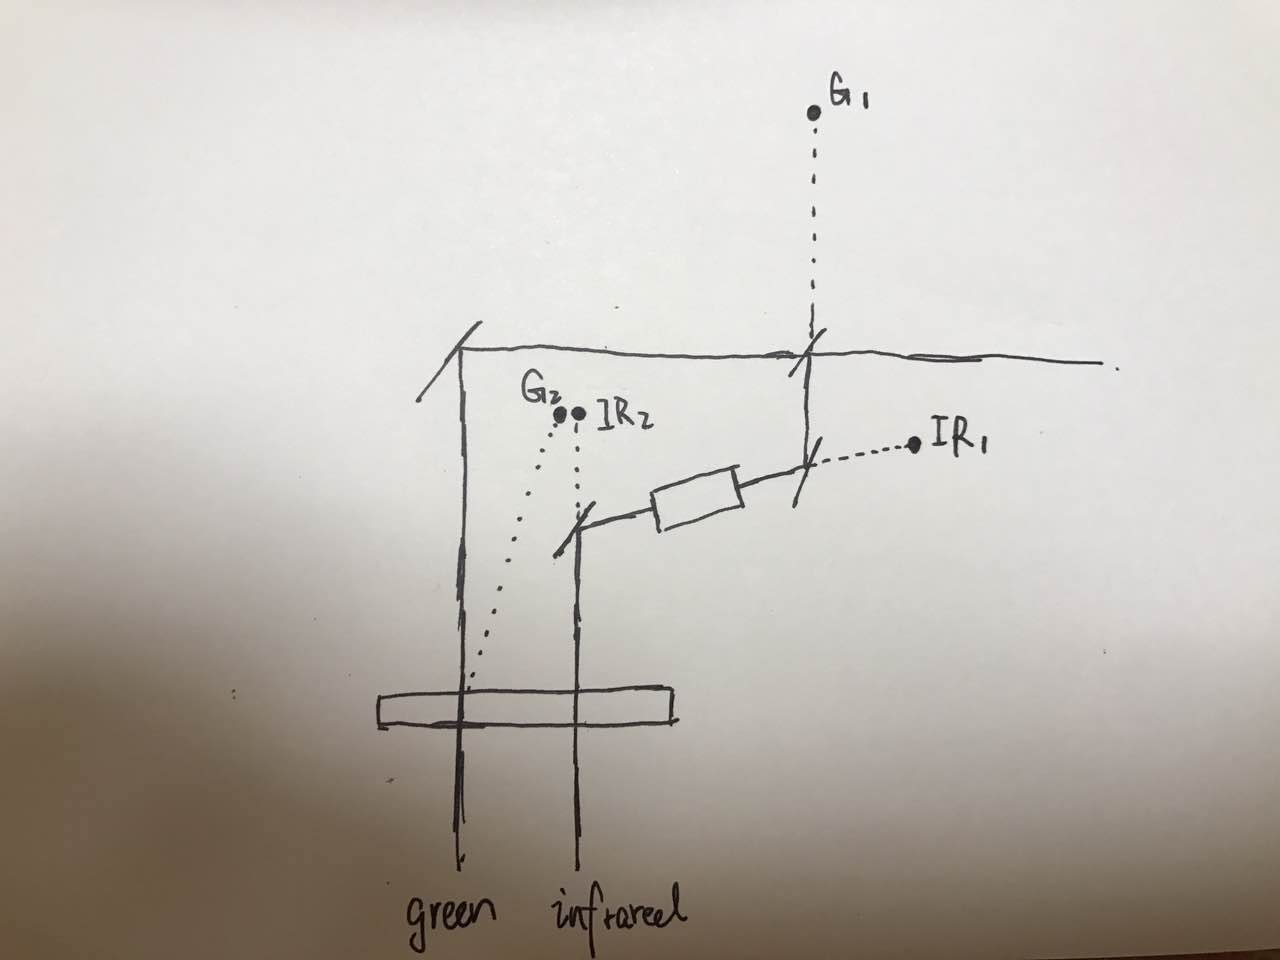
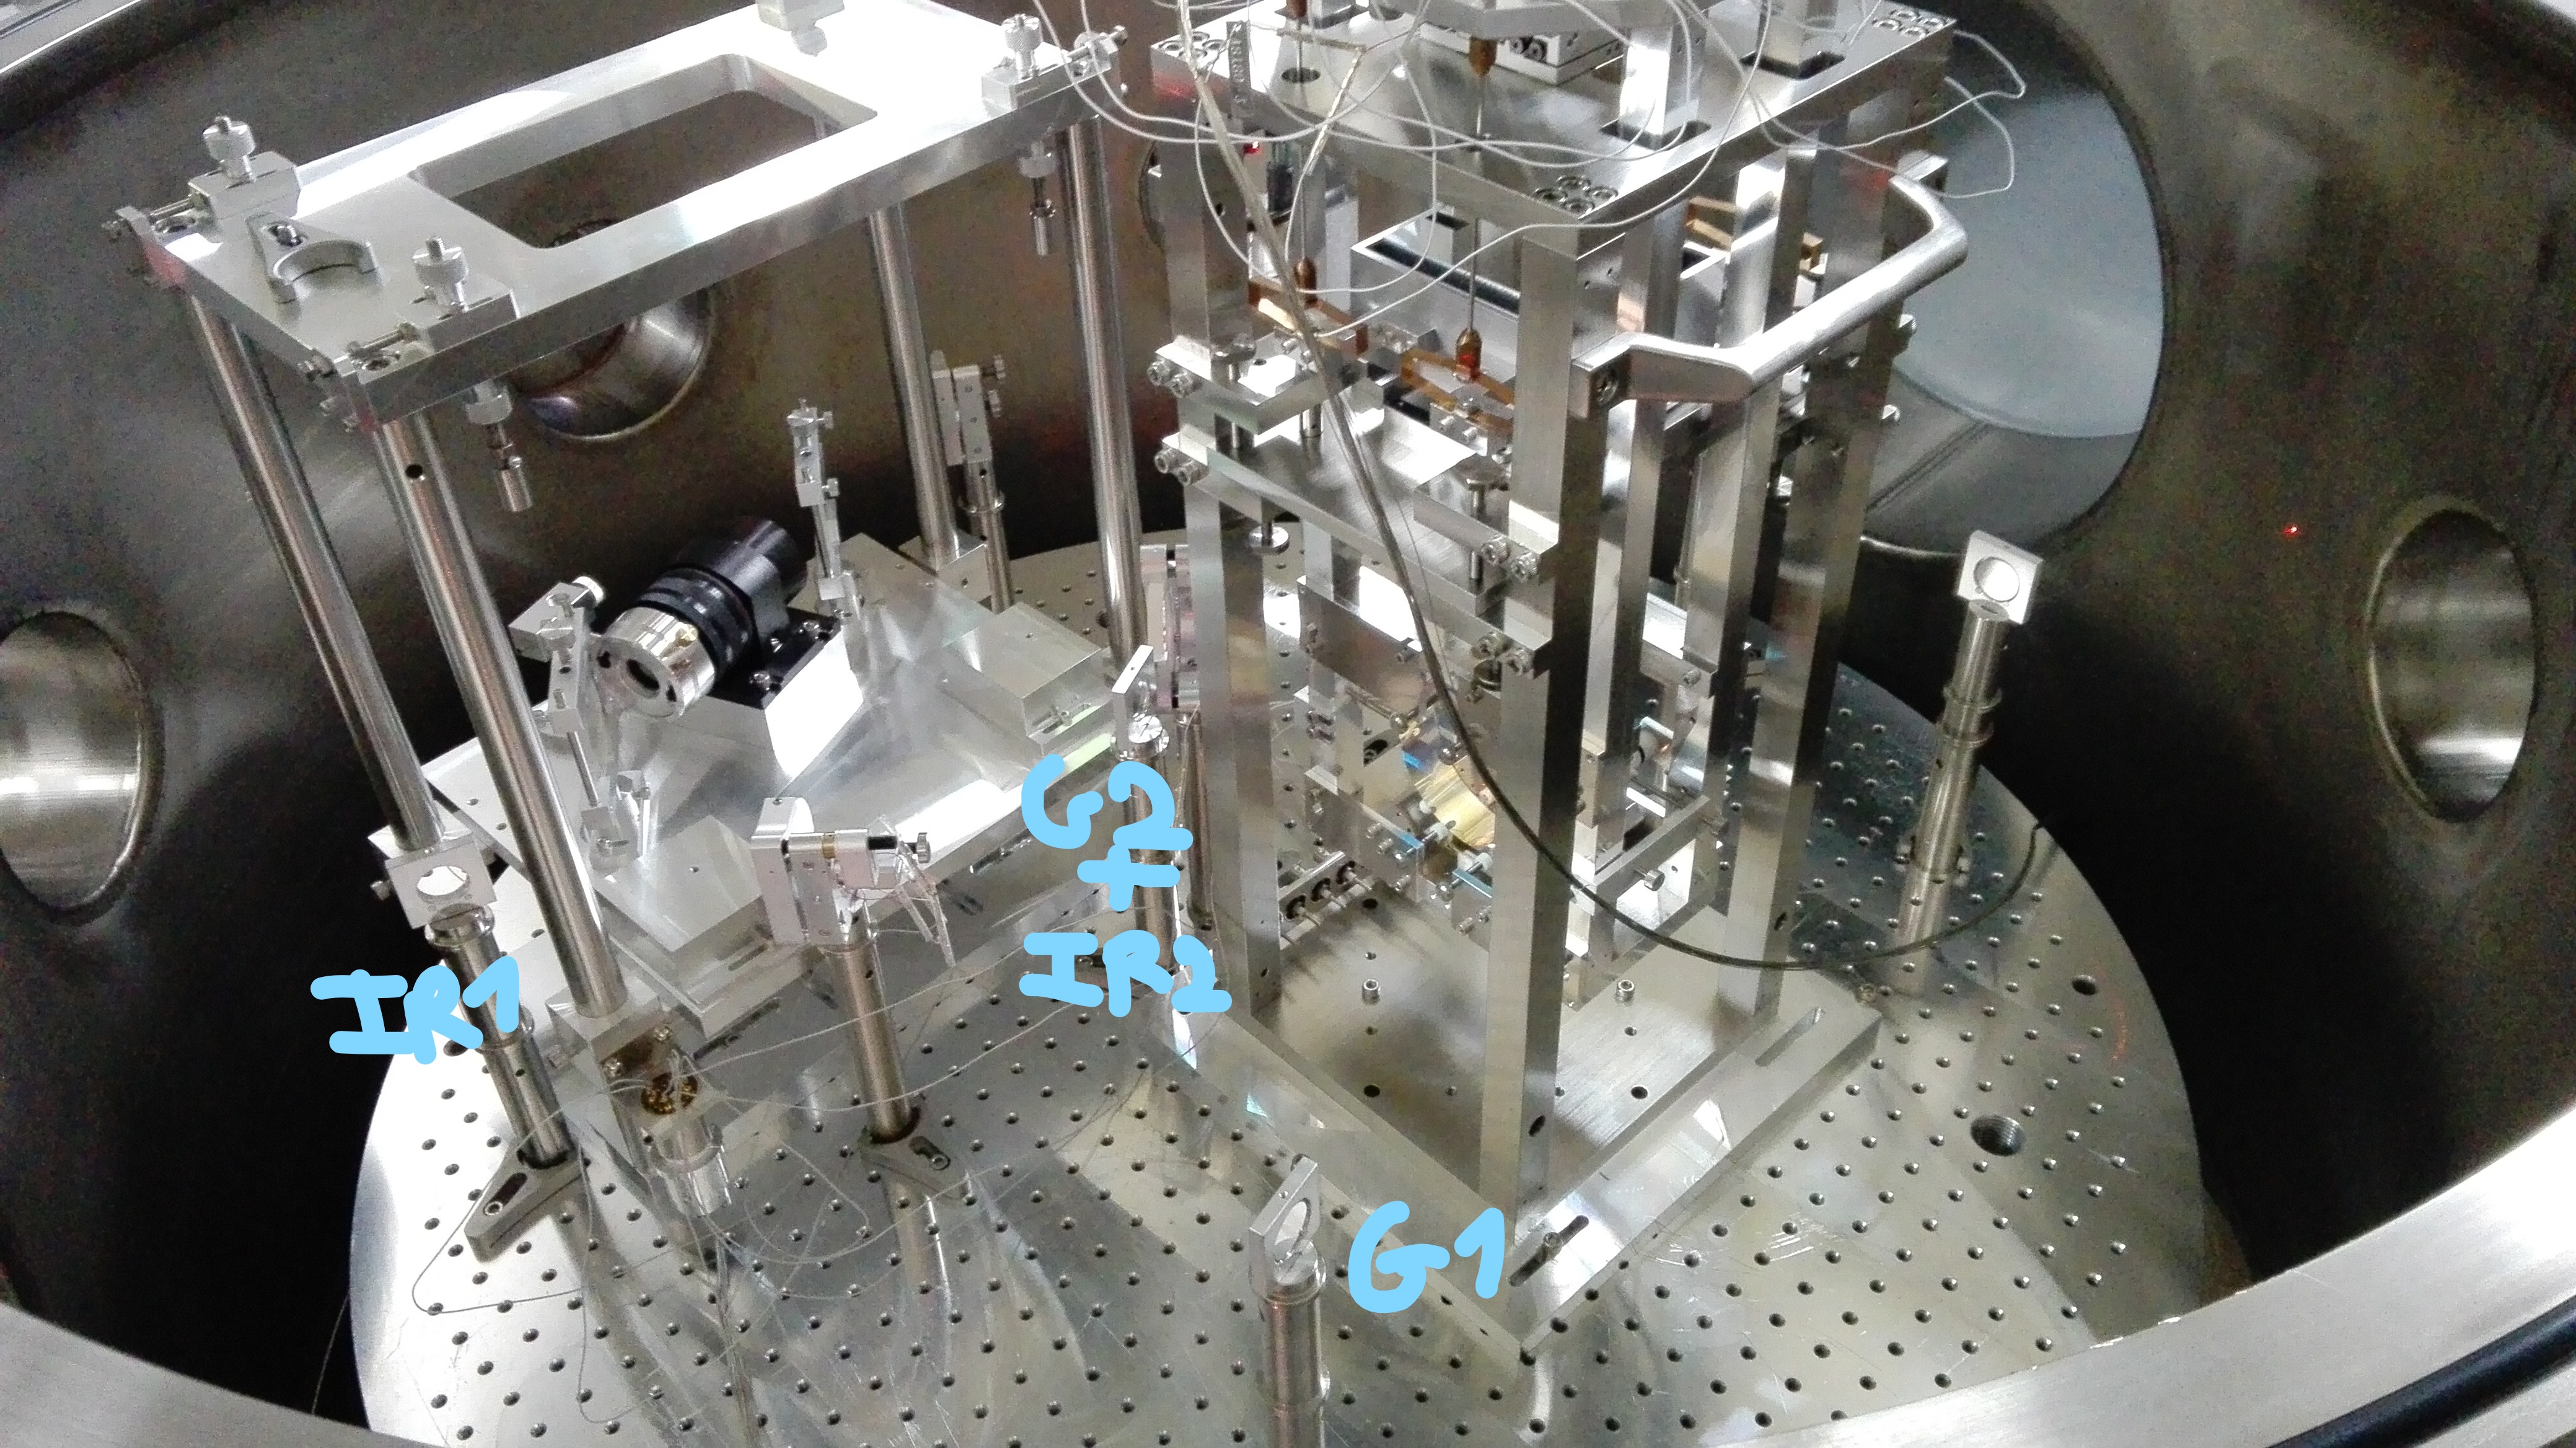
From yesterday we started to reflect some beam in the PR chamber out of the chamber, then we can mark the position for reference in case if we lose the alignment. Then we chose the four beams shows in the first picture, two are green and two are infrared. So from the picture, G2 and IR2 are used to set the alignment of the bench, and IR1 for the path of infrared, G1 to set the position of the dichroic. There is also a green beam transmit from the turning mirror, which hit one of the tube of the chamber, if we need to use that one, we just need to change that port to a window.
Then after we put the mirror like the type for the local control,working well in vacuum, to reflect the beams come out all from one window, on the right side of the input window of PR if you face the optical bench. Then we use a plastic sheet to put some cross on the position of the beam,and fixed them near the window( Pic 2), we use this kind of mount then if we need we can remove the plastic and then put them back again on the right position.
Yesterday we suddenly lost the infrared alignment, the beam went into the chamber but missed the first mirror. We checked the beam on the bench, there are totally three mirror to turning the beam into the chamber. Between the 1st and 2nd, we check with the target, it is fine. Then we wanted to know the reason why suddenly we lost the alignment, so we try to push a little bit at the edge of the 2nd and 3rd mirror, it seems the 2nd mirror fixed very good on the mount, but the third one does not. Also the beam is near the left edge of the 3rd mirror, and also we missed the 1st mirror in the chamber with the beam on the left side. If we wanted to move the beam on to the 1st mirror in the chamber, we need go more left on the 3rd mirror, then we will go out of this one. So we decided to move only the third mirror. Luckily, we got the alignment back with only moving this one.
Also we put another mirror after the dichroic mirror to check the reflect infrared beam can go to the right point on the bench or not. So it seems the alignment is very good, the infrared go back through the Faraday and reach good position.
We finished everything of the PR chamber, so in the afternoon we moved the clean booth to the BS chamber and closed the PR.(pic 3)
Today we also work a little bit on the astigmatism. At first we only want to put some aperture to set the beam position on the bench for re-align easier in the future. Then we found out if we make the beam on the bench through the aperture to make them round (pic 4), the beam after the telescope looks pretty good.(pic 5). So this time we were sure that the astigmatism is not from the things in chamber. Then we tried to put another aperture after the lens on the bench, the large beam looks very good as well, then put it before the lens, it seems the beam got worse, but since the beam before the lens is very small, it was hard to say the lens is the only reason for that.
Images attached to this report
Comments related to this report
Pictures of the opened PR chamber.
3 mirrors have been added to obtain the IR and green references.
G1 is the green beam reflected by the dichroic
IR 1 is the IR beam after the Faraday Isolator and a folding mirror
GR2 and IR2 are reflected by the same mirror ( between the green folding mirror and the dichroic and between the 2 metallical structures).
They can be seen on the "PR references" picture.
I will try to upload a more precise optical scheme of this chamber
Images attached to this comment
YuefanGuo - 13:52, Thursday 20 April 2017 (459)
SHG working temperature changed
Yesterday we basically tried to align the beam better, since we found out it is a bit low on the small window near the central room, also some problems in the horizontal direction. Now we are at a pretty good position in vertical position in the windows and the second target, we can use this height to align the first target again to the right height. In the horizontal direction we managed to align the beam more or less in the center in the windows and the second target, but then we found out it was far away from(left side) the center of the first target, it seems a little bit strange, but we decided to work with this situation. There is some construction work going on outside TAMA, we cannot adjust the beam in the daytime while they are working, because the beam in the central room does not go into to the vacuum yet, it is affected a lot by the seismic motion.
Also the SHG cavity had high frequency oscillation when it went around the resonance, so we changed the low pass filter frequency to 3Hz and the gain to 200.
The other problem we found out yesterday is that the optimal temperature of the SHG has been changed, before the thermal controller was set with the resistance of 3.270 where we can get the maximum power of green. But yesterday we found out the green beam power is too low, but the mode matching seems not bad, so we tried to change the temperature, and now the maximum green power was at 3.230, there we have the power about 20mW, it is still lower than before. One of the possibility is that the environment temperature in TAMA increased recently, so the radiator may not work as good as before.
And also now TAMA air conditioner is working at winter mode, when we tried to change it to summer mode, we found out the green beam shaked a lot. It may caused by the air flow between different temperature, since TAMA is quiet large, maybe it will take a long time for the temperature to get stable, so we planned to set the air conditioner to summer mode after we finish work this Friday, let it adjusts along all the weekend, hope on Monday it is stable enough for us to work on.
YuefanGuo - 00:13, Wednesday 19 April 2017 (458)
Sent the green beam to the end room
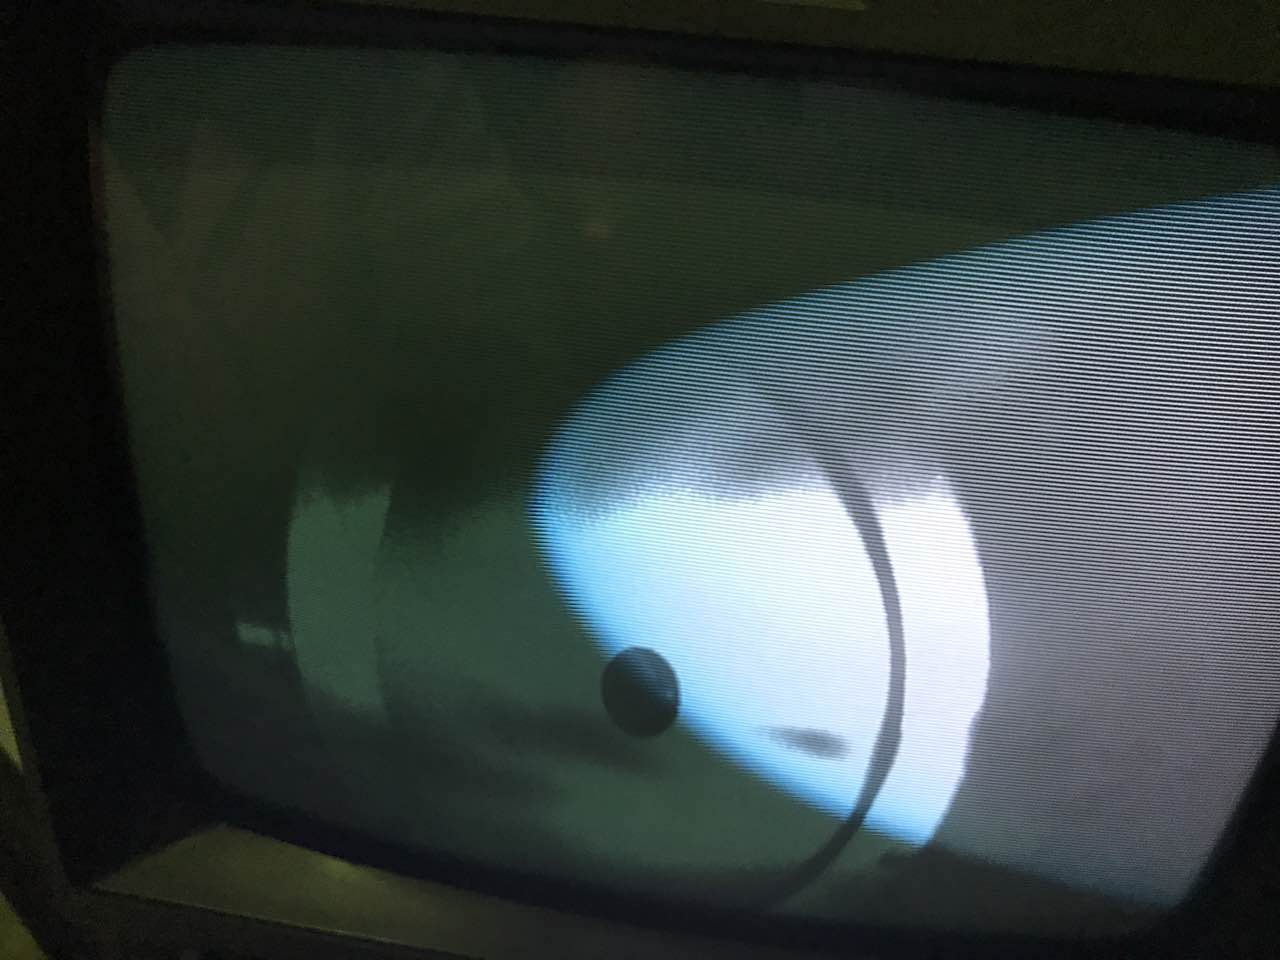
We aligned the beam at the small window after the input mirror and the 10m target first,move the beam to the center on the small window with PR suspension mirror, and move the beam to the center to the 10m target with BS suspension mirror,repeat these two steps until center the beam both on two place,then we lowered the 10m target and raised the target at 290m. Then move the PR suspension a little bit with picomotor and recover it with BS suspension, to move the beam parallel. Then little by little, we saw the beam on the screen in the central room, then went to 290m to check through the window, the beam is there(pic 1).
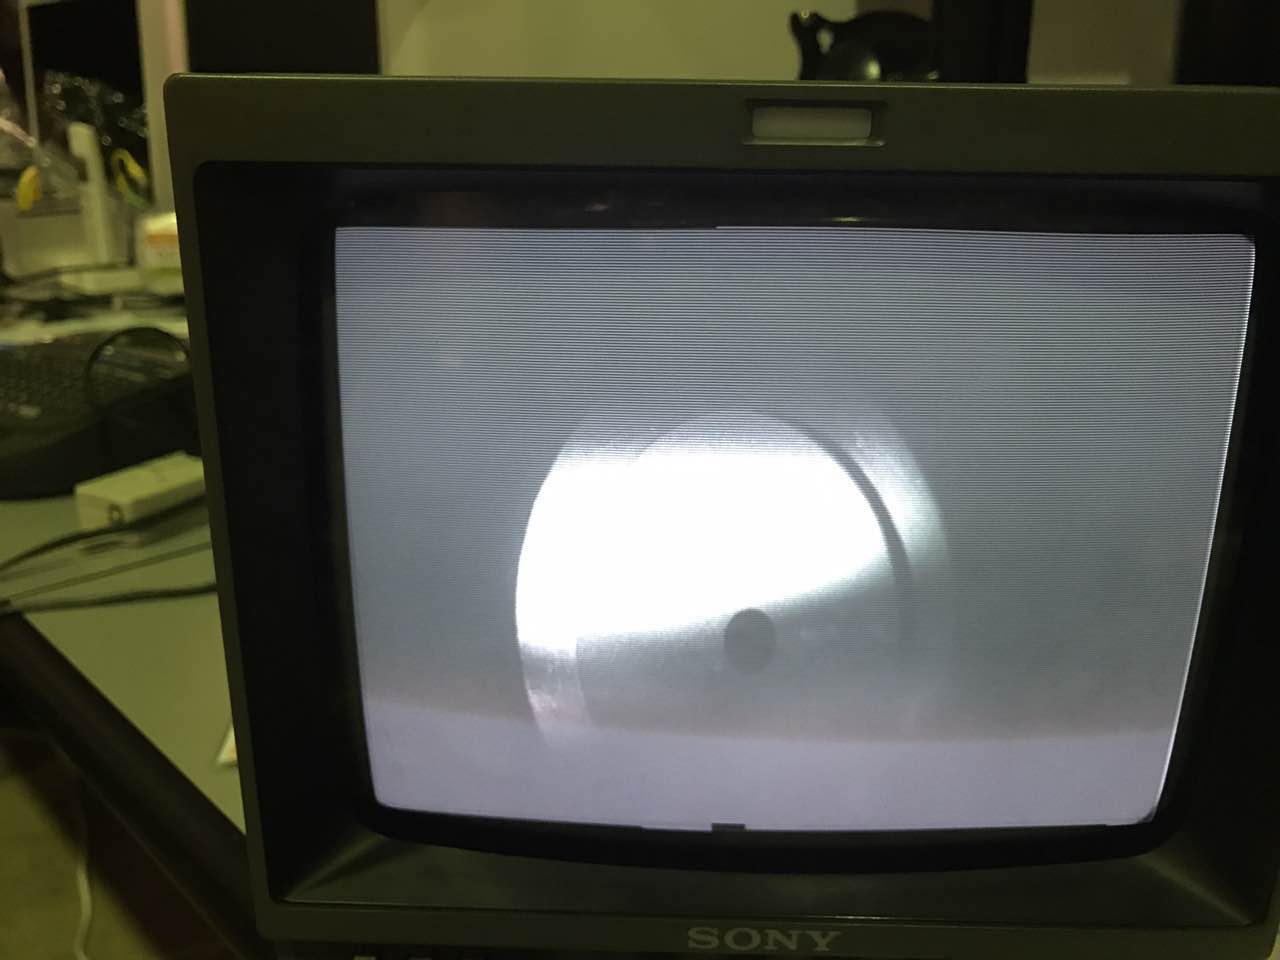
Then we went to the end room, the beam has already came out from the EM chamber, we saw it on the wall. After that we took a camera to the end room to look at the beam on the wall, connected to the board there and received the signal in the central room(pic2). Since the beam is shaking a lot because the air flow in the central room, so the picture is not very clear.
Although we sent the beam to the end mirror, but the beam seems larger then the one we sent. We are going to move the 2 inch mirror in the BS chamber tomorrow, try to find a good focus position.
Images attached to this report
YuefanGuo - 16:09, Tuesday 18 April 2017 (457)
The target control system at 290m
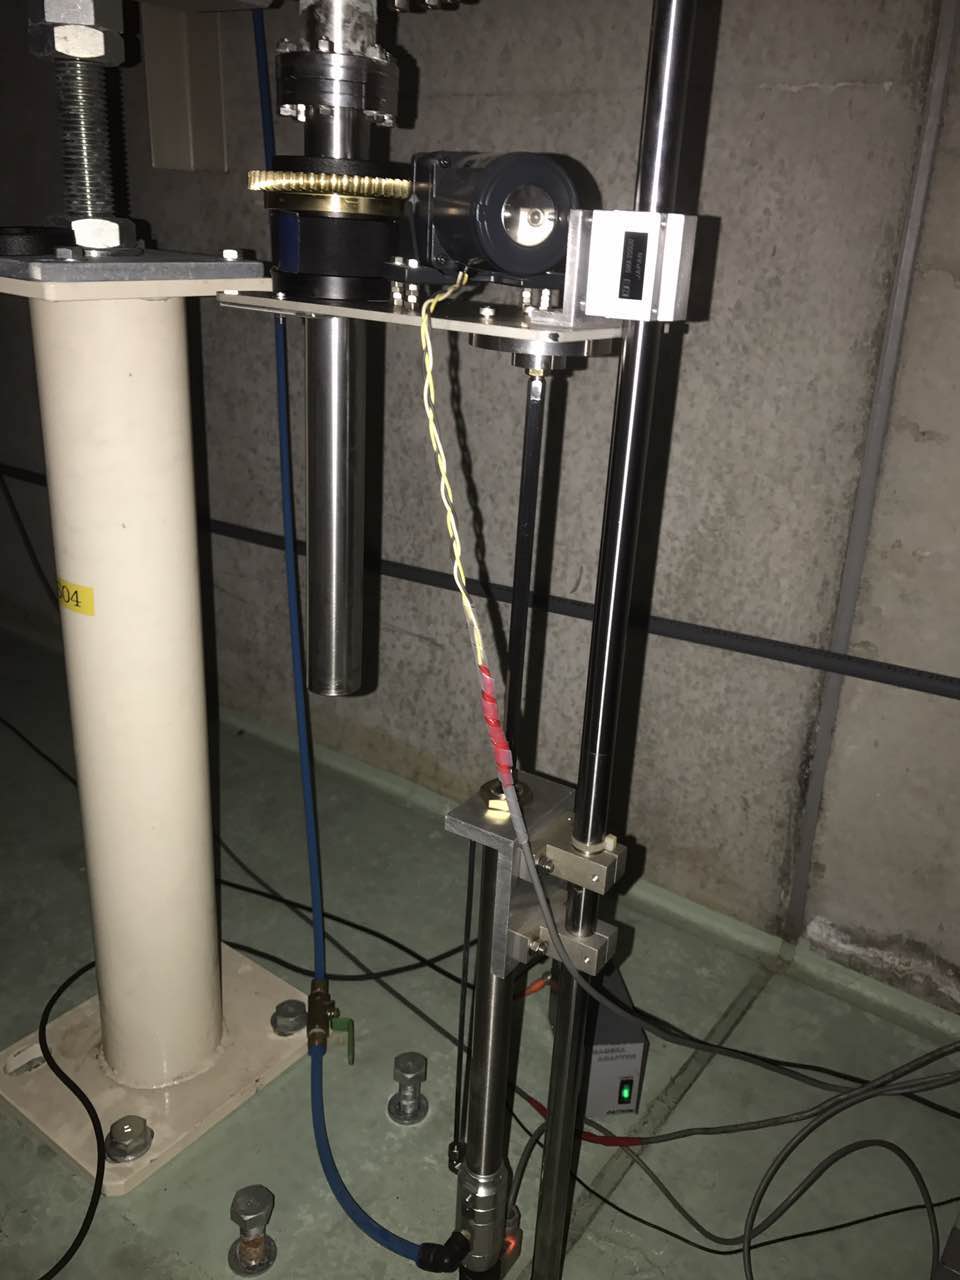
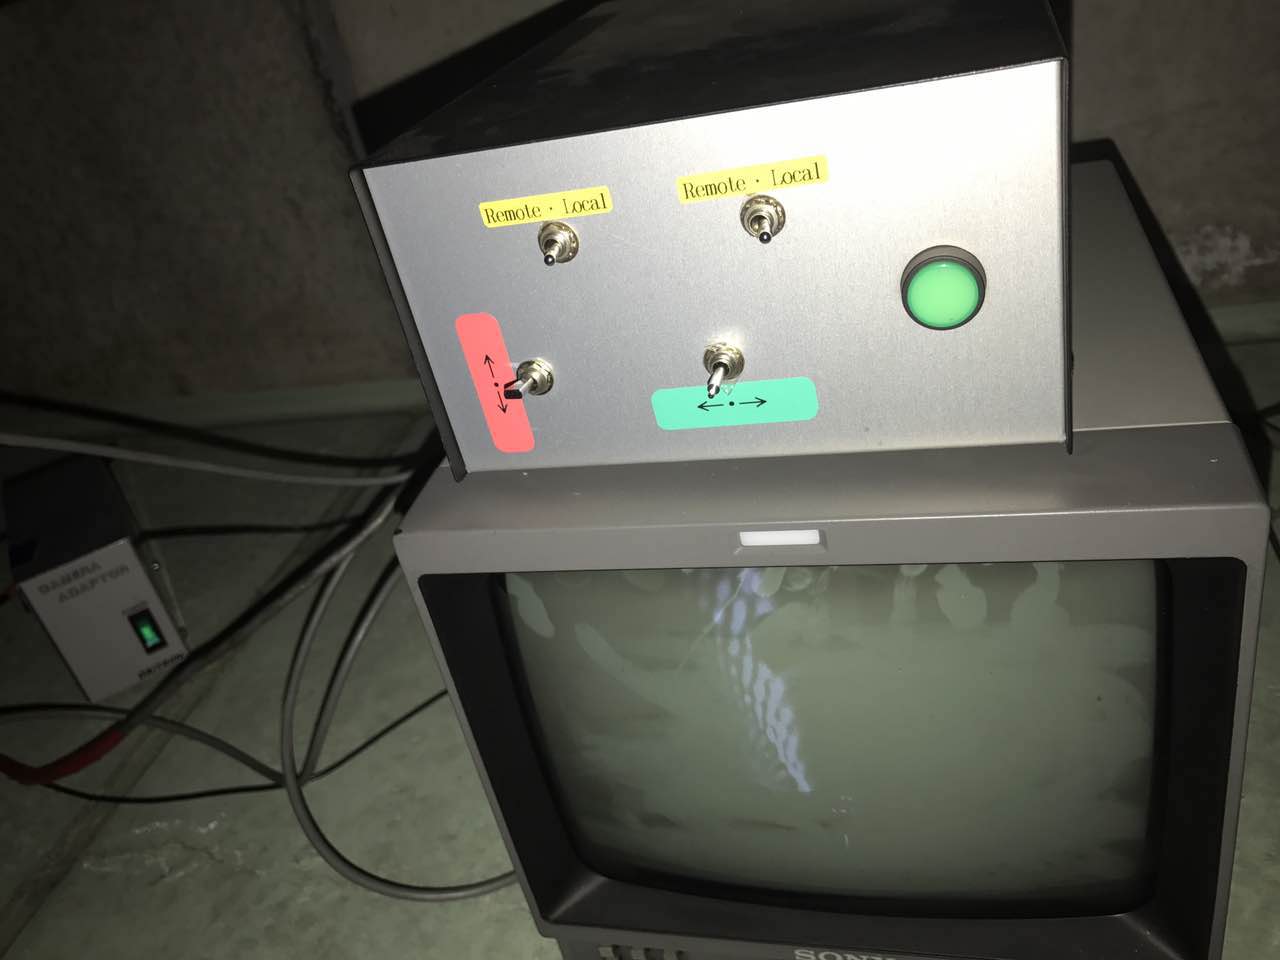
Today when we tried to align the beam in the arm, we found the system to control the target at 290m.
So from the first picture you can see the blue pipe, it is connected to a pump, then it can move the platform in picture two to move the target up and down. Then in the second picture, there is a motor used to turn the target. So both of these two controller are connected to the blue box in picture three. From what written on this box, we found out we can control this system locally and also remotely. So we followed the cable from this box to the end room, found another controller there(Pic 4&5). Now we keep the target there with moving the platform and motor locally, but if we want to make future work easier, it is better to find out how to do the remote control with the controller in the end room.
So from the first picture you can see the blue pipe, it is connected to a pump, then it can move the platform in picture two to move the target up and down. Then in the second picture, there is a motor used to turn the target. So both of these two controller are connected to the blue box in picture three. From what written on this box, we found out we can control this system locally and also remotely. So we followed the cable from this box to the end room, found another controller there(Pic 4&5). Now we keep the target there with moving the platform and motor locally, but if we want to make future work easier, it is better to find out how to do the remote control with the controller in the end room.
Images attached to this report
YuefanGuo - 23:08, Monday 17 April 2017 (456)
Check and align the beam
Today we checked the beam at several different place and tried to find where the astigmatism came from.
First in the situation as last Friday, we checked the reflected beam from the window, it was almost like before, very obvious elongated in horizontal direction, and also checked after the window, it seems even worse than before, it used to be about circular.
Then we tried to turn the dichroic mirror in the PR chamber to reflect the infrared beam enough far(into the west arm,PI) to look at the shape, it is more or less round beam.
The third beam is the transmitted of BS1, we checked across the table(P1), it is elliptical.
Next one we checked the transmitted beam of M2, luckily this beam pass successfully through the about 5cm gap between two tubes.We had enough distance to check it(P2), this beam is already started to be longer in horizontal.
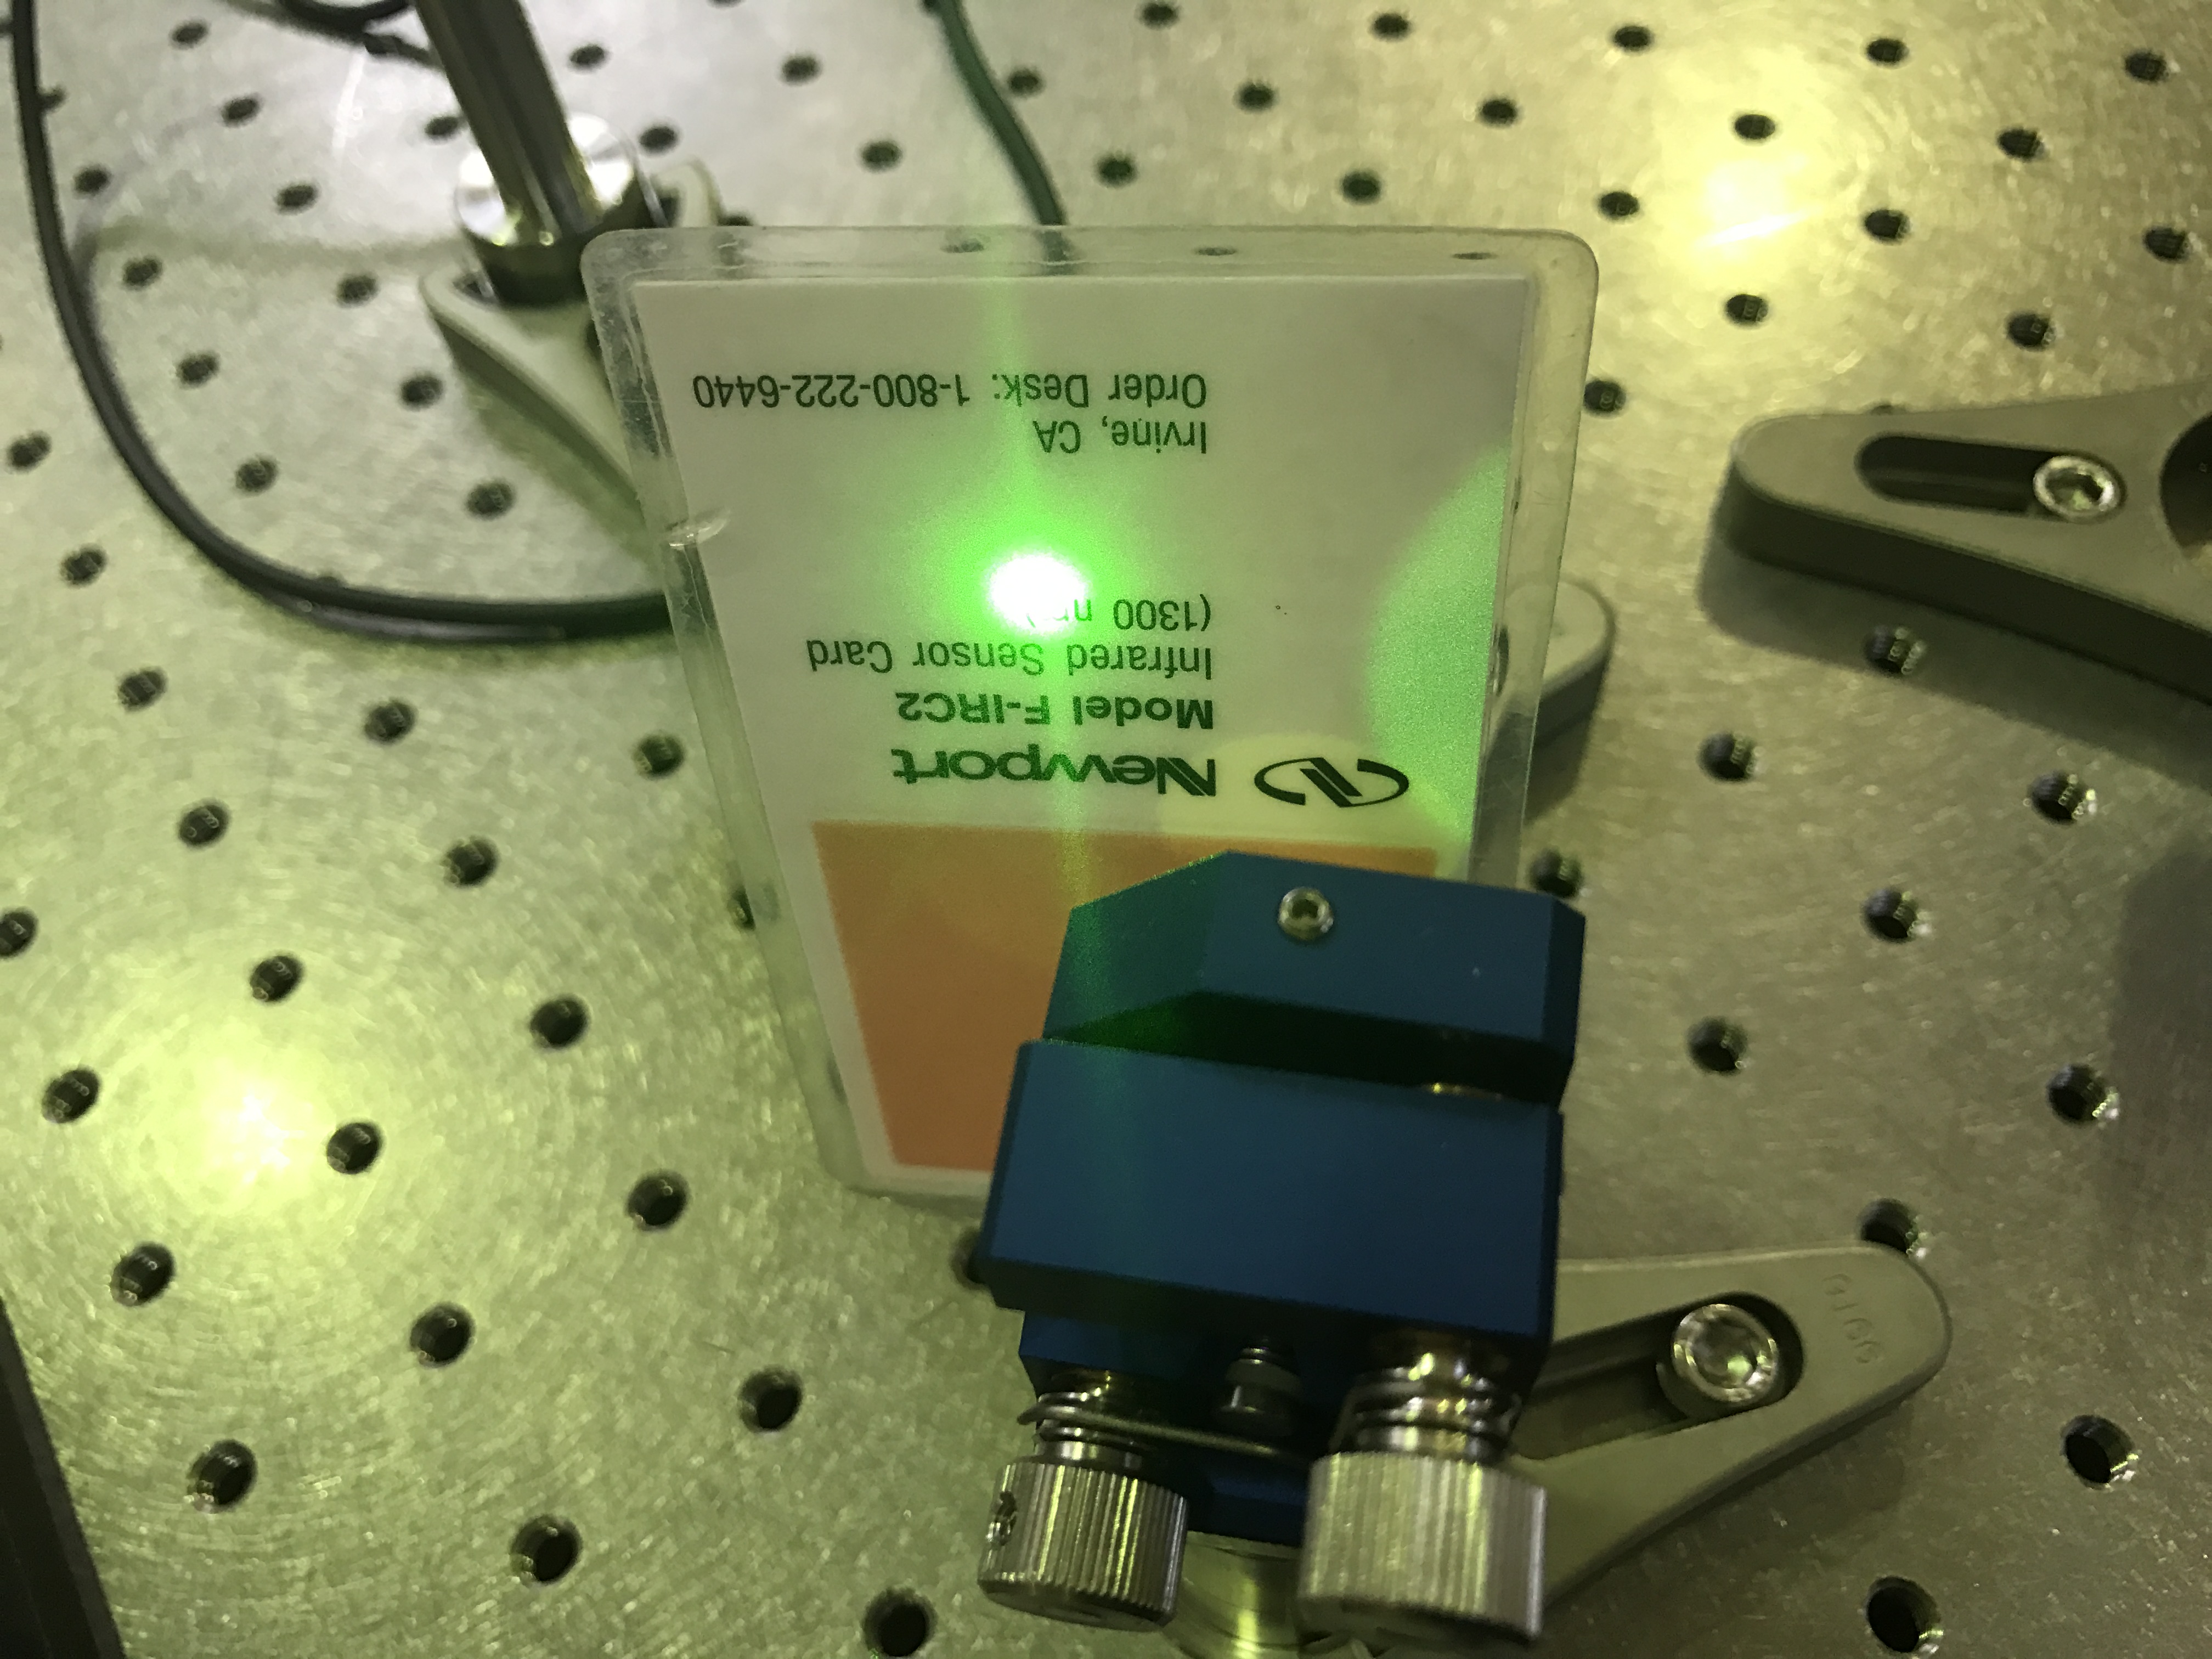
Then the last check we put another mirror between L1 and M2(MT) to reflect the beam,checked with almost the same distance with P1, it is not a perfect round beam from my sight. But then we put the beam profiler at the edge of the bench, try to get the shape with it. Actually from the profiler, it seems a pretty good beam.
Then since we already finished all the picomotors, and I finished to make the cover of the extended wire today, so then we tested the extended cable again in case that I broke some during making the cover. All of them works well. But when we tried to move the picomotors of PR chamber, there is one layer of dirvers did not work. So now we have one problem is that we do not have enough drivers for the end room.
After fixed all the problems of picomotor, then we tried to re-align the beam. We recovered the last mirror on the bench for green first(M4), since we set the position with the target, it was not very hard to do it. But then we found out that the green beam on both the turning mirror and the dichroic mirror are both not very centered, I am not sure about the situation after the middle part of the chamber put back, but since we did not change M4 in horizontal, so we keep working with that. The we realign all the beam until the BS suspension mirror.
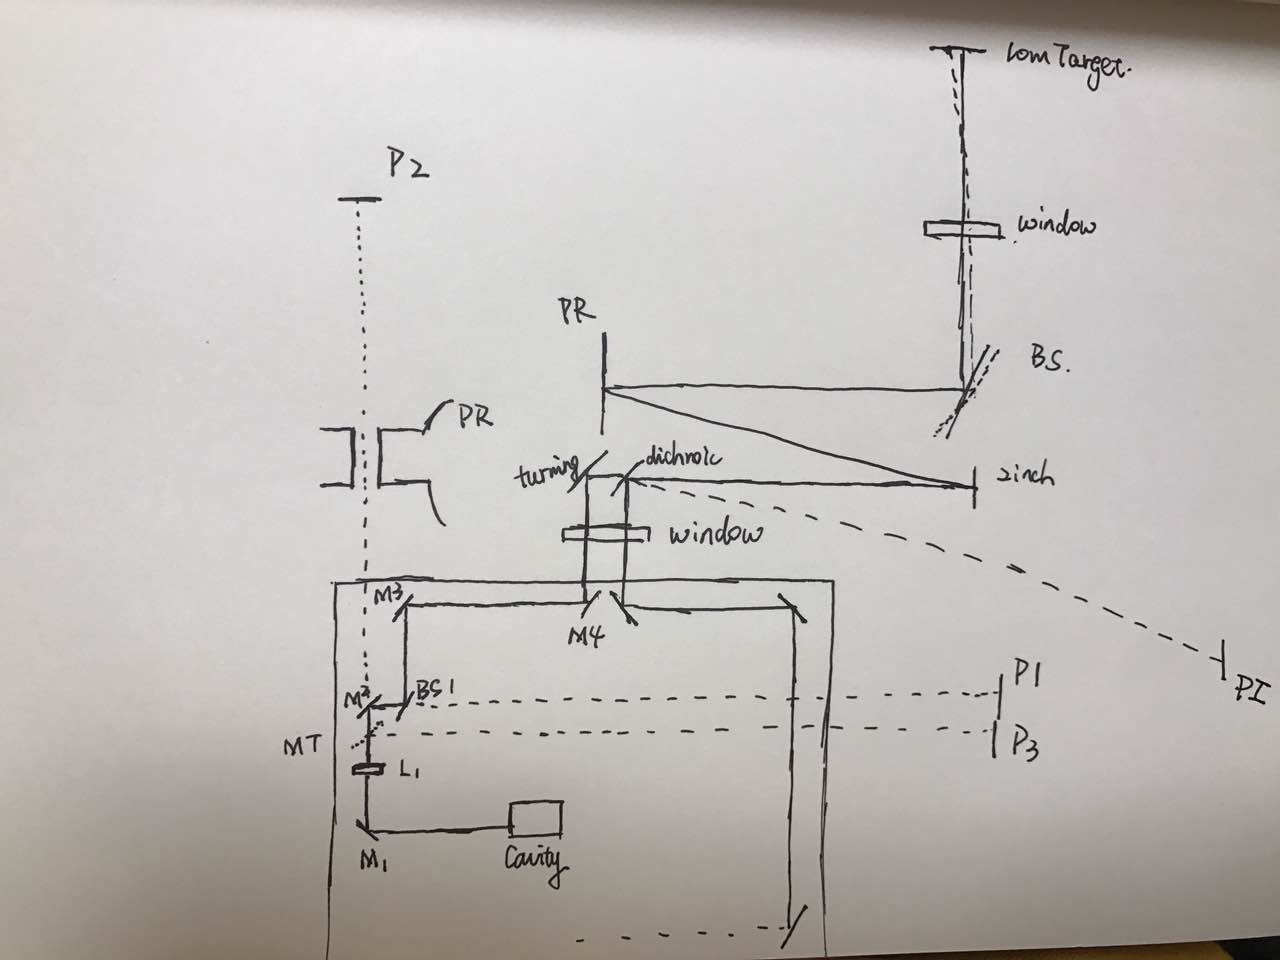
We took the 2cm shift into consideration(Logbook entry 450), and found out the beam is a little bit right on the mirror, left on the 10m target. So the dash line shows the situation now. So then we will move the PR and BS suspension mirror together to send the beam straight, after centered it on the window and the 10m target, we will try to center it on the 290m target.
First in the situation as last Friday, we checked the reflected beam from the window, it was almost like before, very obvious elongated in horizontal direction, and also checked after the window, it seems even worse than before, it used to be about circular.
Then we tried to turn the dichroic mirror in the PR chamber to reflect the infrared beam enough far(into the west arm,PI) to look at the shape, it is more or less round beam.
The third beam is the transmitted of BS1, we checked across the table(P1), it is elliptical.
Next one we checked the transmitted beam of M2, luckily this beam pass successfully through the about 5cm gap between two tubes.We had enough distance to check it(P2), this beam is already started to be longer in horizontal.
Then the last check we put another mirror between L1 and M2(MT) to reflect the beam,checked with almost the same distance with P1, it is not a perfect round beam from my sight. But then we put the beam profiler at the edge of the bench, try to get the shape with it. Actually from the profiler, it seems a pretty good beam.
Then since we already finished all the picomotors, and I finished to make the cover of the extended wire today, so then we tested the extended cable again in case that I broke some during making the cover. All of them works well. But when we tried to move the picomotors of PR chamber, there is one layer of dirvers did not work. So now we have one problem is that we do not have enough drivers for the end room.
After fixed all the problems of picomotor, then we tried to re-align the beam. We recovered the last mirror on the bench for green first(M4), since we set the position with the target, it was not very hard to do it. But then we found out that the green beam on both the turning mirror and the dichroic mirror are both not very centered, I am not sure about the situation after the middle part of the chamber put back, but since we did not change M4 in horizontal, so we keep working with that. The we realign all the beam until the BS suspension mirror.
We took the 2cm shift into consideration(Logbook entry 450), and found out the beam is a little bit right on the mirror, left on the 10m target. So the dash line shows the situation now. So then we will move the PR and BS suspension mirror together to send the beam straight, after centered it on the window and the 10m target, we will try to center it on the 290m target.
Images attached to this report
YuefanGuo - 23:41, Friday 14 April 2017 (455)
Comment to Check the reason of astigmatism (Click here to view original report: 454)
We forgot to check the beam under the red line situation after the window and after the turning mirror, also the reflection beam of the window. So maybe we can get rid some of the reasons after these three checking.
YuefanGuo - 23:25, Friday 14 April 2017 (454)
Check the reason of astigmatism
We finished the picomotor pins of the PR chamber in the morning and checked all of them work well. So this afternoon we tried to move the beam outside the dichroic mirror.
At first we tried to move the beam in the horizontal direction out of dichroic mirror. But while we were moving, we thought that if the beam is elongated in the horizontal direction because of the mirror's wedge, when we scan the mirror maybe the beam shape will change. We scanned it,but the beam is too small,it was hard to say if it has some change or not, then we thought maybe we can put a lens with very short focal length on the BS bench to make the beam bigger in the short distance, but it was also hard to say since we scanned the beam in very small step, then on the BS bench the beam moved a lot and out of the lens, then we cannot exactly sure every time we put the lens in a good position to let the beam cross its center, if we did not cross center, the beam will also effected by the lens.
Then we followed our original plan to move the beam out of the dichroic in the horizontal direction, but it stopped by the mount of the mirror, so we tried in the vertical way, when we reached the pitch limitation of turning mirror, the beam was on the top edge of the dichroic, we thought it will be better if we move the beam totally outside the dichroic, so we decided to change a little bit the degree of last mirror on the bench. Before we changed the last mirror, we use the target to set the position of the green beam after the window for easier recover the beam. Then we let the beam go outside and far away from the BS chamber, to check the situation of it.
There were some strange situation that in the near field of the BS chamber, the beam elongation is much serious than the far field. We guessed that maybe because there are some overlap in the near field to make us feel the beam is longer, then in the far field, the other small beams separated from the main one. Actually, we did see that in the far field there were more small beams. But at least, the beam got better in this test.
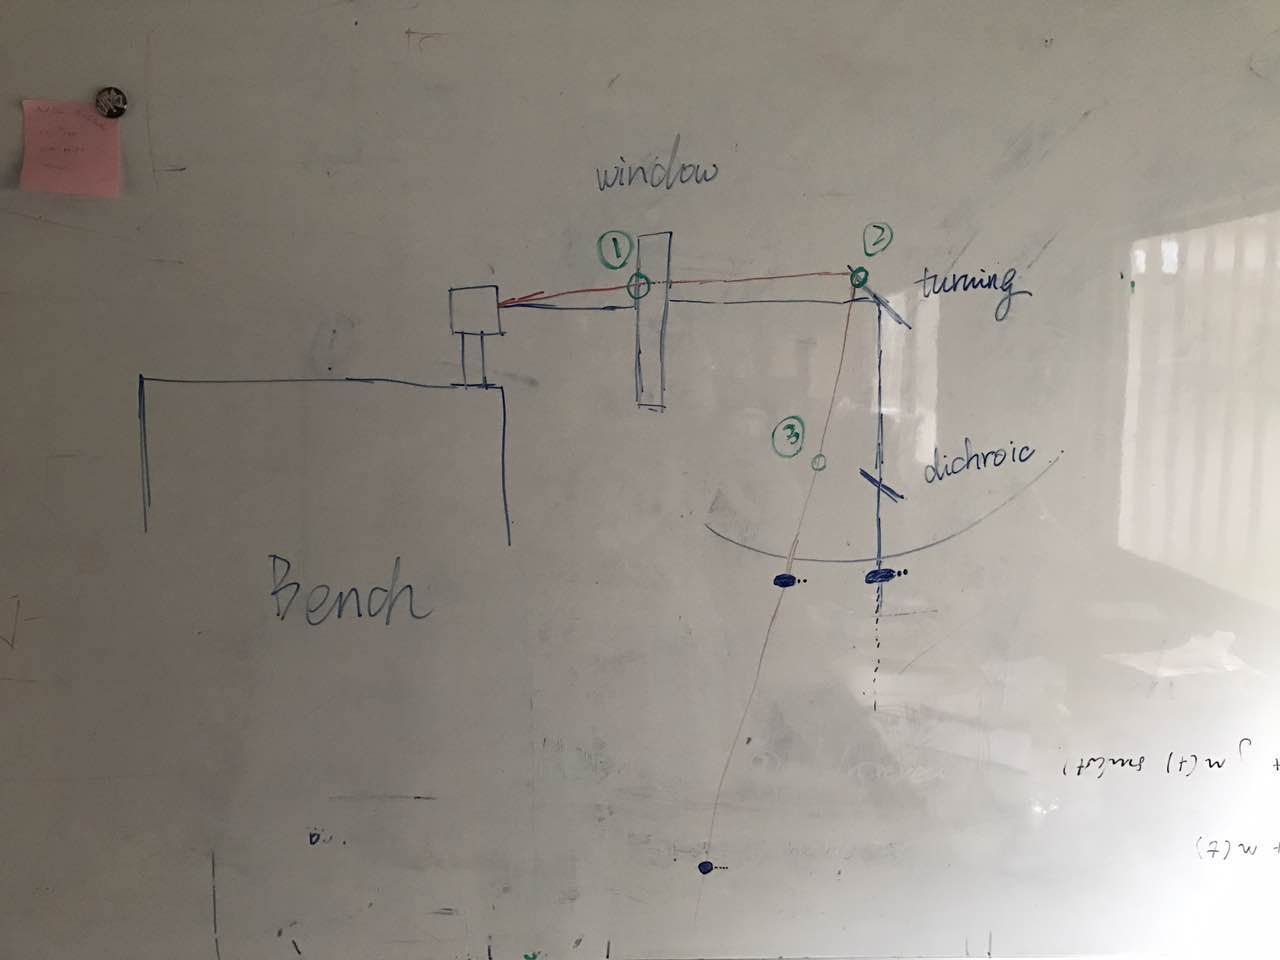
The other situation I want to mention is that, I am not sure that the beam got better is only because of moving out from dichroic, we also have other changes in this test. Like I showed the simple drawing in the first picture, the circle 1,2,3 is the changed point.(It maybe a little bit hard to understand since I change the 3D situation into a 2D drawing, the red line is after we made the beam path goes up, so the red beam reached the higher position of the turning mirror and pass the dichroic from top of it)
1. The beam position on the window
2. The beam position on the turning mirror
3. The beam did not cross the dichroic
Also I showed the beam shape in two situation and in the near field and far field.
The second picture is I showed yesterday on the meeting for better understanding of the situation.
At first we tried to move the beam in the horizontal direction out of dichroic mirror. But while we were moving, we thought that if the beam is elongated in the horizontal direction because of the mirror's wedge, when we scan the mirror maybe the beam shape will change. We scanned it,but the beam is too small,it was hard to say if it has some change or not, then we thought maybe we can put a lens with very short focal length on the BS bench to make the beam bigger in the short distance, but it was also hard to say since we scanned the beam in very small step, then on the BS bench the beam moved a lot and out of the lens, then we cannot exactly sure every time we put the lens in a good position to let the beam cross its center, if we did not cross center, the beam will also effected by the lens.
Then we followed our original plan to move the beam out of the dichroic in the horizontal direction, but it stopped by the mount of the mirror, so we tried in the vertical way, when we reached the pitch limitation of turning mirror, the beam was on the top edge of the dichroic, we thought it will be better if we move the beam totally outside the dichroic, so we decided to change a little bit the degree of last mirror on the bench. Before we changed the last mirror, we use the target to set the position of the green beam after the window for easier recover the beam. Then we let the beam go outside and far away from the BS chamber, to check the situation of it.
There were some strange situation that in the near field of the BS chamber, the beam elongation is much serious than the far field. We guessed that maybe because there are some overlap in the near field to make us feel the beam is longer, then in the far field, the other small beams separated from the main one. Actually, we did see that in the far field there were more small beams. But at least, the beam got better in this test.
The other situation I want to mention is that, I am not sure that the beam got better is only because of moving out from dichroic, we also have other changes in this test. Like I showed the simple drawing in the first picture, the circle 1,2,3 is the changed point.(It maybe a little bit hard to understand since I change the 3D situation into a 2D drawing, the red line is after we made the beam path goes up, so the red beam reached the higher position of the turning mirror and pass the dichroic from top of it)
1. The beam position on the window
2. The beam position on the turning mirror
3. The beam did not cross the dichroic
Also I showed the beam shape in two situation and in the near field and far field.
The second picture is I showed yesterday on the meeting for better understanding of the situation.
Images attached to this report
Comments related to this report
We forgot to check the beam under the red line situation after the window and after the turning mirror, also the reflection beam of the window. So maybe we can get rid some of the reasons after these three checking.
RaffaeleFlaminio - 15:04, Friday 14 April 2017 (453)
Comment to Position of stack in NM2 ? (Click here to view original report: 450)
I repeat the same procedure but this time I injected the He-Ne laser beam from behind the mirror i.e.
the He-Ne laser beam goes through the input mirror. Also in this case I centered the He-Ne laser beam
on the the first target in the tube and on the window at the entrance of the tube.
In order to do so the injection point from the back of the suspension is 21.8 cm in height and 2.4 cm
to the west.
the He-Ne laser beam goes through the input mirror. Also in this case I centered the He-Ne laser beam
on the the first target in the tube and on the window at the entrance of the tube.
In order to do so the injection point from the back of the suspension is 21.8 cm in height and 2.4 cm
to the west.
RaffaeleFlaminio - 16:42, Thursday 13 April 2017 (452)
Comment to Position of stack in NM2 ? (Click here to view original report: 450)
I check again the axis and re-adjusted a little bit the He-Ne laser beam position
trying to have it better centered on the valve's window.
The height respect to the stack doesn't change. The lateral position is now 1.4 cm
west.
trying to have it better centered on the valve's window.
The height respect to the stack doesn't change. The lateral position is now 1.4 cm
west.
RaffaeleFlaminio - 16:18, Thursday 13 April 2017 (451)
Mirror in NM2 chamber
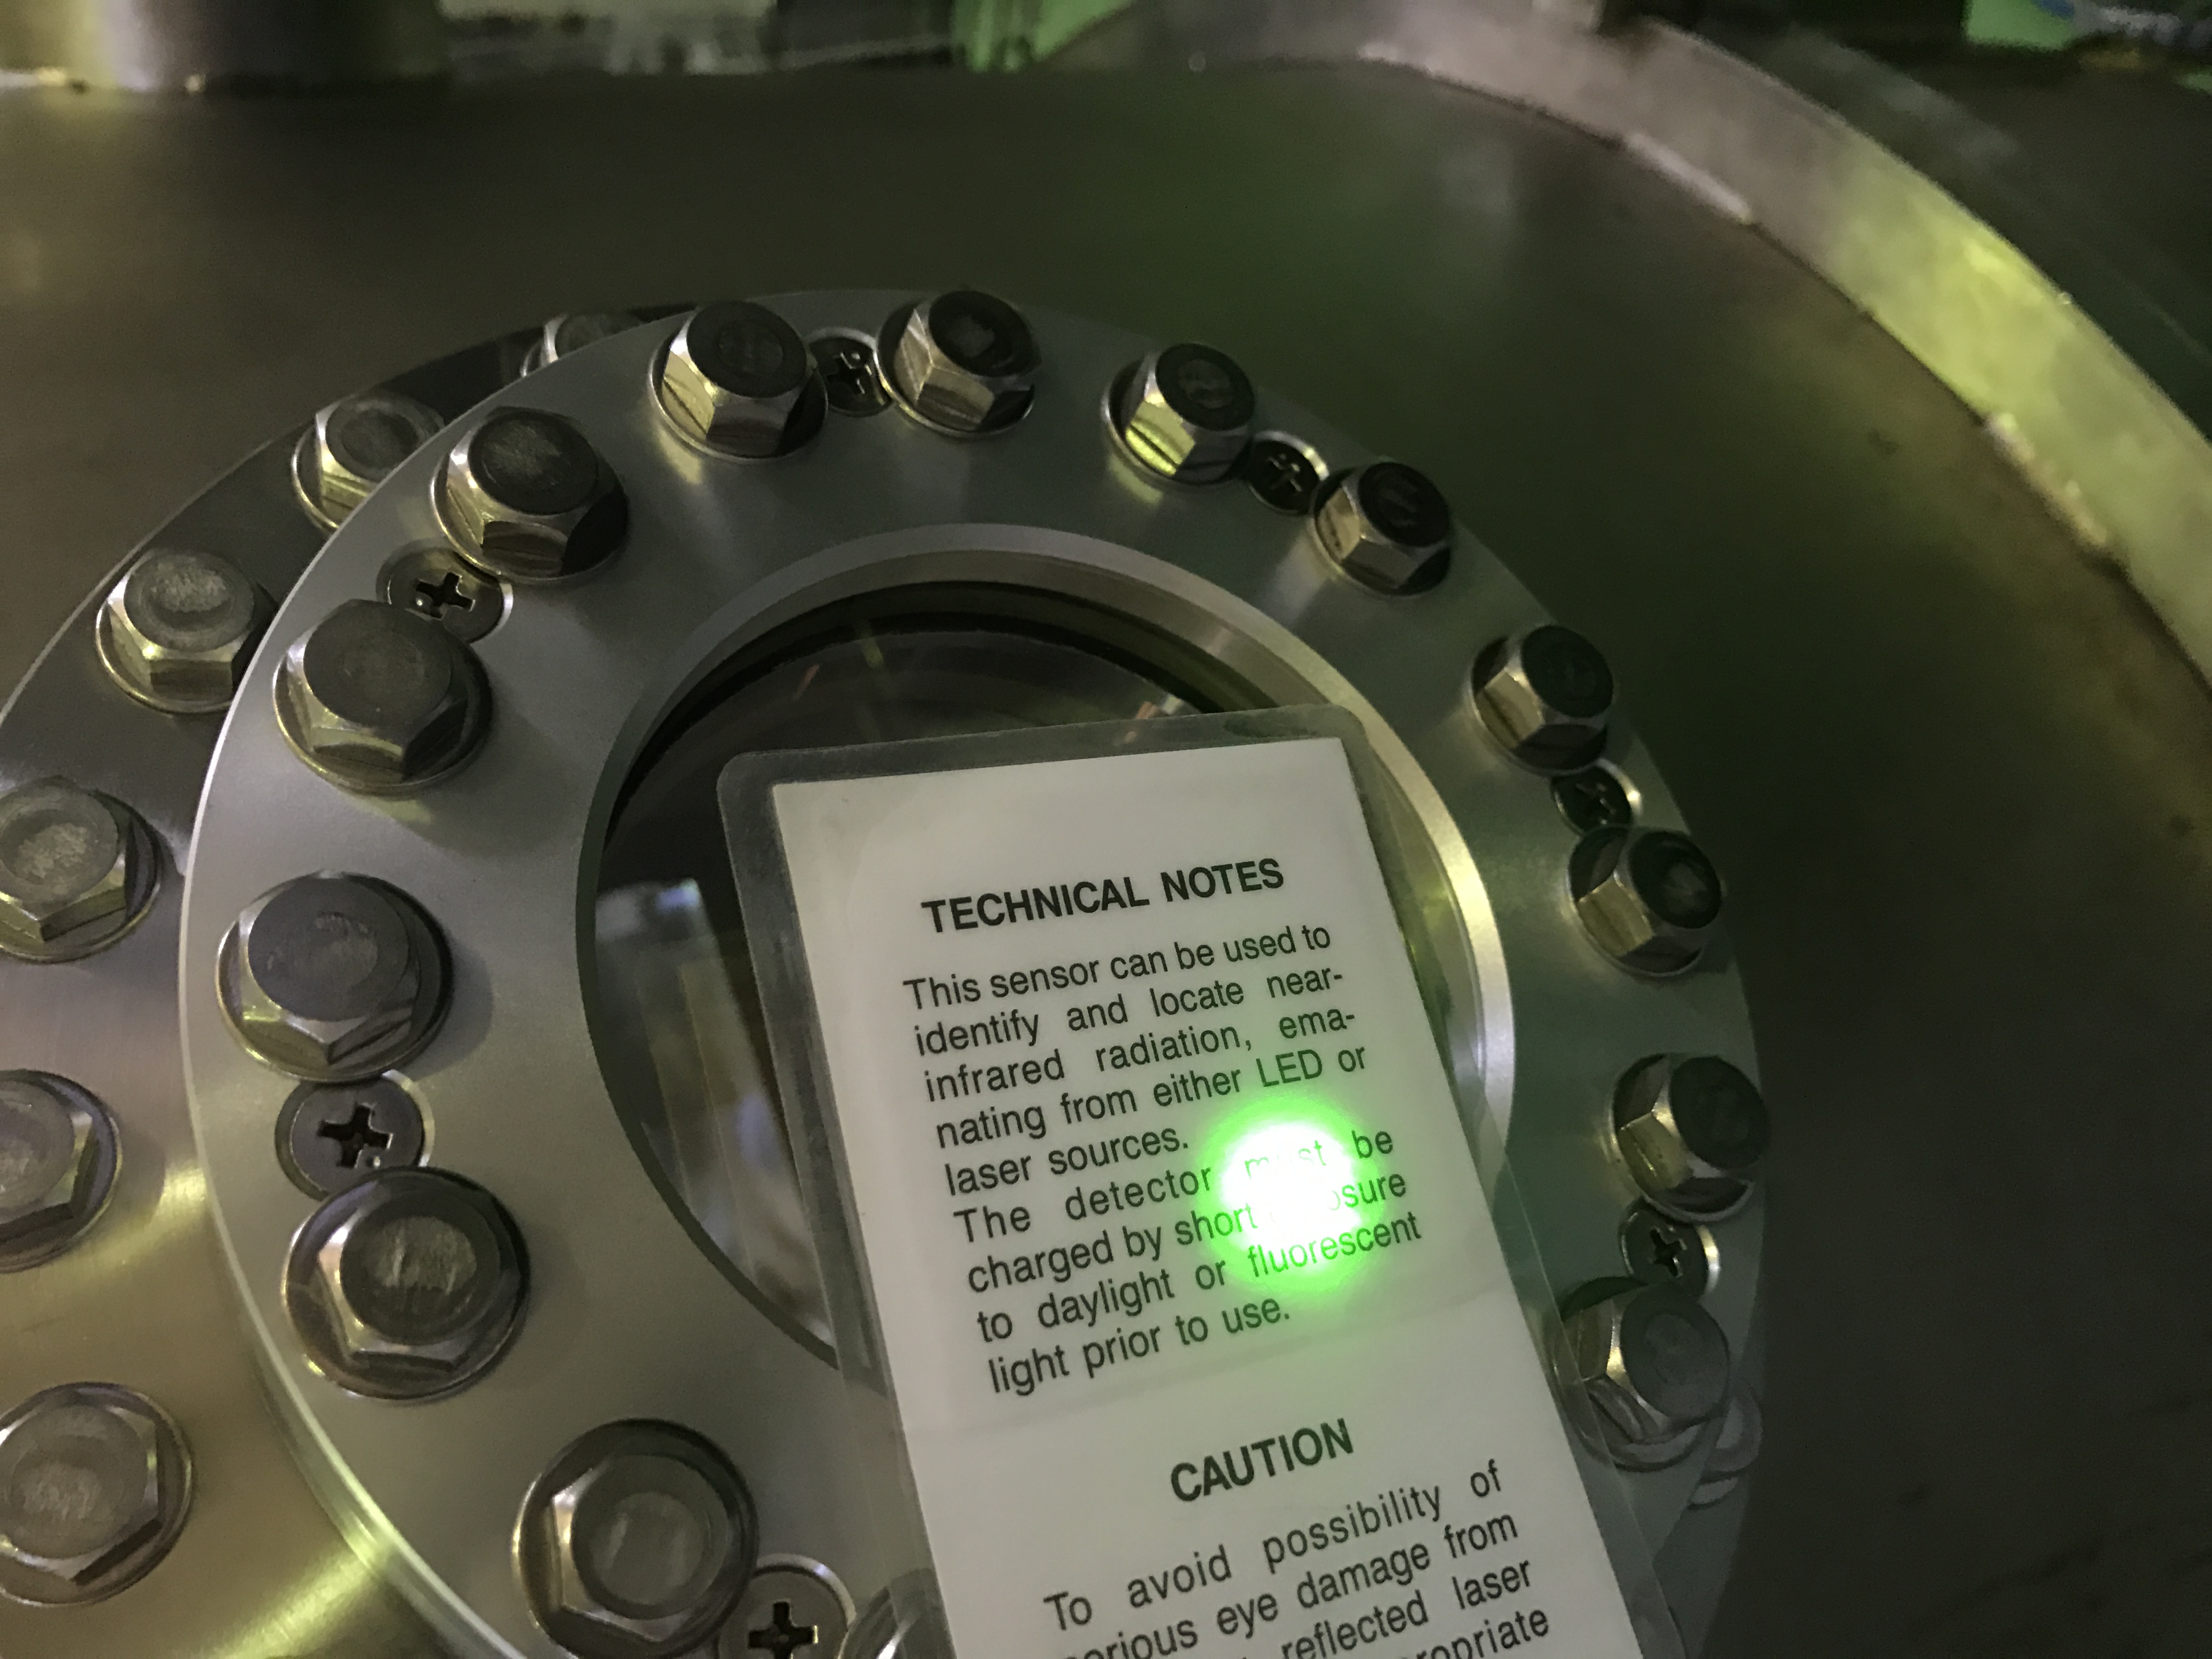
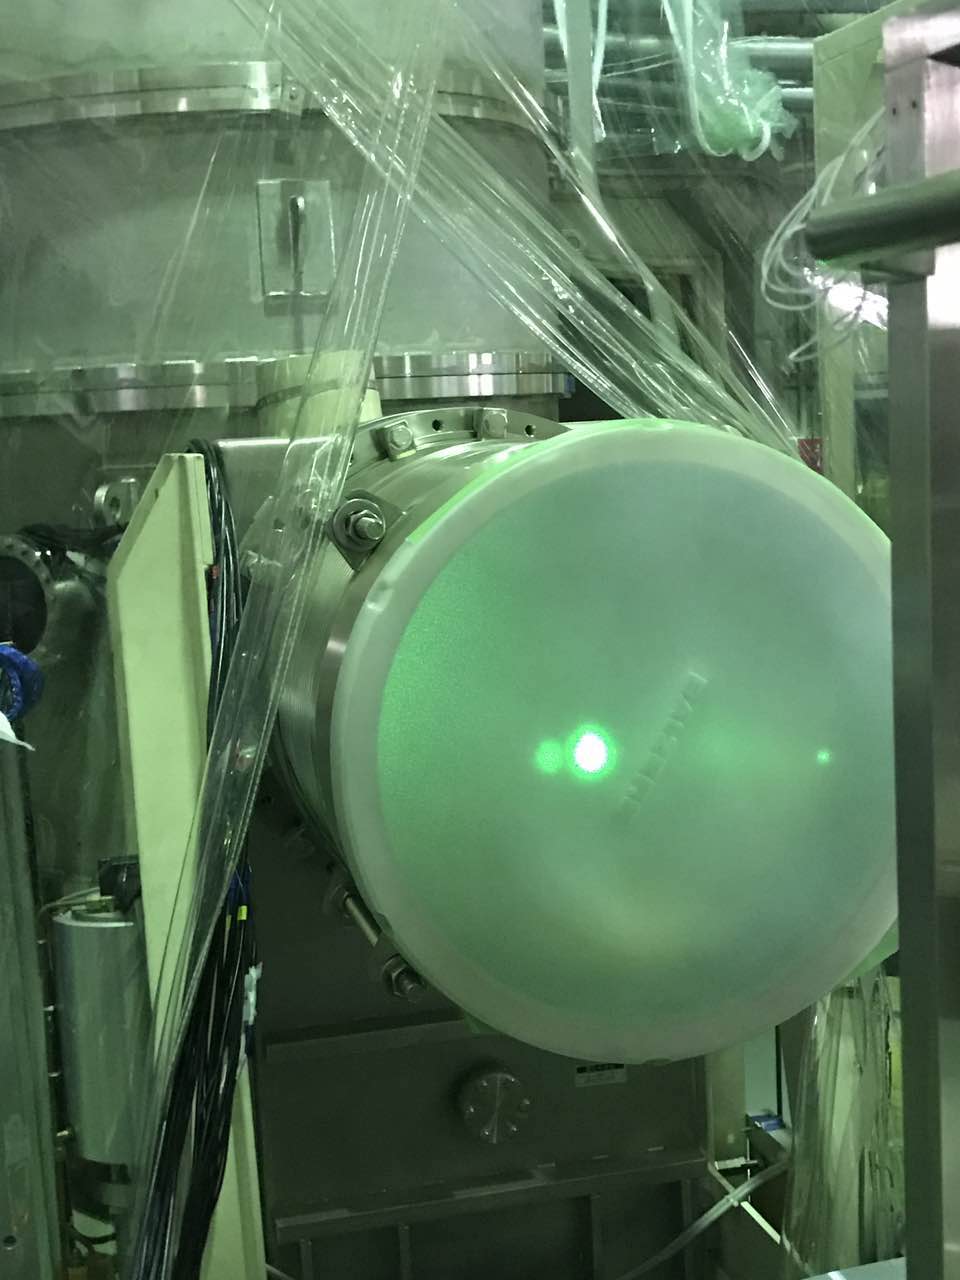
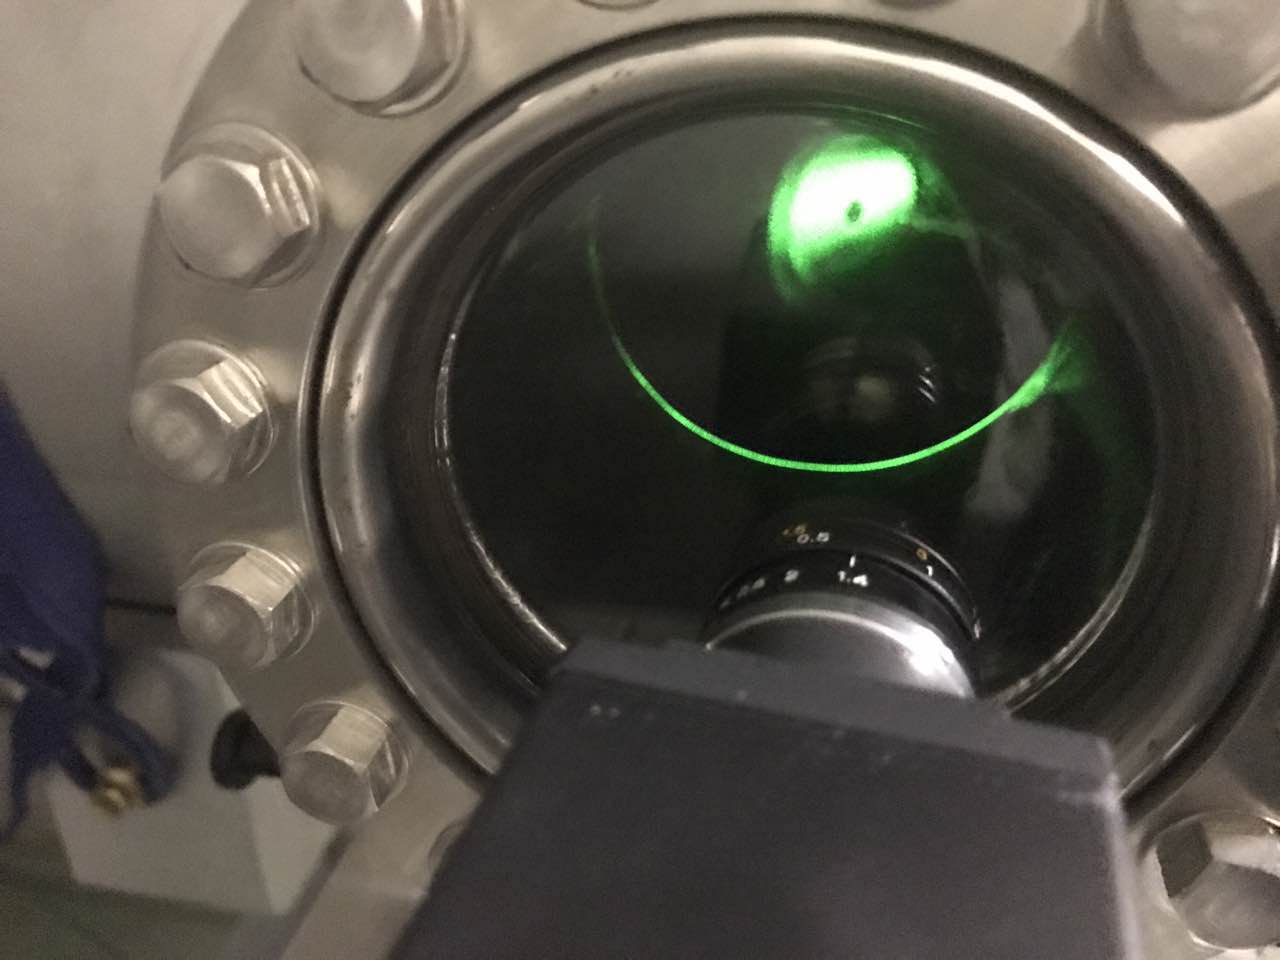
I tried to investigate which mirror is suspended in the NM2 chamber.
According to the records it should be a LISM mirror with the two faces flat.
So I reflect a green pointer on the mirror and collect the two reflections
from the two sides of the mirror. I let the beams propagates over about
15 m. I can't see any difference between the beams along the propagation.
So the two sides of the mirror are both flat (or both curved with a large
curvature). The distance between the two reflections is about 2.7 cm and does
not change in a significant way along the 15 m, so the mirror does not
have a large wedge.
RaffaeleFlaminio - 16:11, Thursday 13 April 2017 (450)
Position of stack in NM2 ?
Today I tried to evaluate how far is the center of the NM2 stack from the tube axis.
I define as the tube axis the axis defined by the window on the valve between the NM2 chamber and the
tube and first target in the tube. So I placed an He-Ne beam on that axis.
I doubt to be able to defined that axis to better than 0.5 cm in position and 1 cm over ~10 m in angle.
This axis intercepts the stack in the NM1 22.2 cm in height and 1.8 cm to the west.
I estimate that I have about 1 cm error on this numbers.
Comments related to this report
I check again the axis and re-adjusted a little bit the He-Ne laser beam position
trying to have it better centered on the valve's window.
The height respect to the stack doesn't change. The lateral position is now 1.4 cm
west.
trying to have it better centered on the valve's window.
The height respect to the stack doesn't change. The lateral position is now 1.4 cm
west.
I repeat the same procedure but this time I injected the He-Ne laser beam from behind the mirror i.e.
the He-Ne laser beam goes through the input mirror. Also in this case I centered the He-Ne laser beam
on the the first target in the tube and on the window at the entrance of the tube.
In order to do so the injection point from the back of the suspension is 21.8 cm in height and 2.4 cm
to the west.
the He-Ne laser beam goes through the input mirror. Also in this case I centered the He-Ne laser beam
on the the first target in the tube and on the window at the entrance of the tube.
In order to do so the injection point from the back of the suspension is 21.8 cm in height and 2.4 cm
to the west.
YuefanGuo - 10:46, Thursday 13 April 2017 (449)
Update of picomotor working
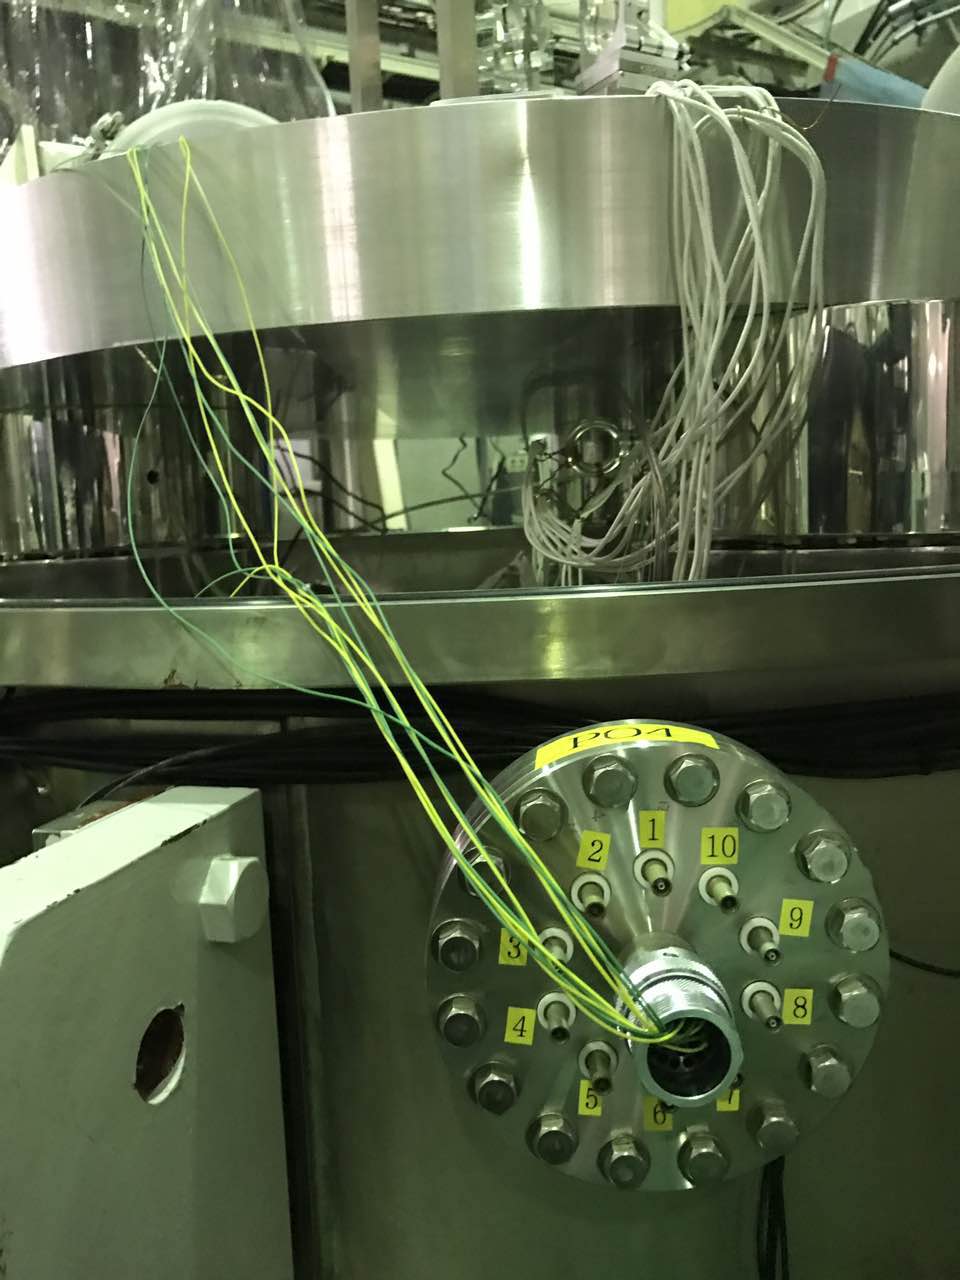
Yesterday Marc and I finished all pins for all picomotors (5 for input mirror, 8 for BS chamber, 9 for PR chamber), including extending the cables for BS suspension mirror(all the green and yellow wires in 1st picture), since the BS chamber and the input mirror will use the same picomotor driver, and the cable we have now is not long enough. But we still need to make the cover for these extending cables, we already found some plastic tubes and will finish it today.
In the second picture, there are totally five layers of the picomotor driver, except the first layer(command layer) is for pad, external port, which cannot connect to picomotors, the other four layers each has 3 ports, so now we have 12 ports for BS chamber and input mirror, and actually we still need one more port.
Yesterday, we test all the picomotors connected to this driver, all of them worked well with the command send from the computer, we tried with pad for control the five picomotors for input mirror, they worked well, but there is one thing we cannot understand is that on the pad(3rd picture), on the top of it, there are two axis, x and y, some of the picmotors work with x axis and others work with y, we cannot figure out what these axis means.
The other problem is that on the pad, the maximum layers we can control is 3, so if we have more than three layers, we cannot control with the pad.
For the PR chamber, we are going to use the other driver with 1 command layer with other 3 layers totally 9 ports to control, we will try to set a new IP address for the new driver.
Also we got a set of driver from Kamioka yesterday, one command layer with other 2 layers. So now we have enough command layer(one for BS and IM, one for PR, and one for EM), the port layer(5 for BS and IM, 3 for PR,1 for EM), we still lack of one port layer if all the driver we have now work well.
Images attached to this report
YuefanGuo - 20:23, Tuesday 11 April 2017 (448)
Comment to Change the new picomotor driver (Click here to view original report: 447)
Add the pictures
Images attached to this comment
YuefanGuo - 20:22, Tuesday 11 April 2017 (447)
Change the new picomotor driver
Today we changed the picomotor cable of the input mirror into the type matching the new driver(shows in the second picture). And according to the standard way of putting the pin, we put them into the right order, show in the first picture. The new picomotor driver's IP address has already set up by Eleonora(133.40.121.13). We connected this IP address with the computer, check all the picomotors, they all worked well.
From the second picture can also see that now, since we only need to control five picomotors, so we only put two layers(except the first layer).
I list this simple command to move the picomotor for easy checking later: now for us there are only a1,a2 two layers, and each layer have 0,1,2 motor
chl--> to see which motor is working in each layer
chl a1=1--> change the working motor of a1 to 1
vel--> check the velocity of each motor
vel a1 1=1000 -->change the velocity of a1 motor 1 to 1000
rel a1 1000 g --> move a1(the motor which move is defined by the second command)
Next step we are going to make and change the all the cables of the BS and PR chamber, the BS chamber can use the same driver with the input mirror, just add more layers. But for the PR chamber, we need to use a new driver, which means we need to set up another IP address for that driver. There is also one driver left then for the end mirror. Also we need to check if the picomotors also work well with the pad.
Comments related to this report
Add the pictures
Images attached to this comment
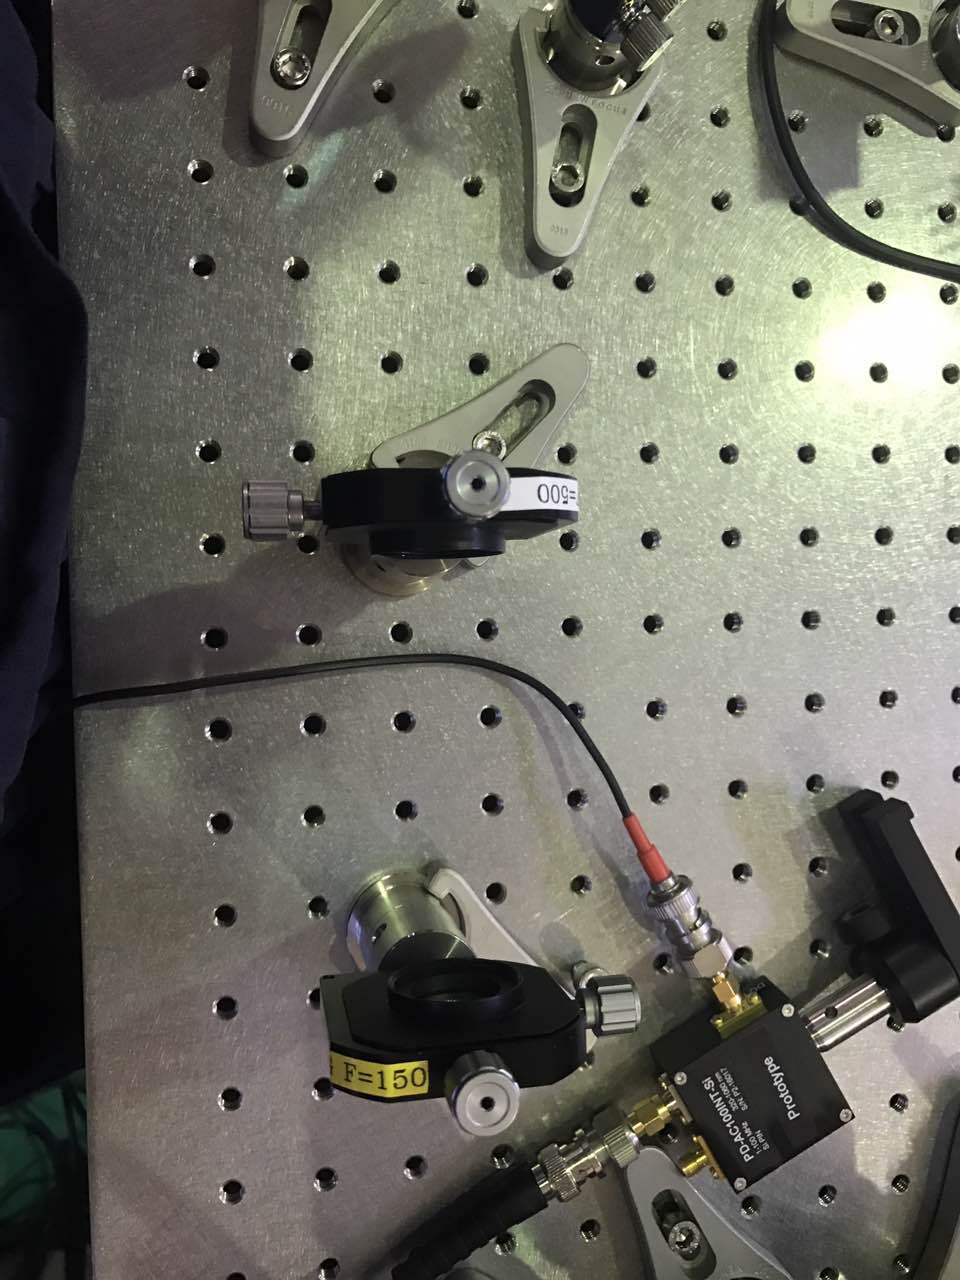
YuefanGuo - 02:33, Tuesday 11 April 2017 (445)
Check the green beam
I tried to put lens on the green path, for one side, to reduce the beam size for easier measurement, the other side to check if the distortion of the beam change or not.
I put the 500mm focal length lens after the lens we have now, shows in the first picture, under this circumstance, the beam is still circular after the bs mirror of the MZ, but after the mirror of the MZ, it becomes two separated circular beams because the second surface reflection of that mirror. These two beam goes along the path, at some point around the last mirror on the bench, they overlapped. So before the beam goes into the window, it is a really good beam, but after the window it’s separated into two again, so at first I thought maybe this is the reason of the distortion.
Then I blocked the reflection beam from the mirror on the bench, only left the main one, the second beam after the window is still there, so this second beam is produced by the reflection of the window.
Then inside the chamber, the beam after the window, only the main one arrives at the first dichoric mirror, the other one hit the frame of the suspension. So till here, we only have one circular beam, then I checked beam between the PR chamber and the BS chamber, it turns into ellipses. We talked with Matteo and we thought the problem is from the dichoric mirror which combine the green and the infrared. But since now we are not in a very good alignment, we will do the alignment again, and then check the shape of the beam. If it is still the same, we will change the dichoric mirror and to see if we can have some positive result.
For choosing the lens to reduce the beam, now I don't know what kind of focal length I should use. I think I will do one calculation with the measurement I did, got some result, and to see the roughly range of the focal length I can use, then put them there and do the measurement again to find better combination.
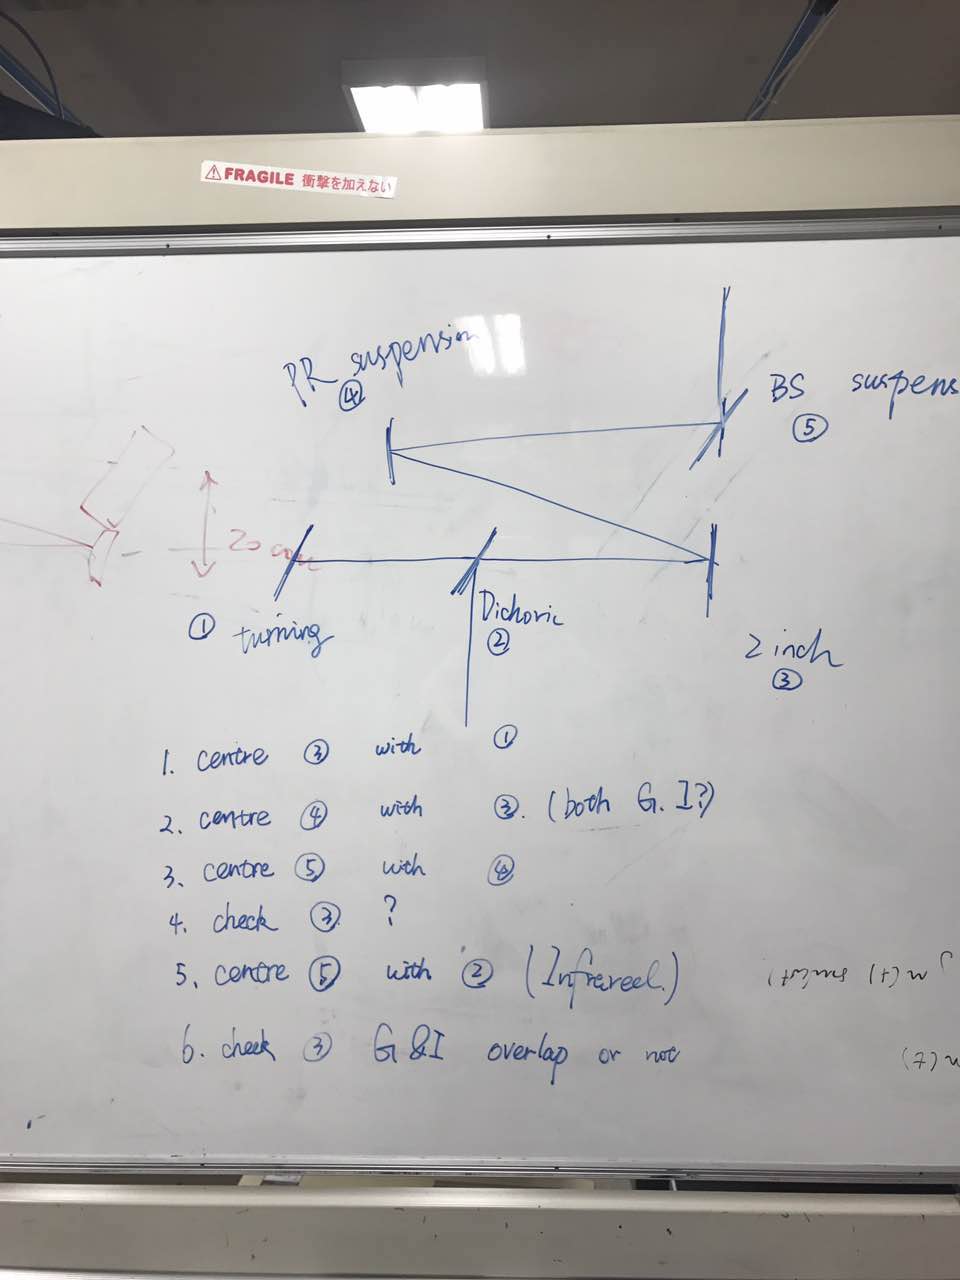
About re-align the beam, Matteo also gave us some steps to do that:
(All the things we need to move including, the turning mirror for green, the dichoric mirror for combining the green and infrared, the 2 inch mirror of the telescope, the PR suspension mirror, the BS suspension mirror. The mirrors are in the order of the beam pass through.)
1.Put the target in front of the 2 inch mirror, move the turning mirrors to center it.
2.Put the infrared card in front of the PR suspension mirror, center the green (and infrared?) with moving the 2 inch mirror.
3.Target in front of the BS suspension mirror, move the PR suspension mirror.
4.Check if the beam is centered at the 2 inch mirror(?)
5.Center the infrared beam on the BS suspension mirror with moving the dichoric mirror.
6.Check at the 2 inch mirror, the green and the infrared surpass or not.
Repeat these steps, until everywhere is centered.
I put the 500mm focal length lens after the lens we have now, shows in the first picture, under this circumstance, the beam is still circular after the bs mirror of the MZ, but after the mirror of the MZ, it becomes two separated circular beams because the second surface reflection of that mirror. These two beam goes along the path, at some point around the last mirror on the bench, they overlapped. So before the beam goes into the window, it is a really good beam, but after the window it’s separated into two again, so at first I thought maybe this is the reason of the distortion.
Then I blocked the reflection beam from the mirror on the bench, only left the main one, the second beam after the window is still there, so this second beam is produced by the reflection of the window.
Then inside the chamber, the beam after the window, only the main one arrives at the first dichoric mirror, the other one hit the frame of the suspension. So till here, we only have one circular beam, then I checked beam between the PR chamber and the BS chamber, it turns into ellipses. We talked with Matteo and we thought the problem is from the dichoric mirror which combine the green and the infrared. But since now we are not in a very good alignment, we will do the alignment again, and then check the shape of the beam. If it is still the same, we will change the dichoric mirror and to see if we can have some positive result.
For choosing the lens to reduce the beam, now I don't know what kind of focal length I should use. I think I will do one calculation with the measurement I did, got some result, and to see the roughly range of the focal length I can use, then put them there and do the measurement again to find better combination.
About re-align the beam, Matteo also gave us some steps to do that:
(All the things we need to move including, the turning mirror for green, the dichoric mirror for combining the green and infrared, the 2 inch mirror of the telescope, the PR suspension mirror, the BS suspension mirror. The mirrors are in the order of the beam pass through.)
1.Put the target in front of the 2 inch mirror, move the turning mirrors to center it.
2.Put the infrared card in front of the PR suspension mirror, center the green (and infrared?) with moving the 2 inch mirror.
3.Target in front of the BS suspension mirror, move the PR suspension mirror.
4.Check if the beam is centered at the 2 inch mirror(?)
5.Center the infrared beam on the BS suspension mirror with moving the dichoric mirror.
6.Check at the 2 inch mirror, the green and the infrared surpass or not.
Repeat these steps, until everywhere is centered.
Images attached to this report