NAOJ GW Elog Logbook 3.2

Katsuki-san, Marc
We placed the ETMY jigs, jacks and metal/teflon rings inside a plastic box.
We used goro-goro to clean the floor and optical bench.
We moved several samples on the small table below the small clean booth.
We tidy up many cables and removed a malfunctioning usb hub. Now we don't have any more connections troubles with polarizers or powermeter.
We reinstalled the imaging unit (z_IU=68mm) and started to check the calibration factor with the surface reference sample.
We found that the maximum is with the translation stage at Z = 40.2 mm : R_surf = 16.6 /W.
We took several measurements between Z = 38.5 mm to 41.5 mm. The goal of these measurements is to find this Z position but also to be used later on to check if the lateral peaks could be useful to perform quicker alignment (to be compare with OSCAR simulations).
The next step is to scan the IU position.
We also brought the SHINKOSHA evaluation plate #7 to the storage room.
[Aritomi, Yuhang, Michael]
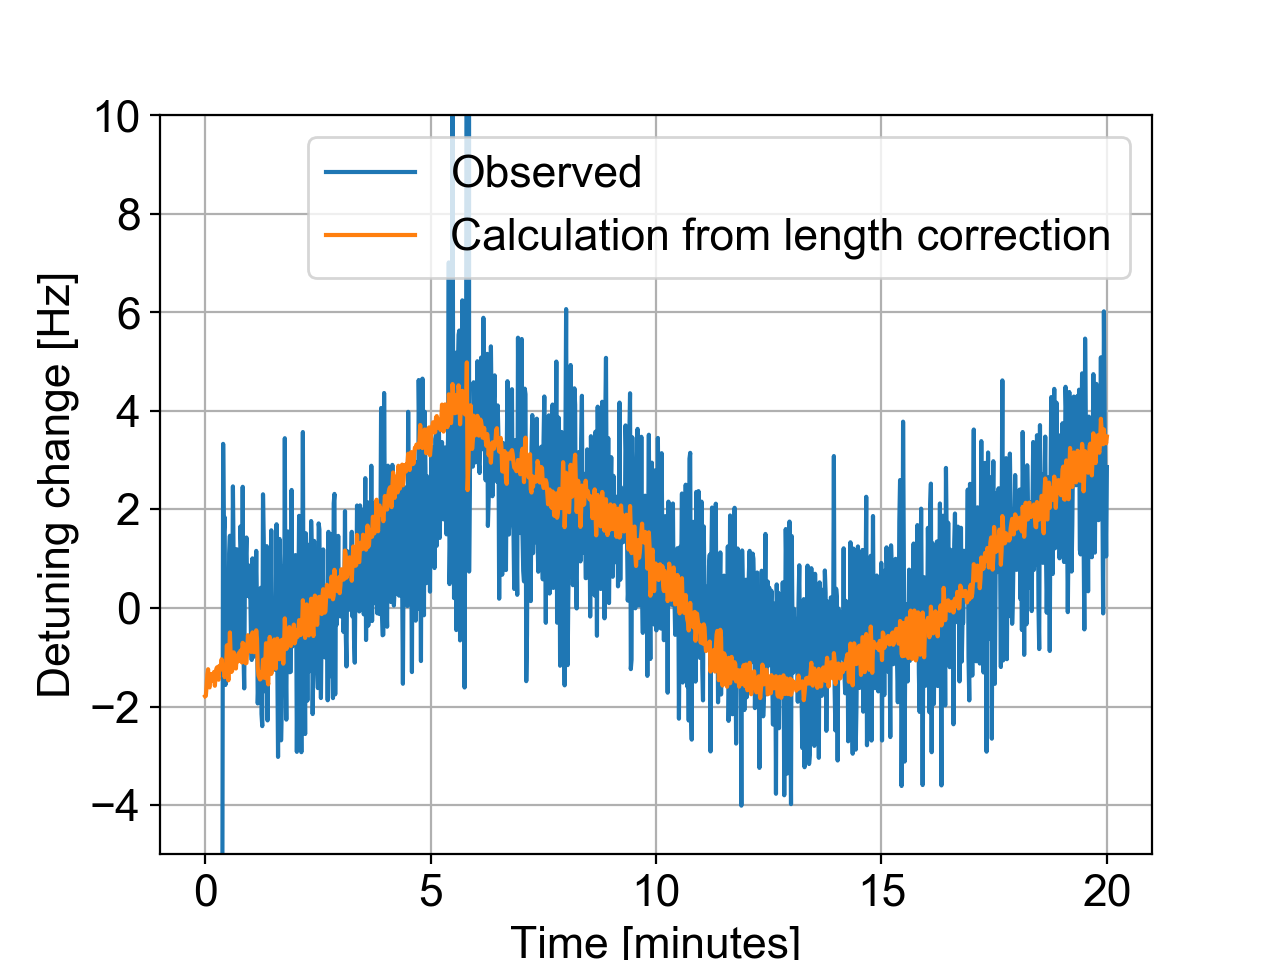
We measured CCFC FDS with fixed homodyne angle for 3 hours with 30 minutes interval (figure 1). We fixed OPO temperature to 7.163kOhm and p pol PLL frequency to 200MHz.
According to the least square fitting, the detuning changed by 9Hz in 3 hours even with fixed homodyne angle.
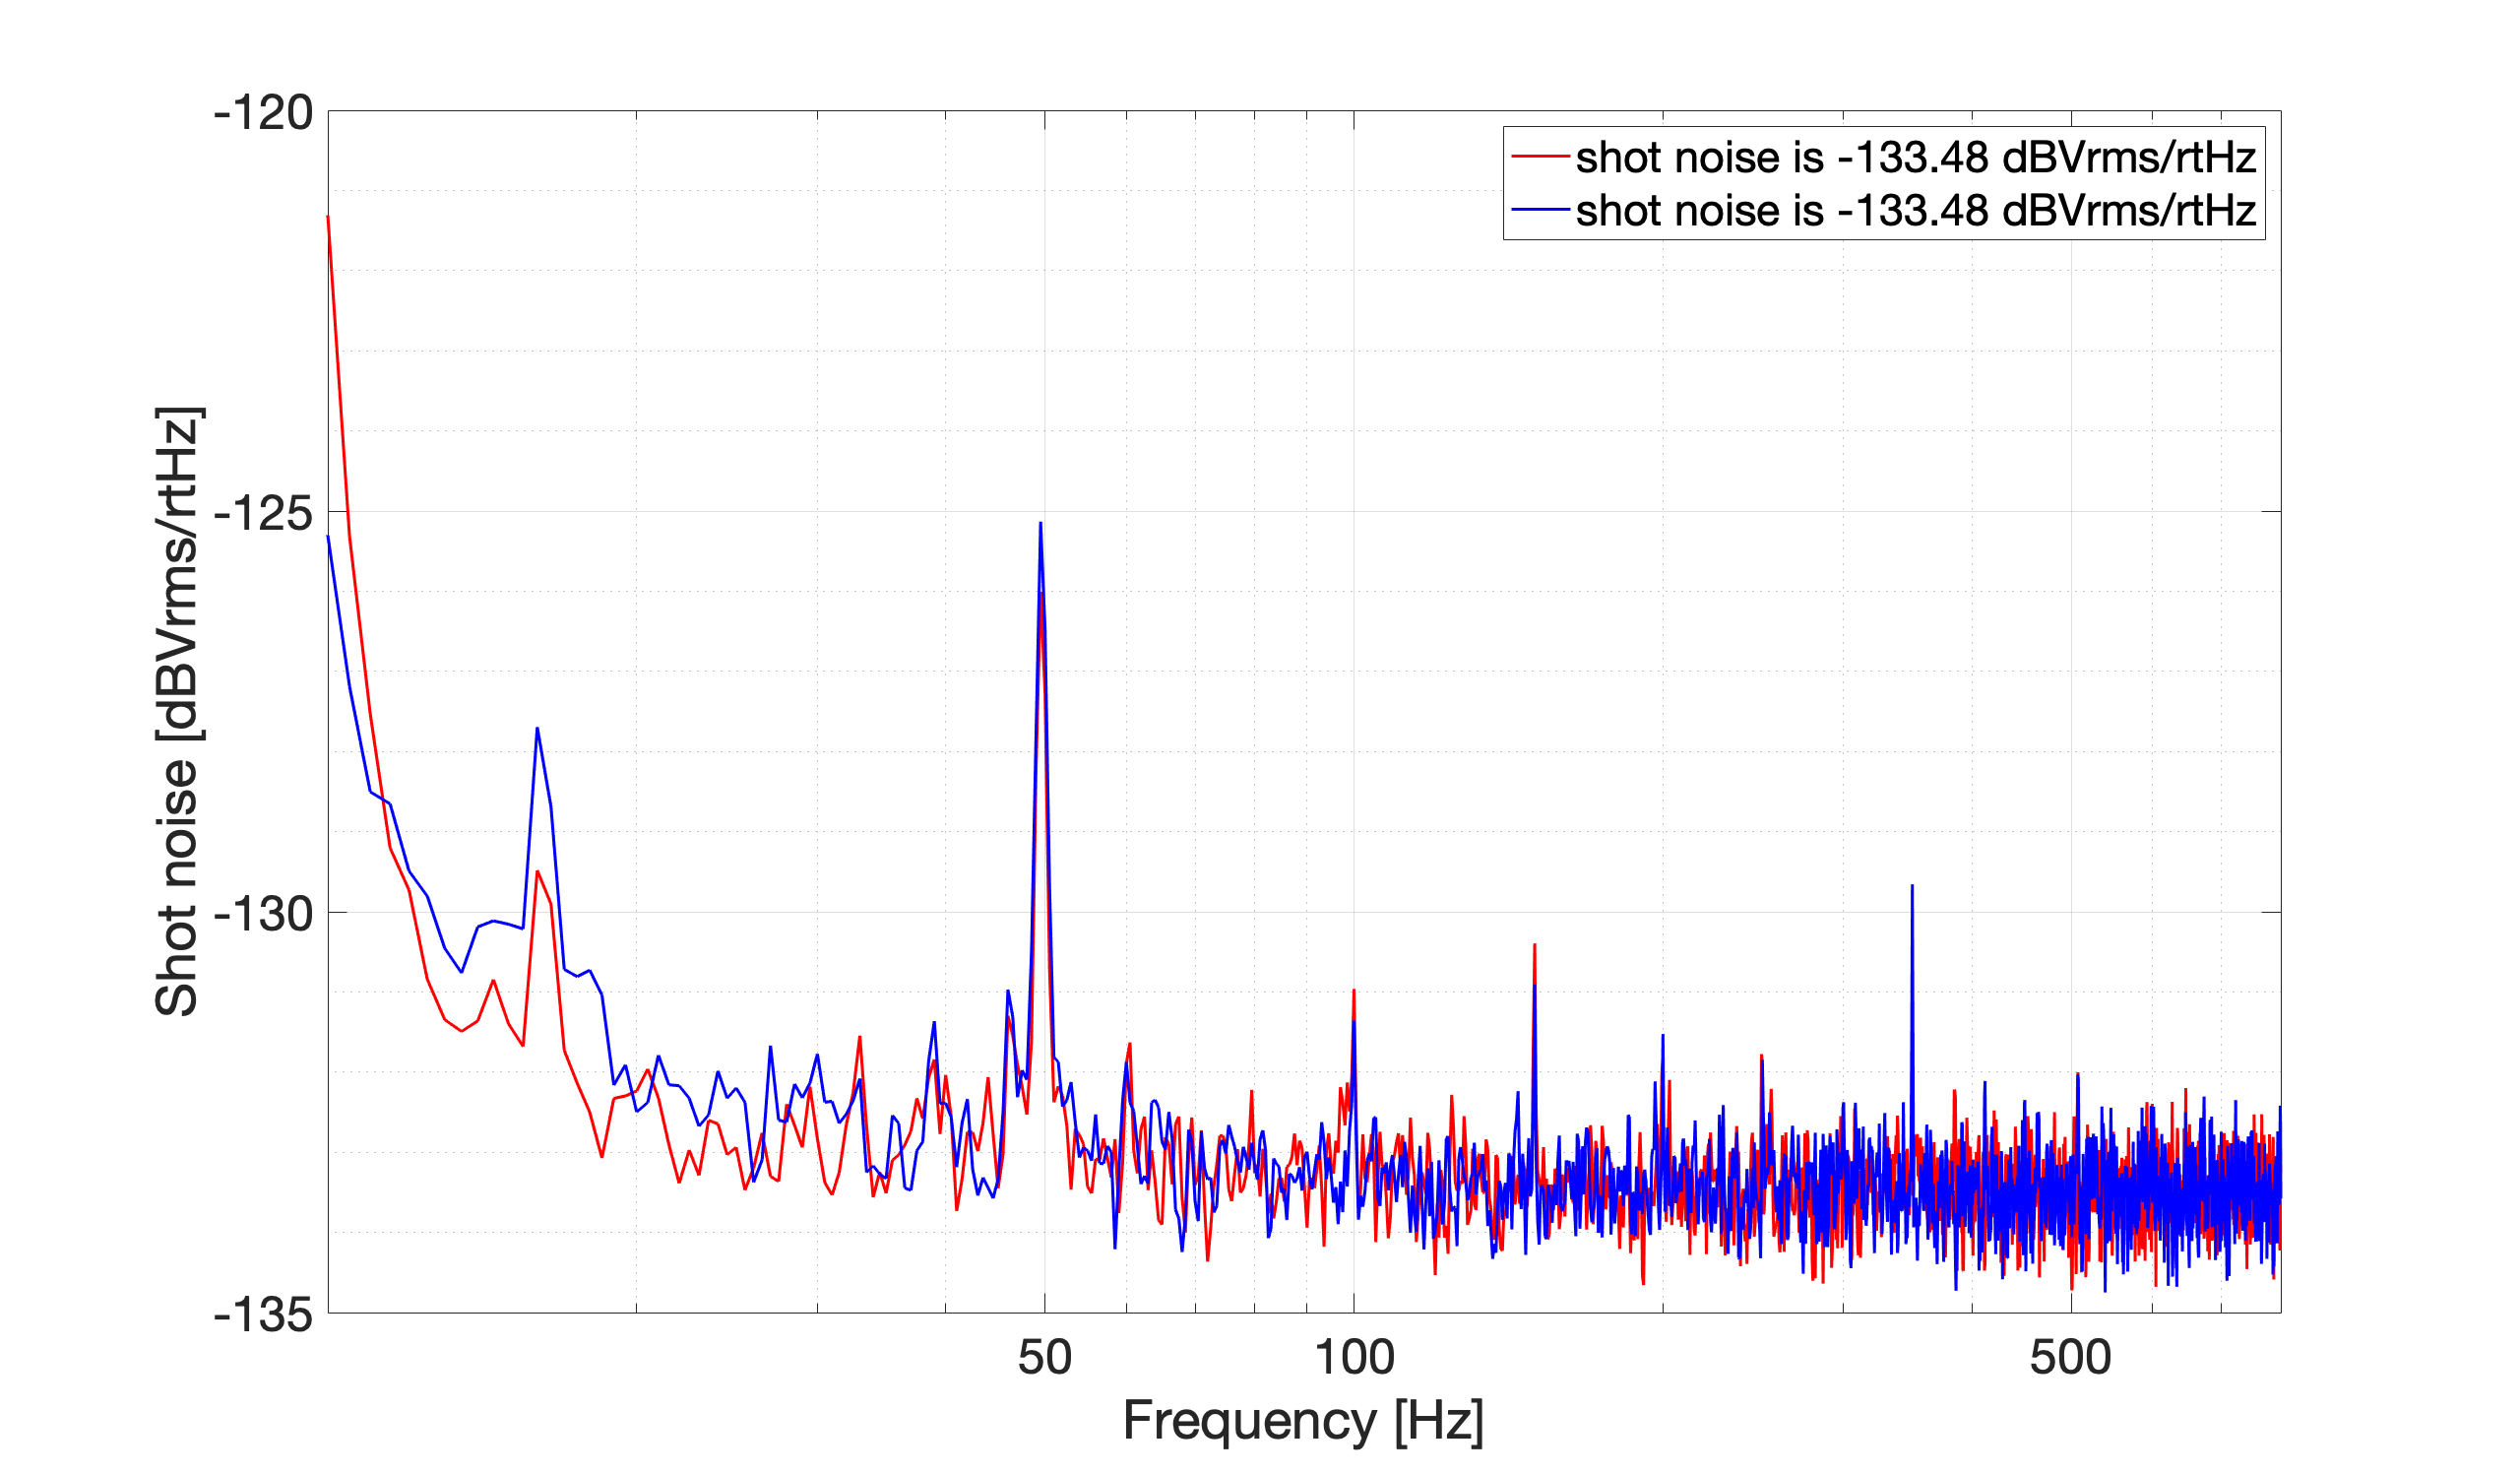
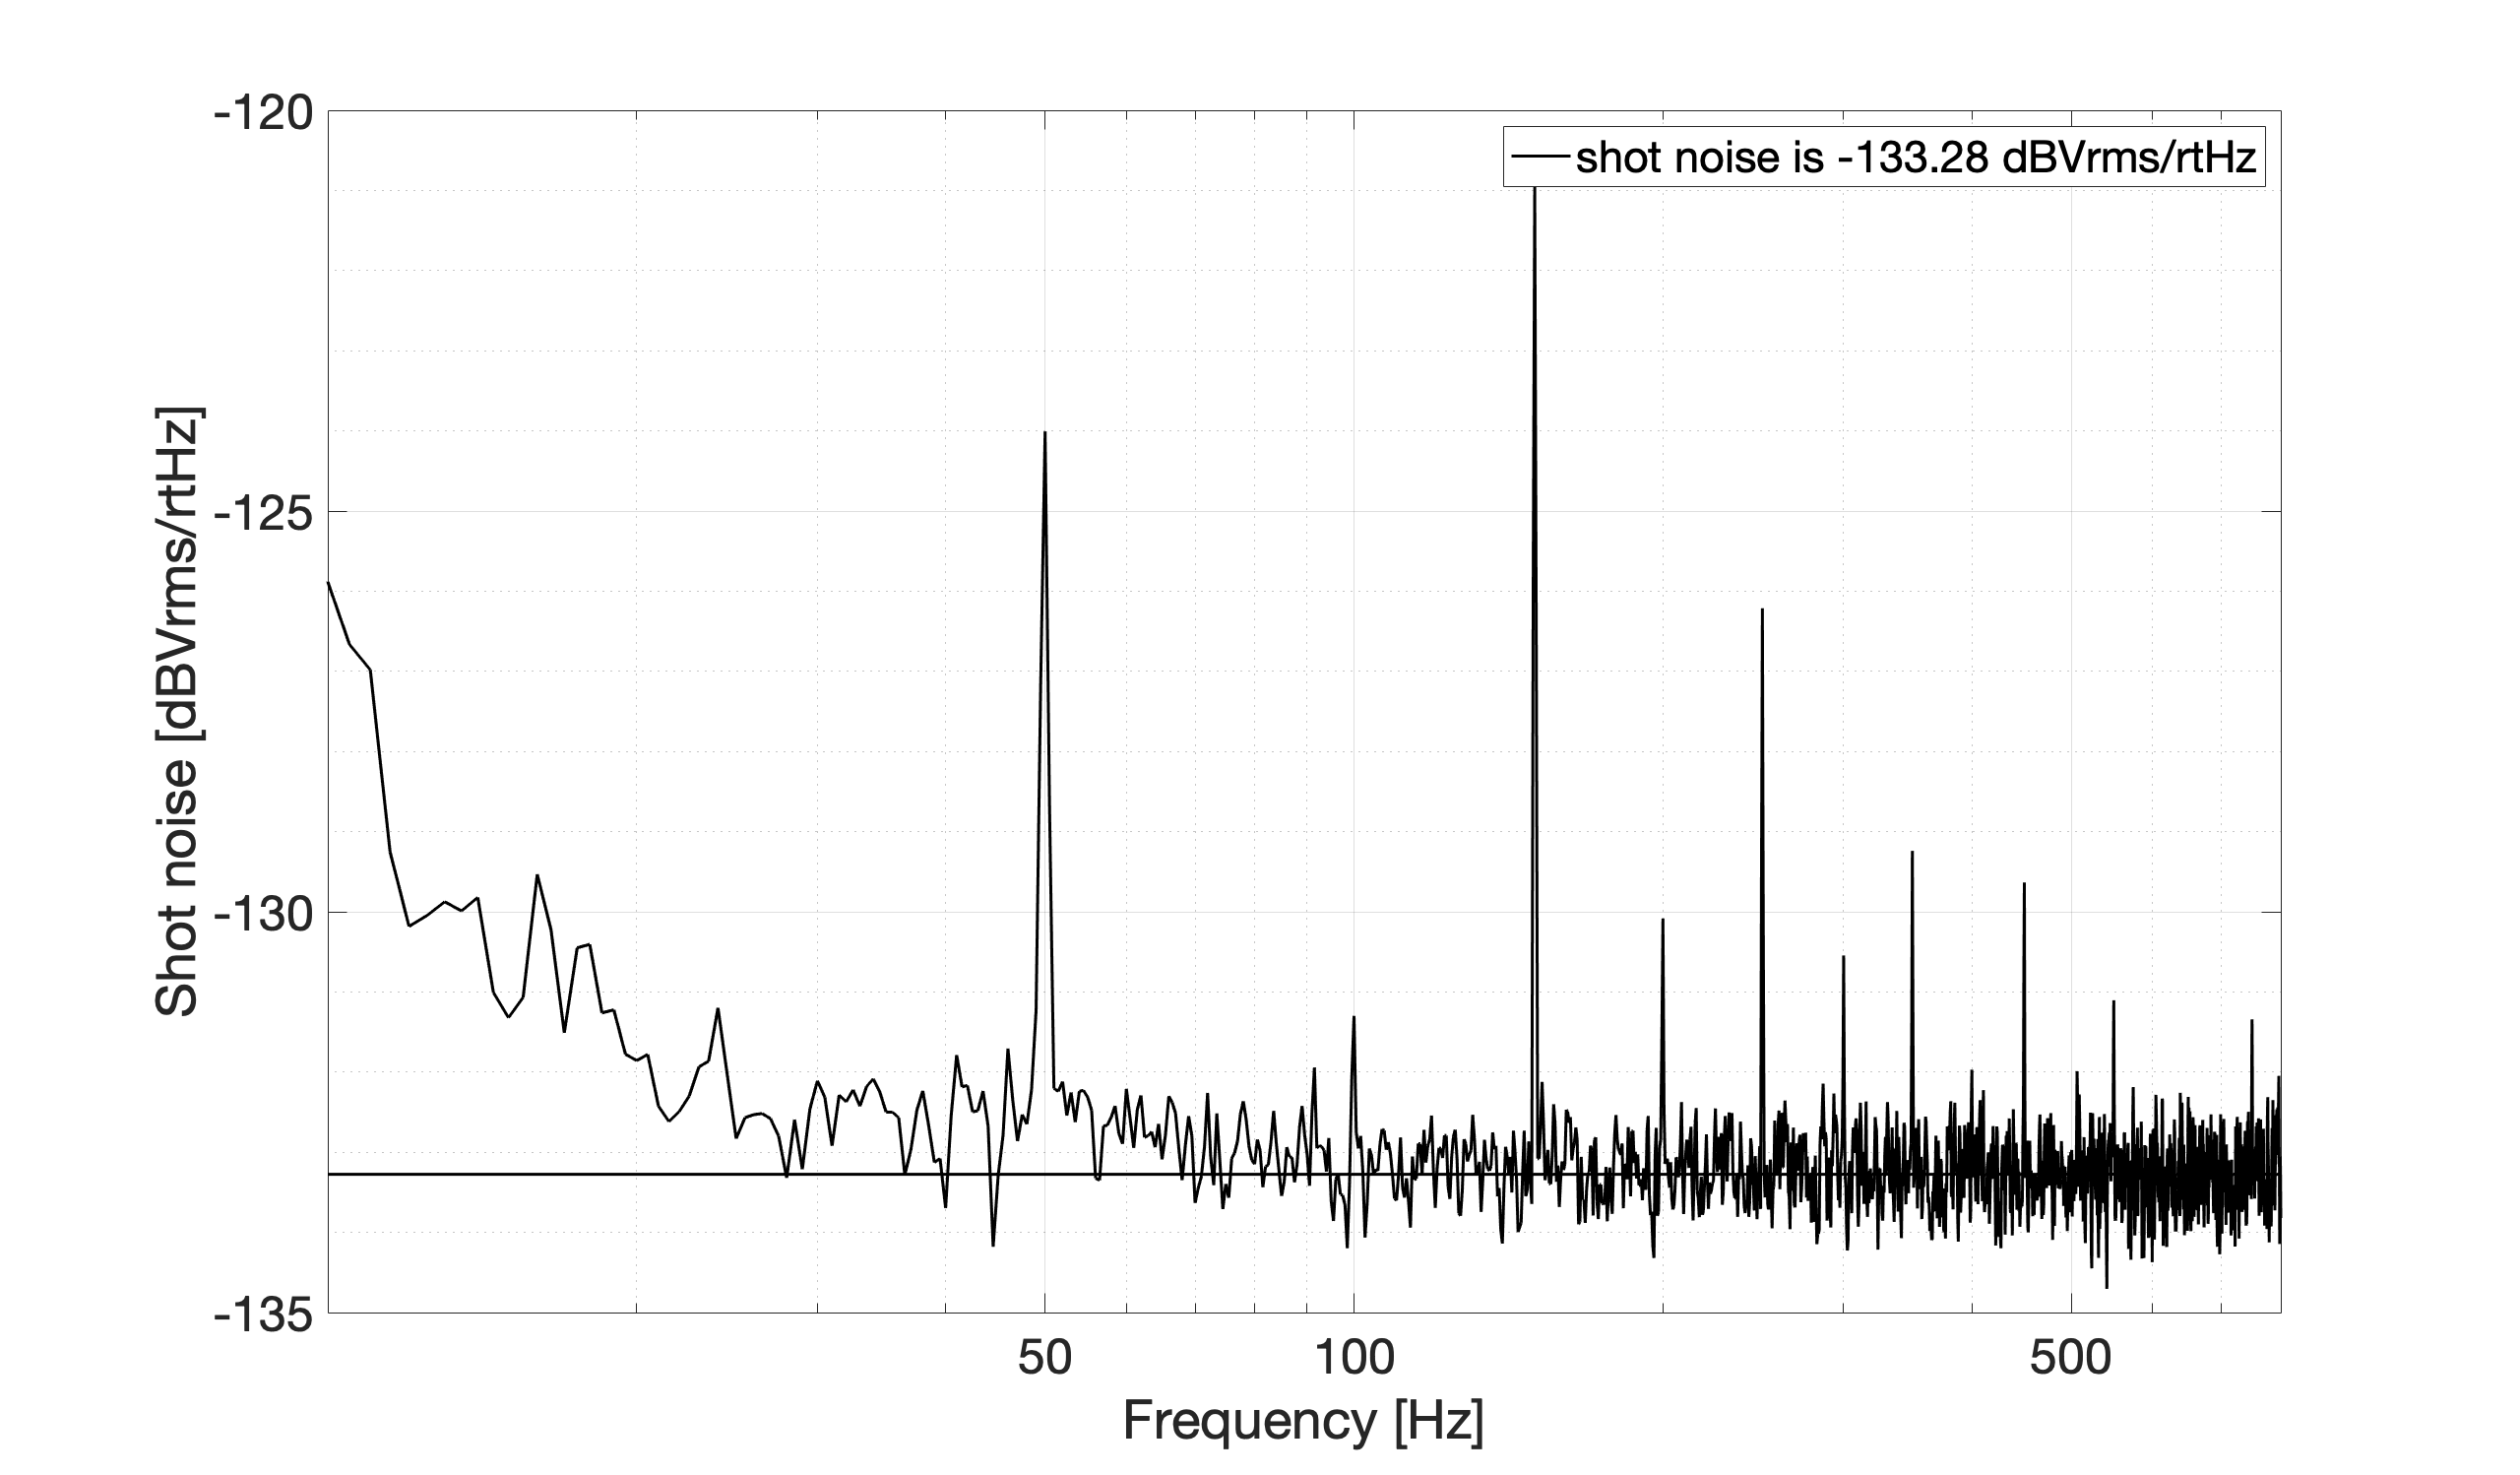
We measured shot noise before/after all the FDS measurement (figure 2). The shot noise is the same in 3 hours.
We also measured nonlinear gain after each FDS measurement. The nonlinear gain changed from 4.6 to 4.2 in 3 hours, which corresponds to generated squeezing of 10.3 dB to 9.8 dB.
Regarding the nonlinear gain measurement, we divided the BAB transmission with 20mW green by that without green. For BAB transmission with 20mW green, we fixed p pol PLL frequency to 200MHz and locked OPO and measured the maximum value of BAB transmission by scanning CC1 with 20mW green. The reason why we fixed the p pol PLL frequency is that it was fixed during the FDS measurement. For BAB transmission without green, we scanned OPO and measured the peak value of BAB transmission.
There are two mechanisms which change the BAB maximum with 20mW green. One is the nonlinear gain change and another is optimal p pol PLL frequency change (in other words, s&p overlap inside OPO or BAB detuning inside OPO). In the nonlinear gain measurement above, s&p do not always overlap inside OPO with 20mW green (BAB can be detuned inside OPO), while they overlap without green. This means that in this method, the measured nonlinear gain change is due to both of the real nonlinear gain change and optimal p pol PLL frequency change.
To measure the real nonlinear gain change, we need to optimize p pol PLL frequency every time we measure the nonlinear gain to make sure s&p overlap with 20mW green.
sqz_dB = 10; % generated squeezing (dB)
L_rt = 120e-6; % FC losses
L = 0.52; % propagation losses
A0 = 0.06; % Squeezer/filter cavity mode mismatch
C0 = 0.02; % Squeezer/local oscillator mode mismatch
ERR_L = 1.5e-12; % Lock accuracy (m)
ERR_csi = 30e-3; % Phase noise (rad)

I am very sorry that I sent a wrong information to Aritomi-san.
The optical losses information Aritomi-san listed is actually detuning in Hz. (If you compare this 'wrong' losses with detuning in legend of mcmc figure, you can see they are the same)
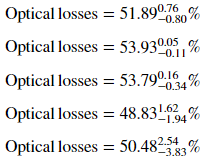
The real optical losses are attached in this comment. They change from 49% to 54%.
The detuning measurement had some problems. The main issue is that pointing loop was not kept to be zero while these scanning.
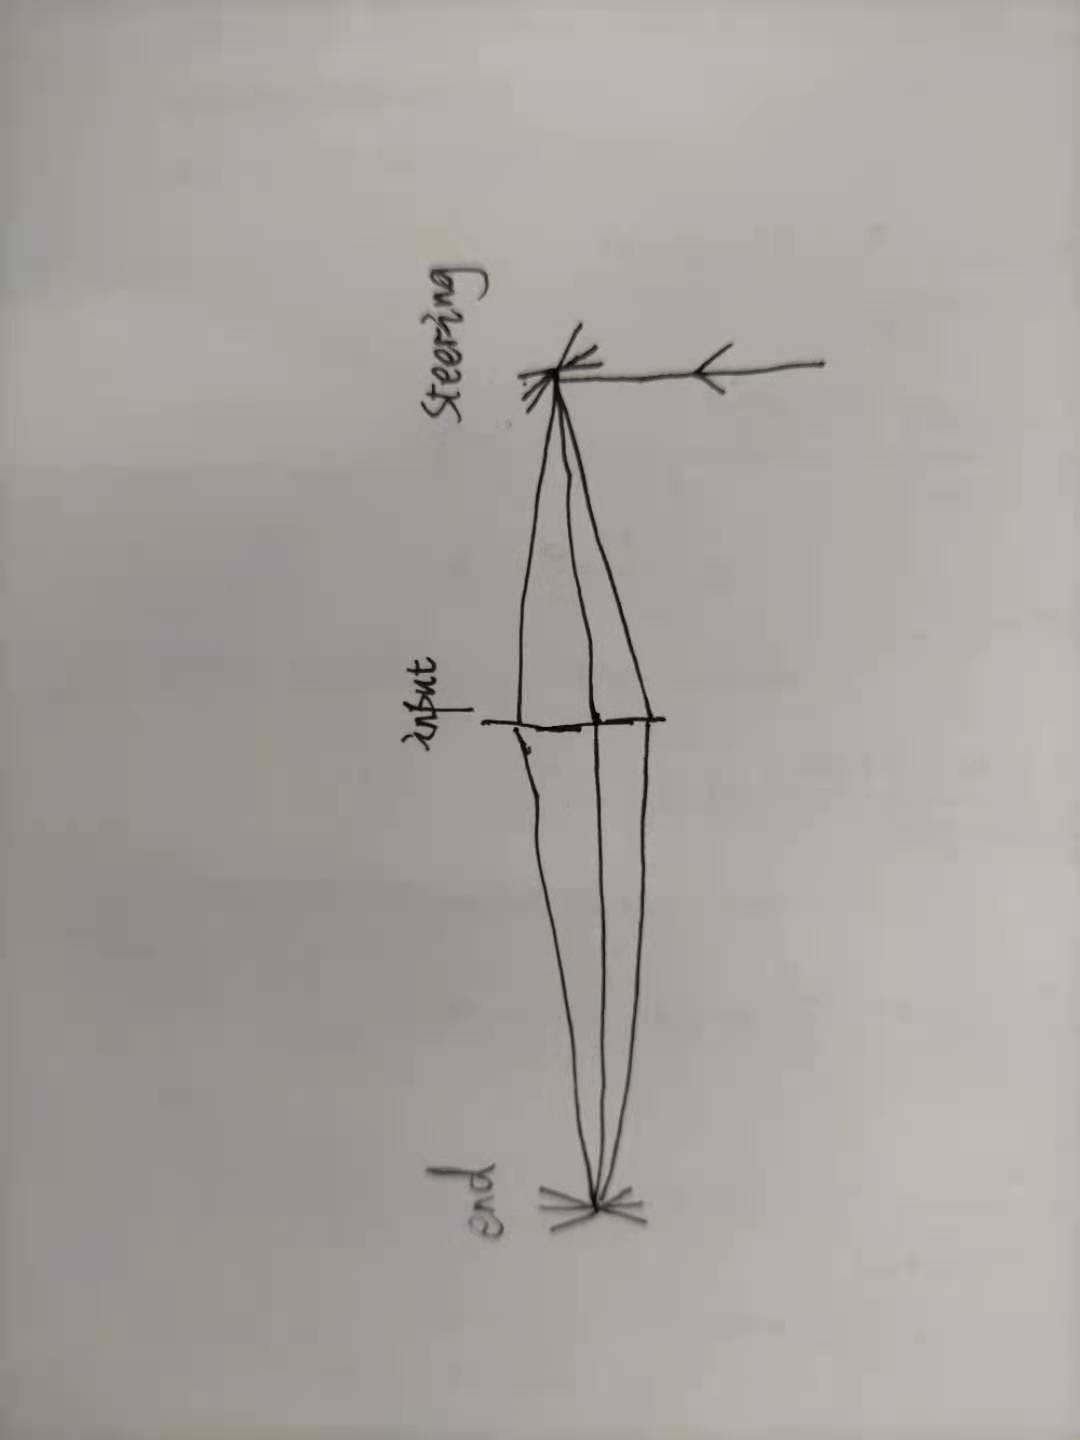
When pointing loop is kept to be zero, either we introduce pertubation to input or end mirror yaw/pitch, the beam hitting position can change only on input mirror. Therefore, when we do this scan, we are doing a map similar to elog2615. But instead of end mirror in elog 2615, this scan is for input mirror. Attached figure 1 shows the schematic of this scanning process.
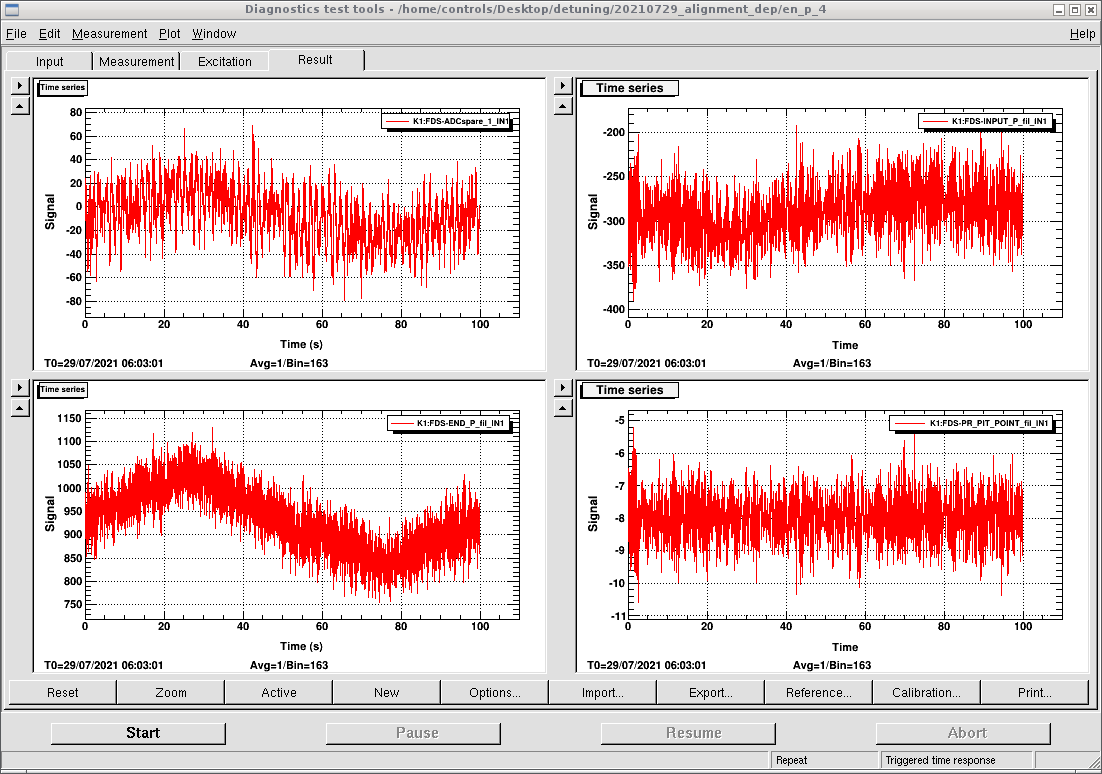
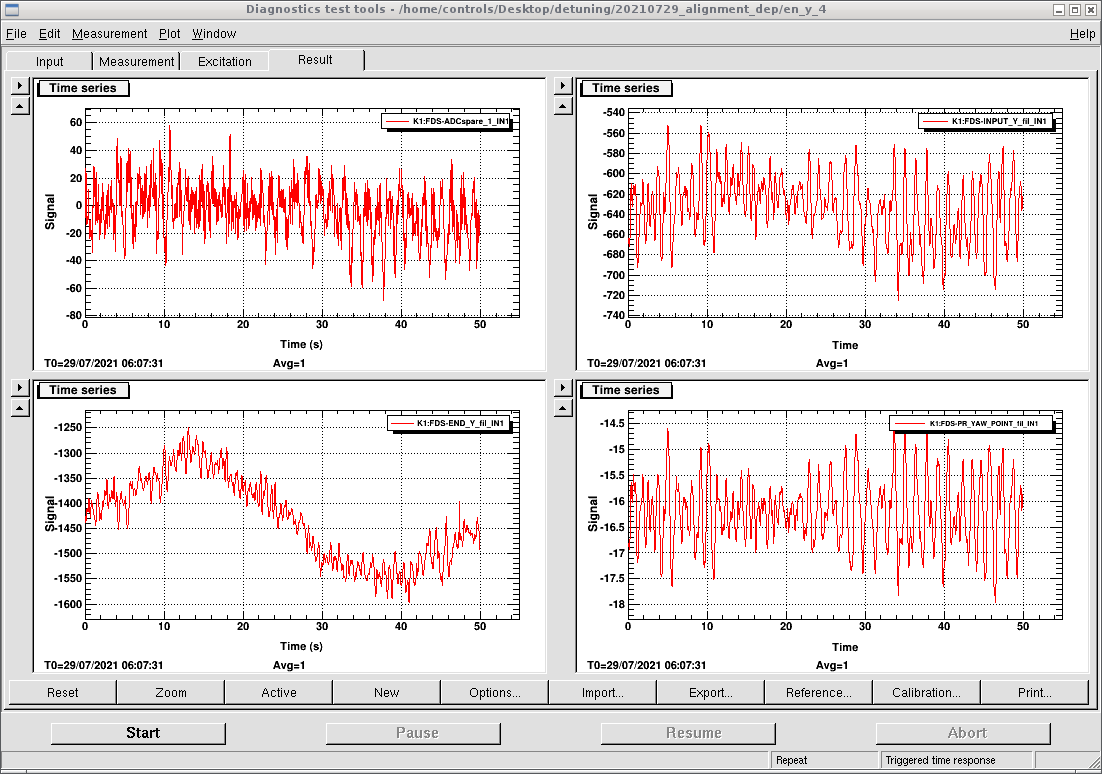
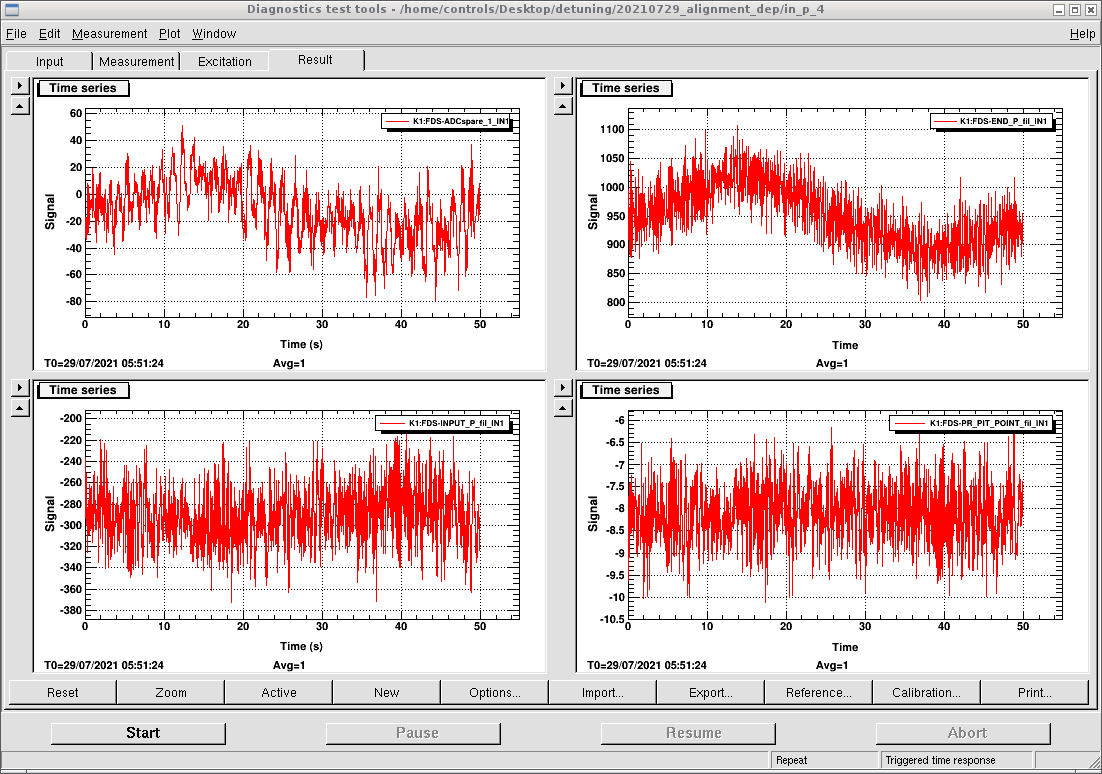
Since the PR/BS pointing loop has angular scanning range of about 200urad, which can scan a range only about 0.8mm on input mirror. After doing these scan on input/end mirrors y/p, we got detuning change, input/end mirror oplev signal, and pointing error signal as attached figure 2-5.
With position change of about 0.8mm on input mirror, the detuning change is less than 5Hz. (This is a detuning change smaller than the flat region found on filter cavity end mirror in elog2615.)
Matteo and Yuhang
The filter cavity detuning was found to be changing when we lock filter cavity with GR (elog2642, elog2640, elog2636). The reason is that the correction signal sent to main laser sensed by GR is not exactly IR required.
However, we found out if we change main laser frequency manually by large amount (500MHz), the detuning almost doesn't change before and after main laser frequency change. This is already observed in elog2636. In elog2636, the first unlock didn't make correction signal change, which tells us that main laser frequency was changed by ~40MHz and the re-lock is fast enough that cavity length didn't change. Therefore, in the re-lock, we saw the detuning changes continously. However, the second unlock of elog2636 had correction signal going back almost to zero. We can see that around this un-lock, there were some oscillations, which makes the re-lock have time to cross ~40 FSR and arrives at the position where correction signal can be close to zero. In the first un-lock, cavity is locked to the same FSR, but different FSR is locked during the second un-lock, which makes the detuning go back to zero. This is because the same frequency change is required for GR and IR when we go to other resonances.
Instead of sending correction signal below 0.1Hz to end mirror, we can send it to main laser temperature. This makes the acquire of resonance easier and faster. The stability of lock is also more stable in this case, comparing to send all signal to main laser. In addition, we know the filter cavity length should change less than few tens of micro-meters per day. But the main laser frequency is expected to have drift more than 100MHz per day (from PLL observation). Even from the laser manual, the stability of laser frequency DC value is described to be changed by less than 1MHz per minute with a constant room temperature. So it seems to be reasonable to take filter cavity length as a reference below 0.1Hz.
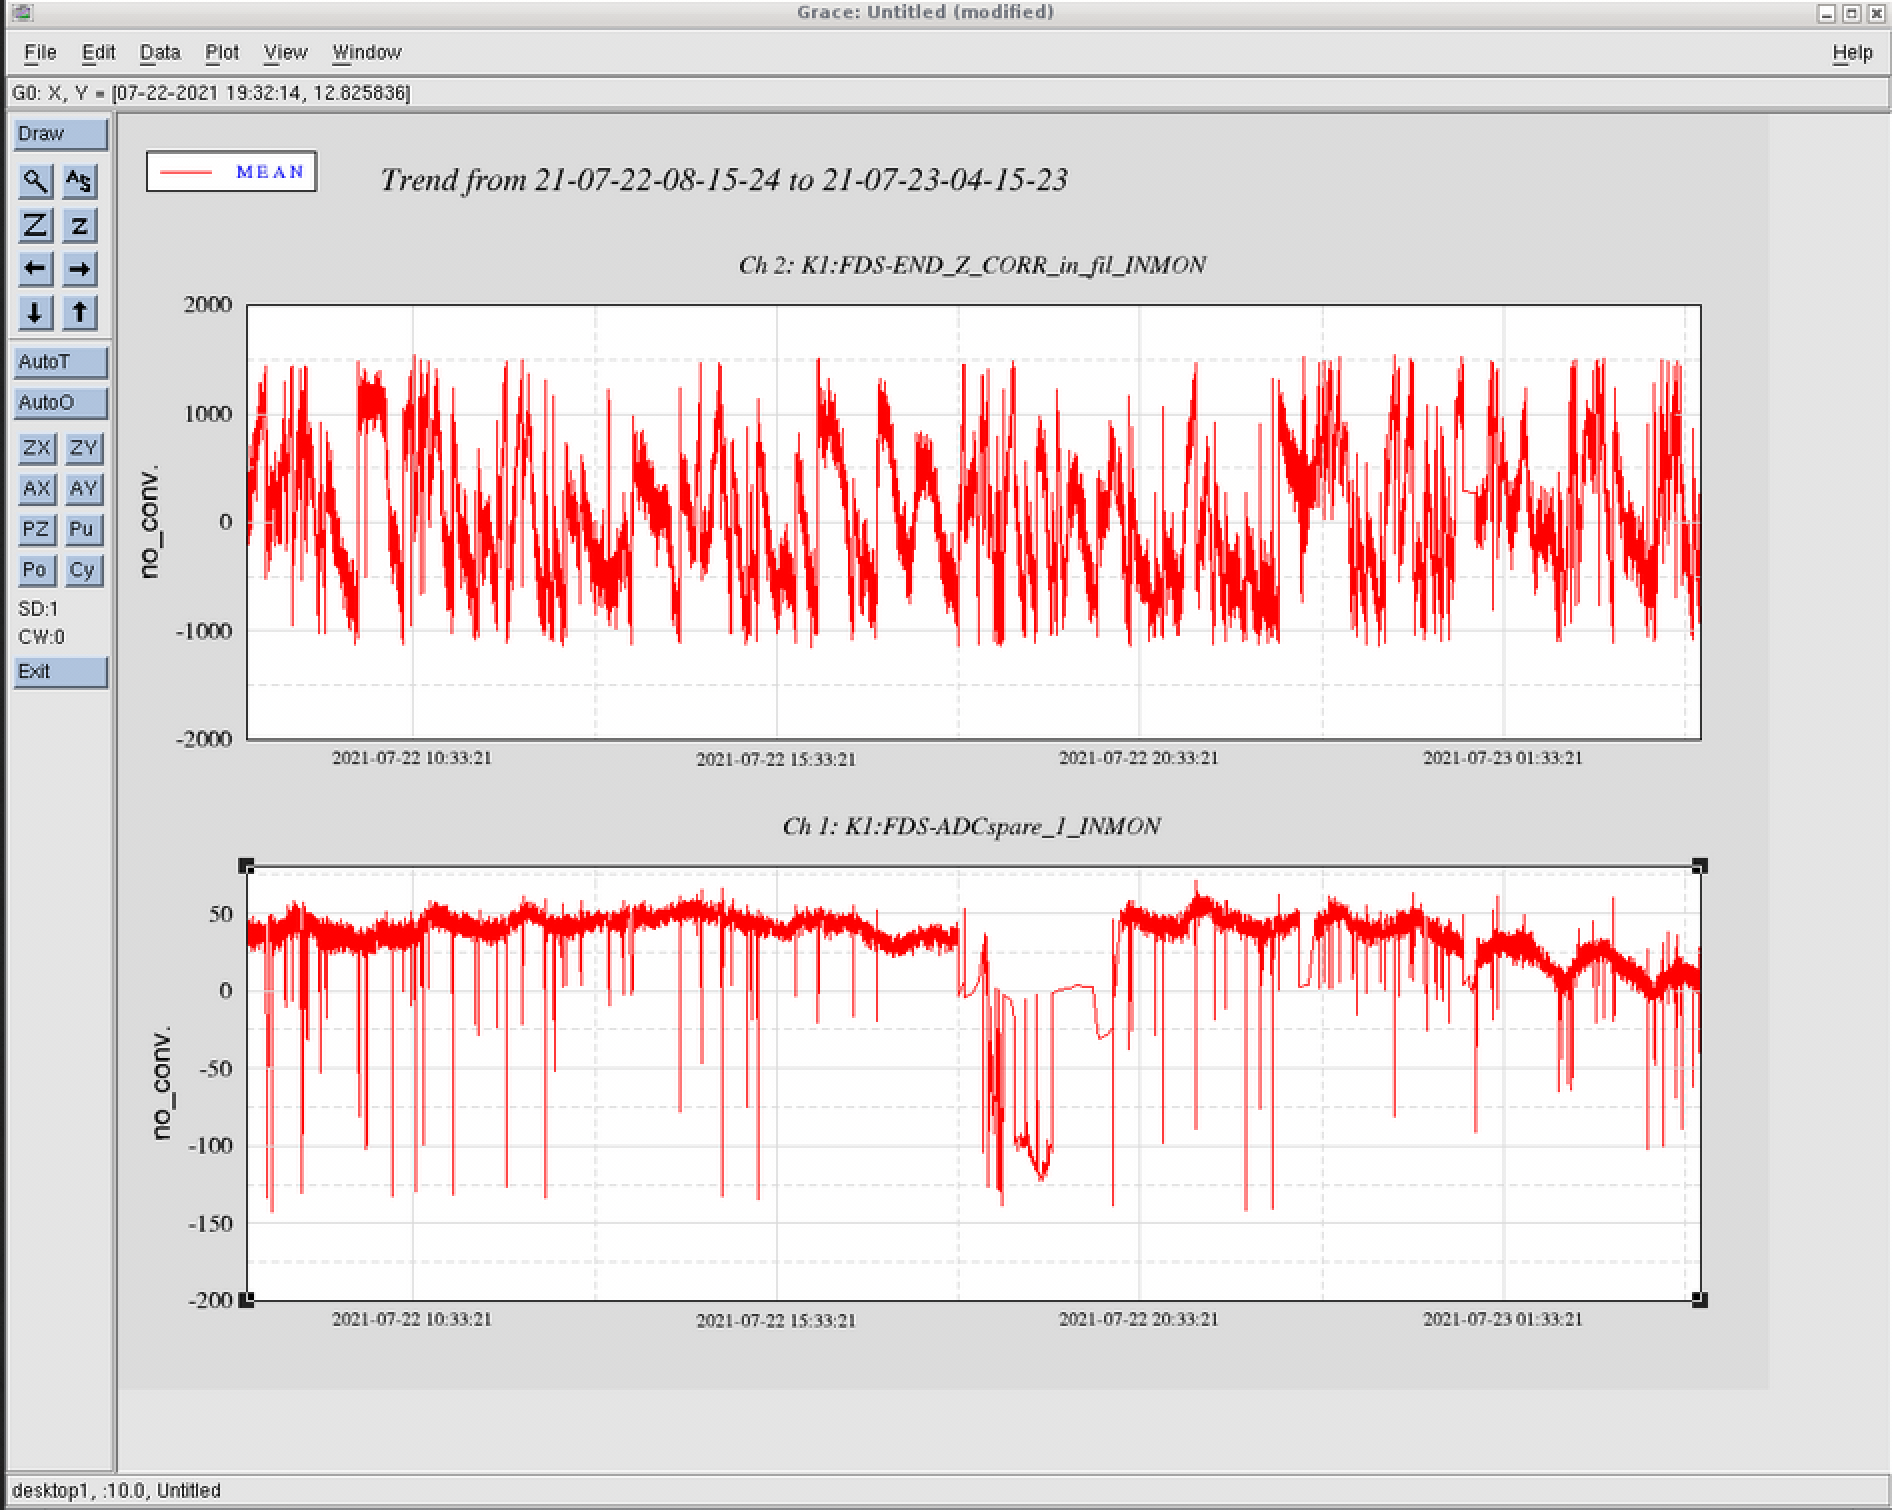
With this locking strategy, I monitored filter cavity detuning stability by about 20hours on 23rd July. A screen shot of this monitor is attached in this elog without calibration. Upper: correction signal to main laser temperature. Lower: detuning. In the first 15 hours, the detuning stability is about 5Hz. But similar to elog2636, there is detuning change happend in the last five hours, which seems to come from some other detuning change mechanisms. One example is that the AOM which is currently used will have frequency drift of 220Hz after one year.
Notice: AA and pointing loops are always closed.
[Aritomi, Yuhang]
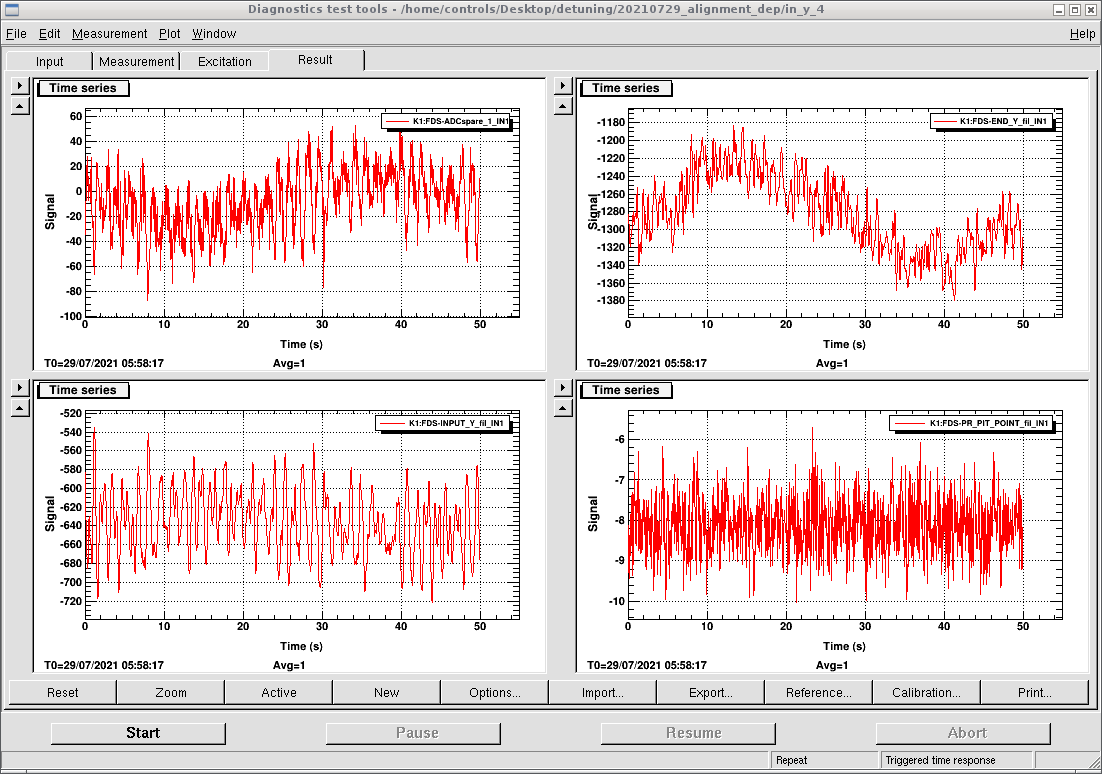
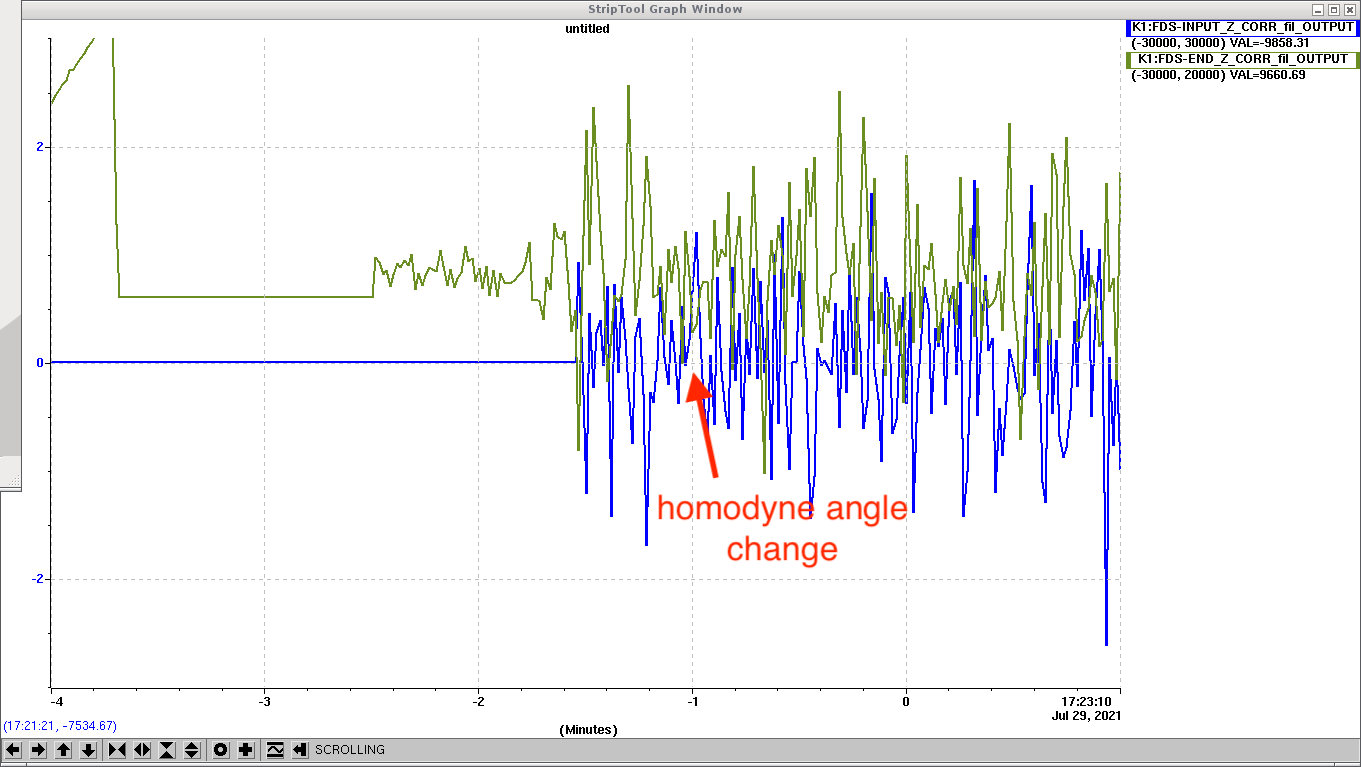
We checked the FC length correction to end mirror and CC2 correction to input mirror when the homodyne angle was changed from anti-squeezing to squeezing (attached figure). The blue and green curves show the CC2 input mirror correction and FC end mirror correction, respectively. The homodyne angle changed from anti-squeezing to squeezing at around -1 min (actually, we don't know the exact timing, but it is between -1.5 min and 1 min).
As shown in the figure, there was no change in input and end mirror correction signal when the homodyne angle changed. This means the FC length is not changed by the homodyne angle change. So the detuning drift in FDS will not be due to the homodyne angle change.
I checked the amplitude of CC2 error signal and the squeezing level with different homodyne angle. During the measurement, CCFC was closed. The CCFC amplitude was 126mVpp with p pol PLL frequency of 195MHz. Note that the positive (negative) squeezing level means squeezing (anti-squeezing).
| CC2 demod phase (deg) | CC2 amplitude (mVpp) | squeezing level (dB) |
| 110 | 84.8 | -1.8 |
| 100 | 89.6 | 2.4 |
| 93 | 100 | 0 |
| 84 | 115 | -2.4 |
| 60 | 162 | -5.3 |
| 20 | 198 | -6.8 |
| 350 | 178 | -7.2 |
The CC2 amplitude changes by factor of 2 from squeezing to anti-squeezing.
From the ratio of CC2 max/min amplitude, the nonlinear gain can be obtained. According to Aritomi's PhD thesis P.55, CC2 max/min = (1+x)/(1-x) = 198/84.8. From this equation, x = 0.4 and the nonlinear gain is g = 1/(1-x)^2 = 2.8. However, this is not consistent with the measured nonlinear gain of 4.5.
Another concern is that the minimum(maximum) CC2 amplitude does not correspond to squeezing(anti-squeezing) quadrature.
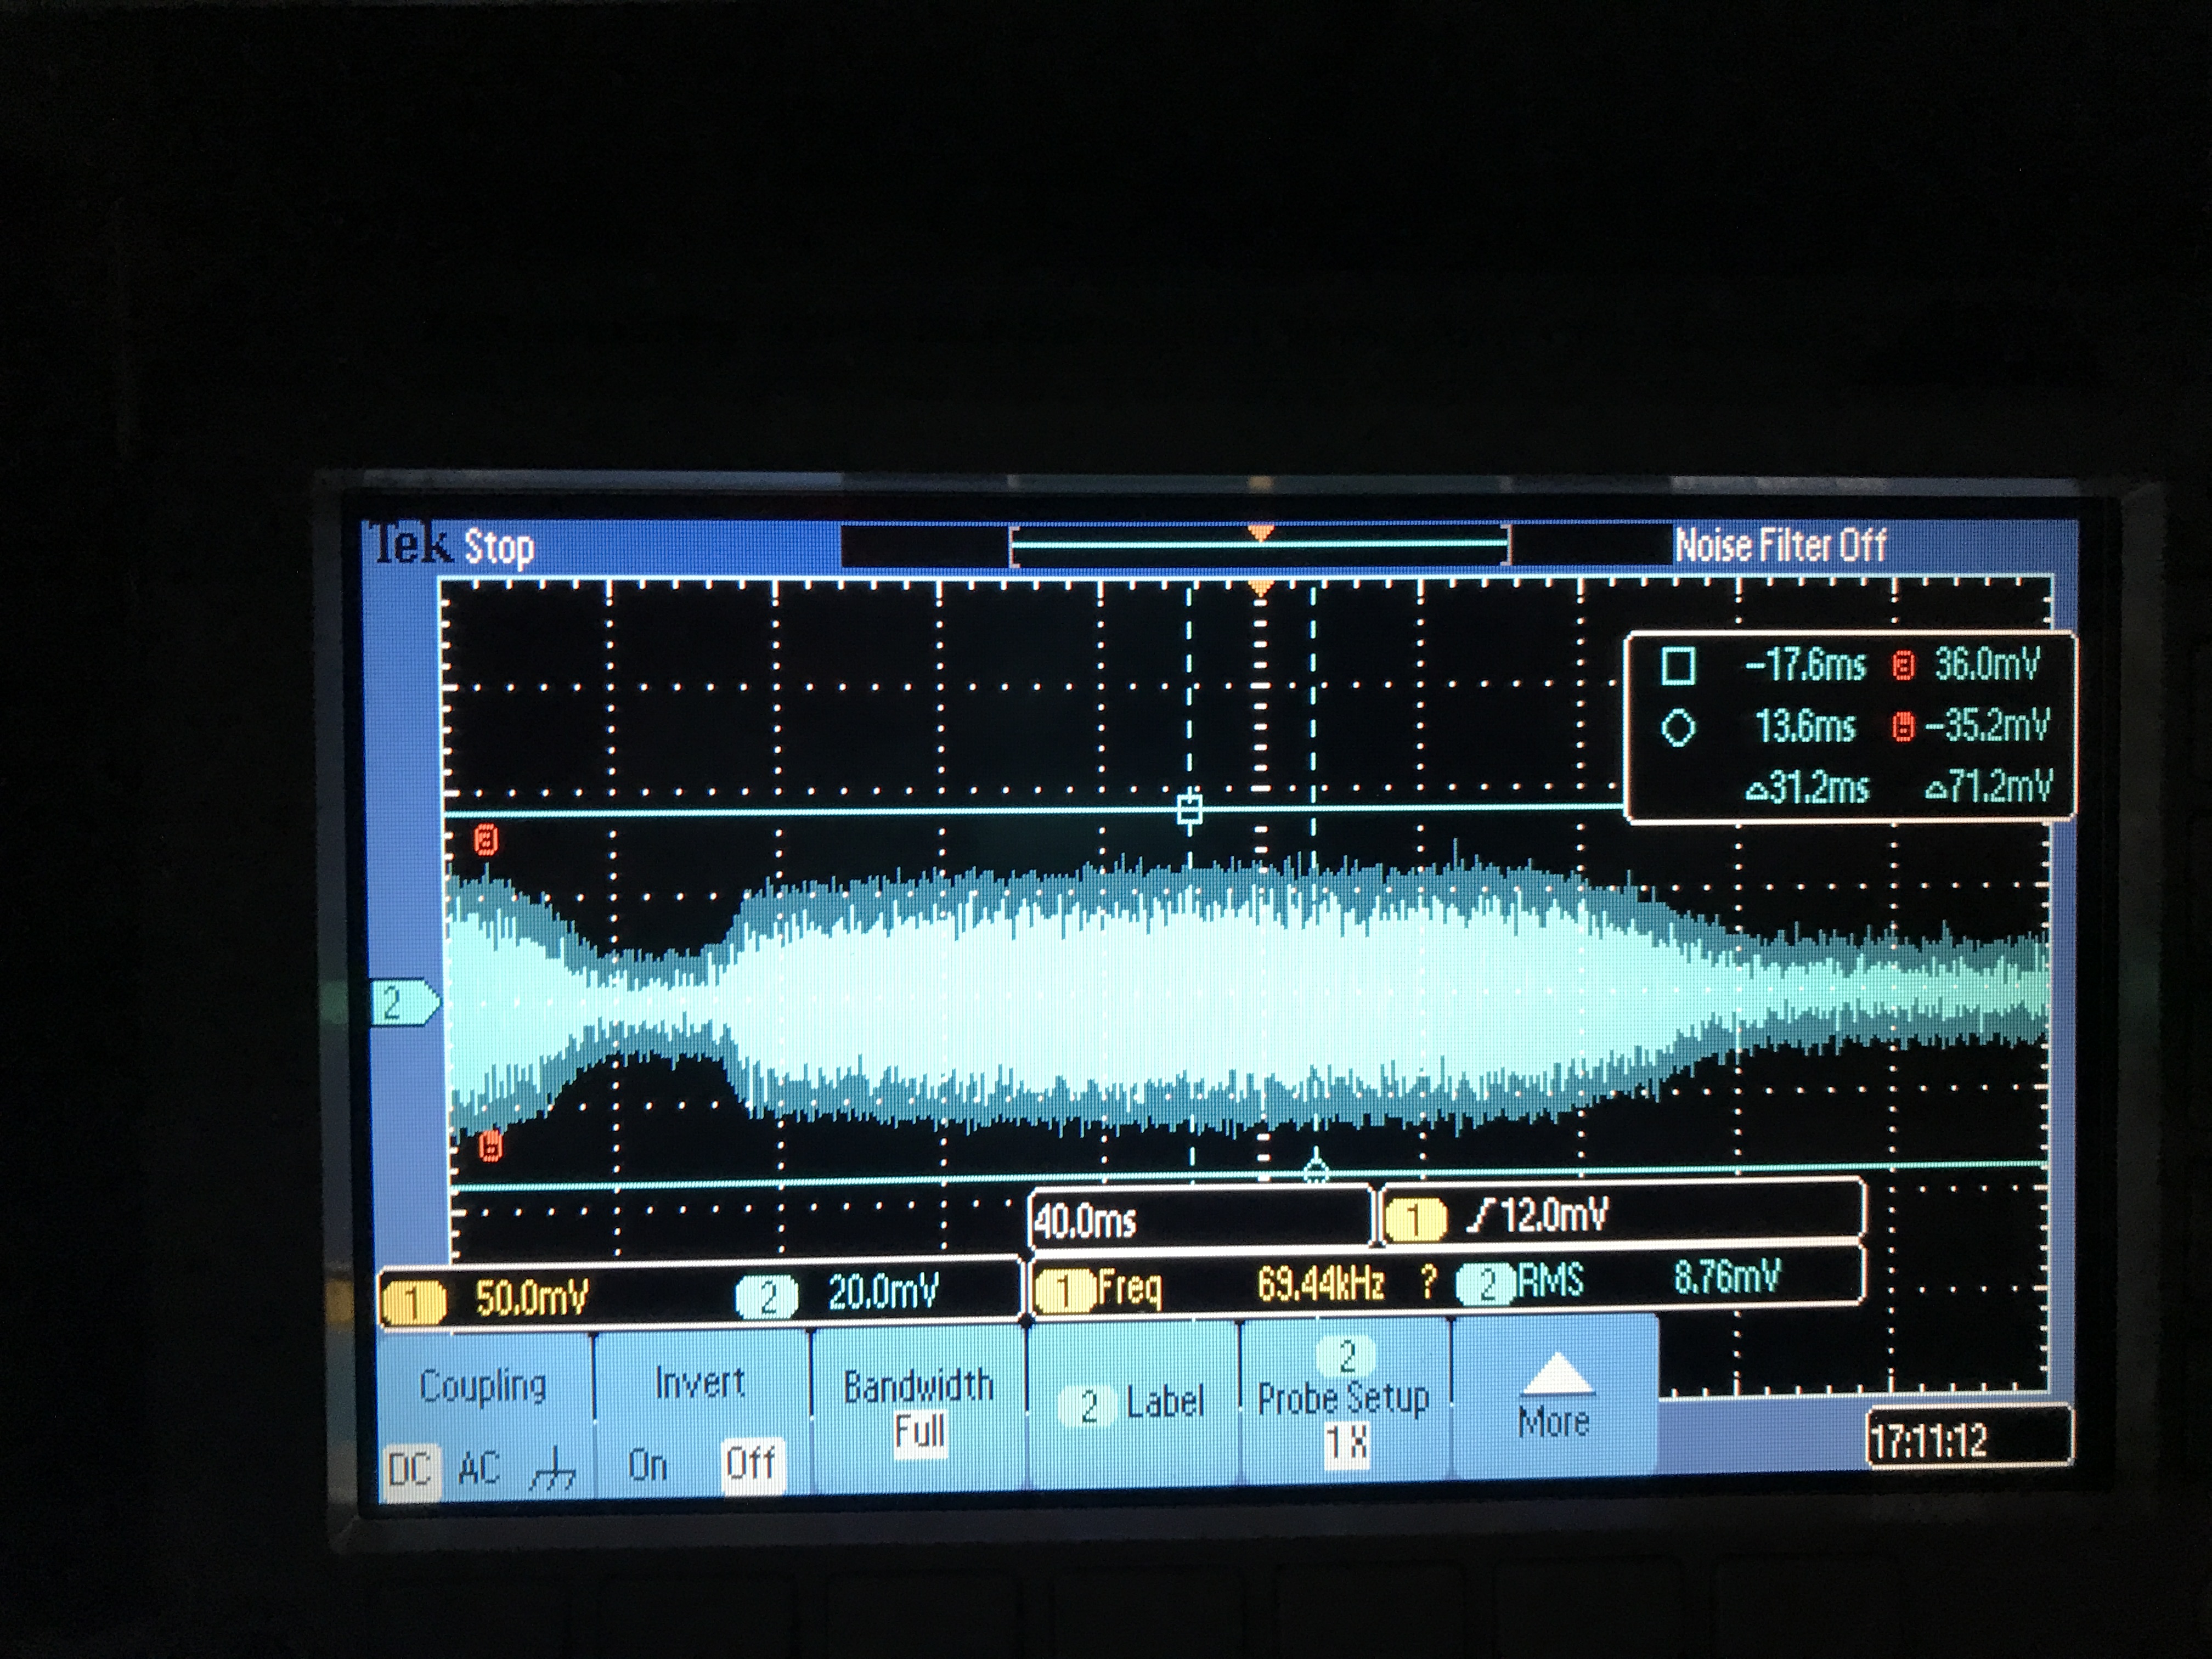
The attached figures show the CC2 error signal when CC2 is locked. There is an oscillation around 300kHz. This oscillation is present even when CCSB are off resonance, so this is not related to CCFC.

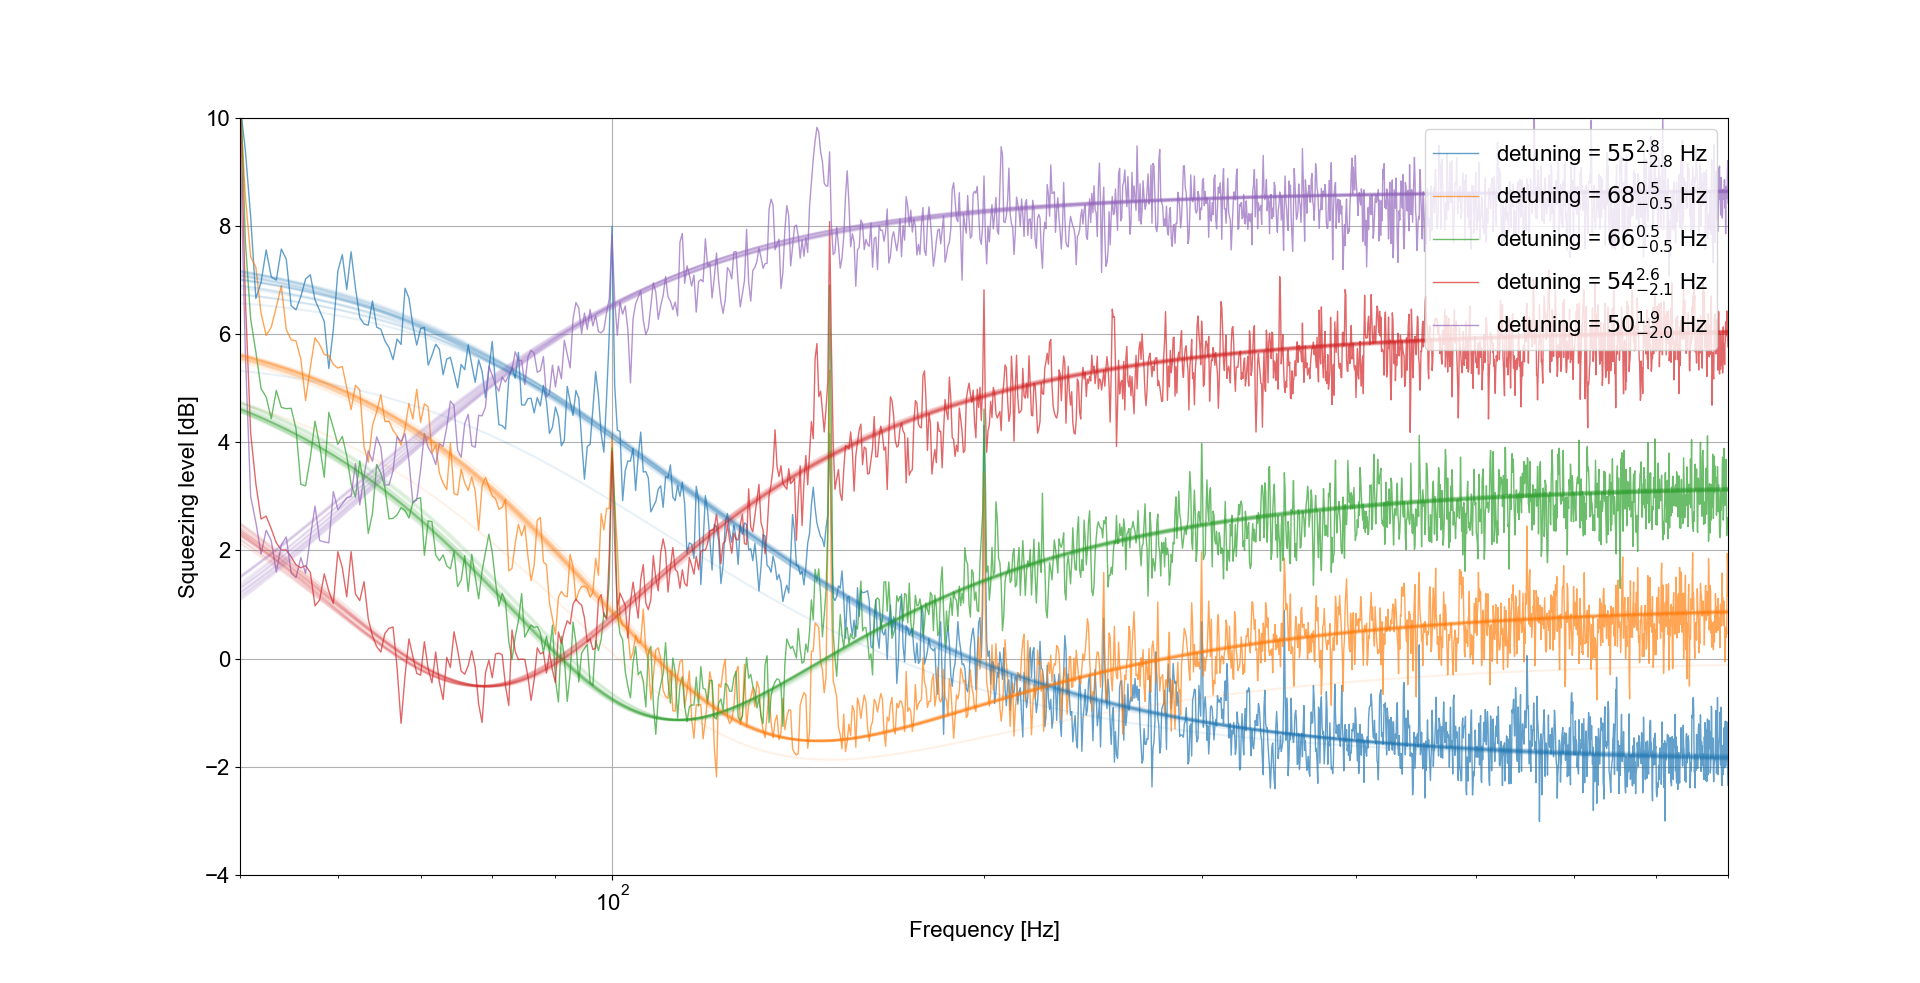
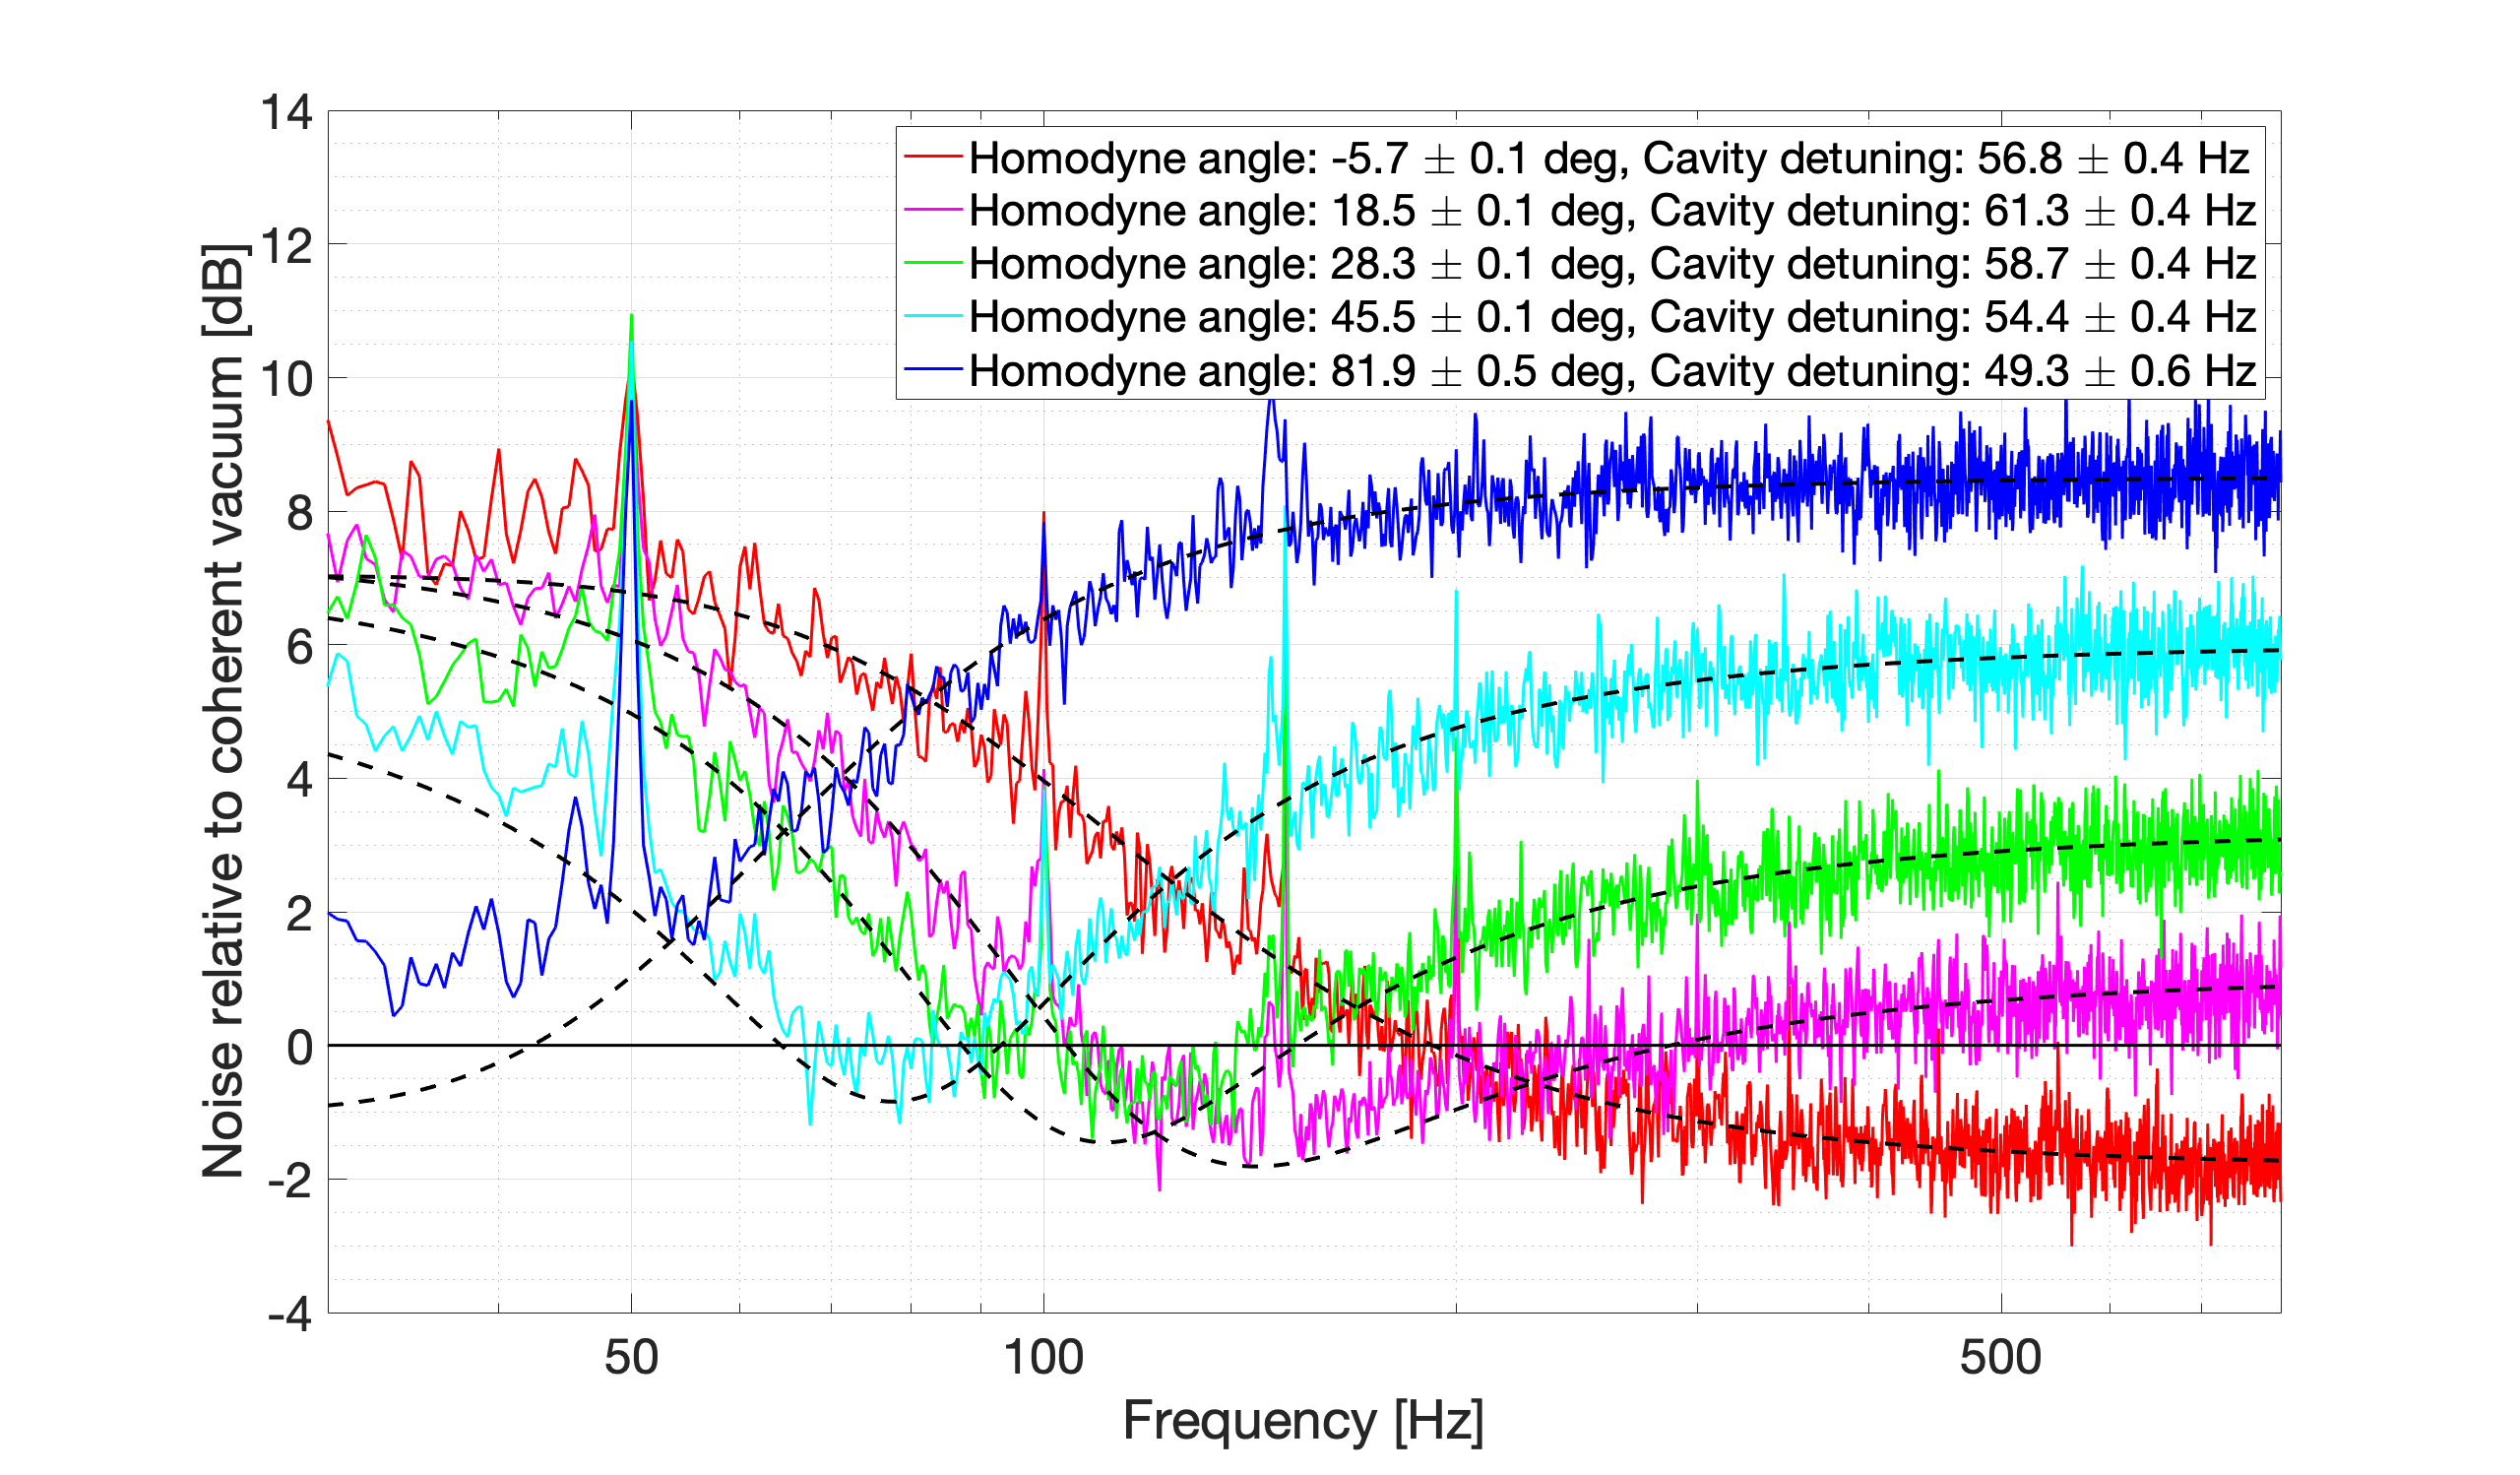
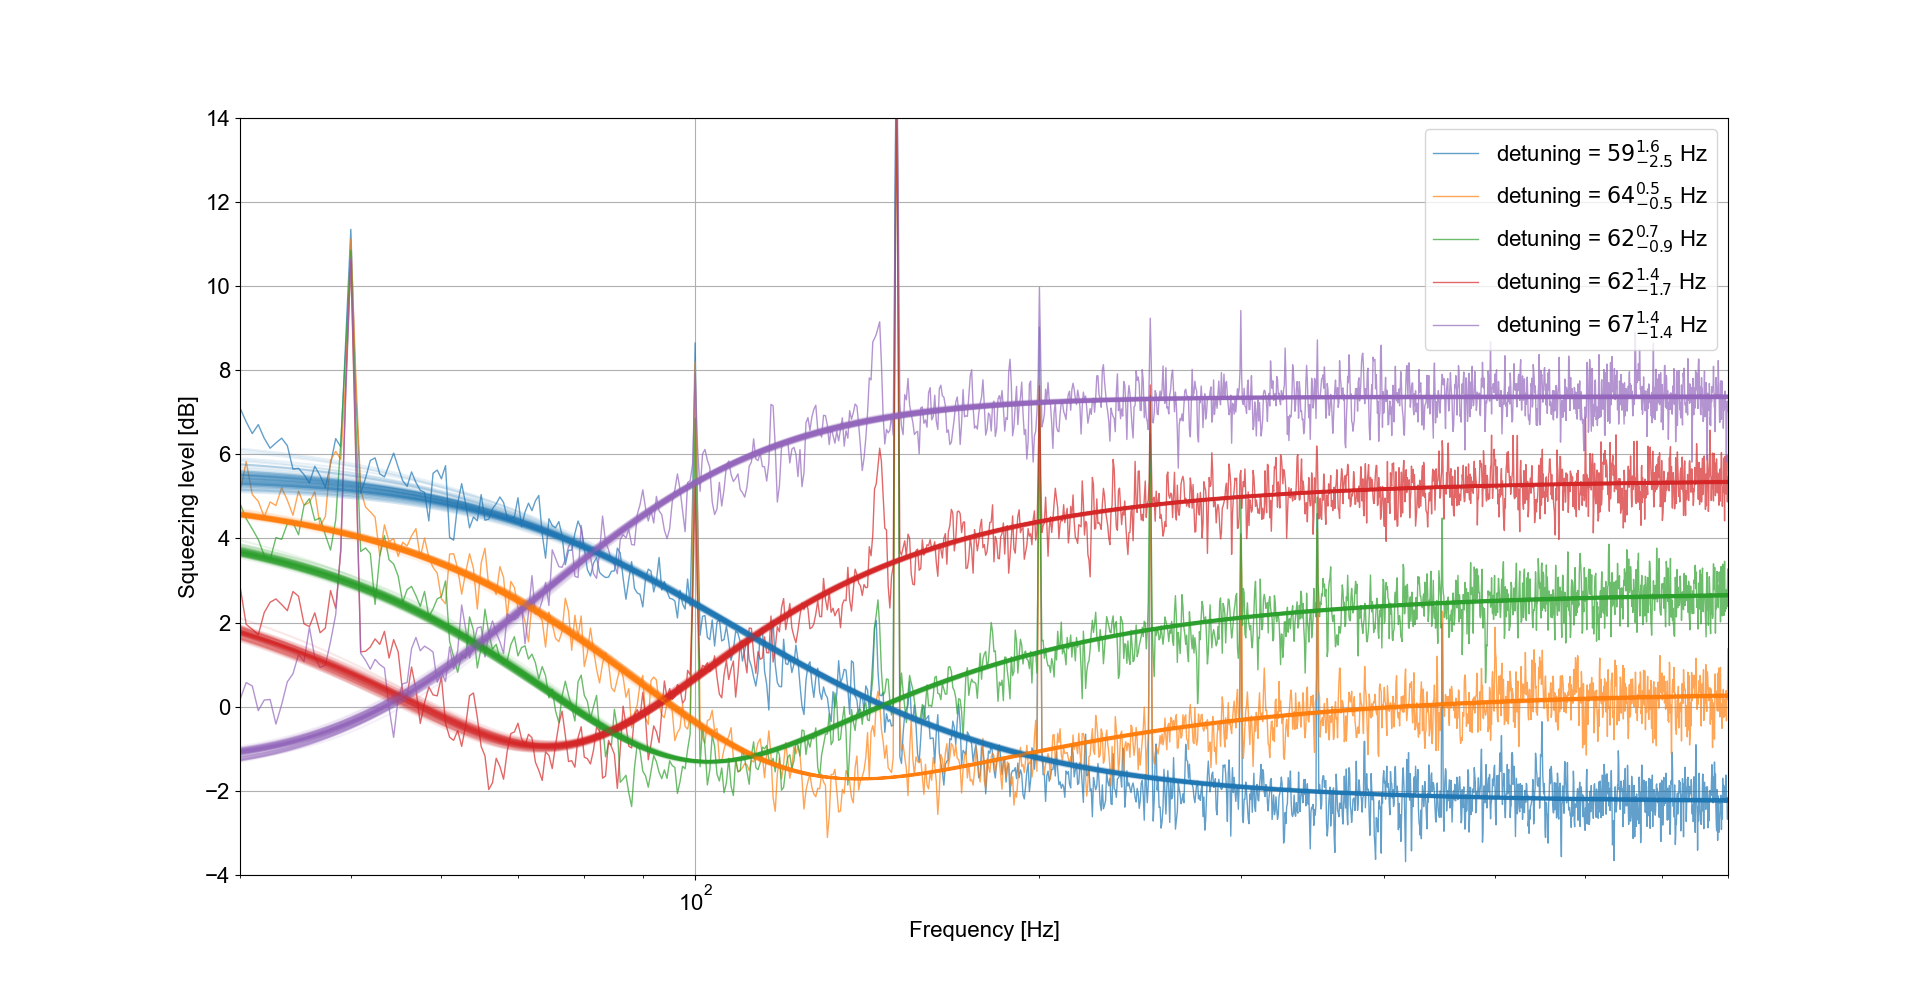
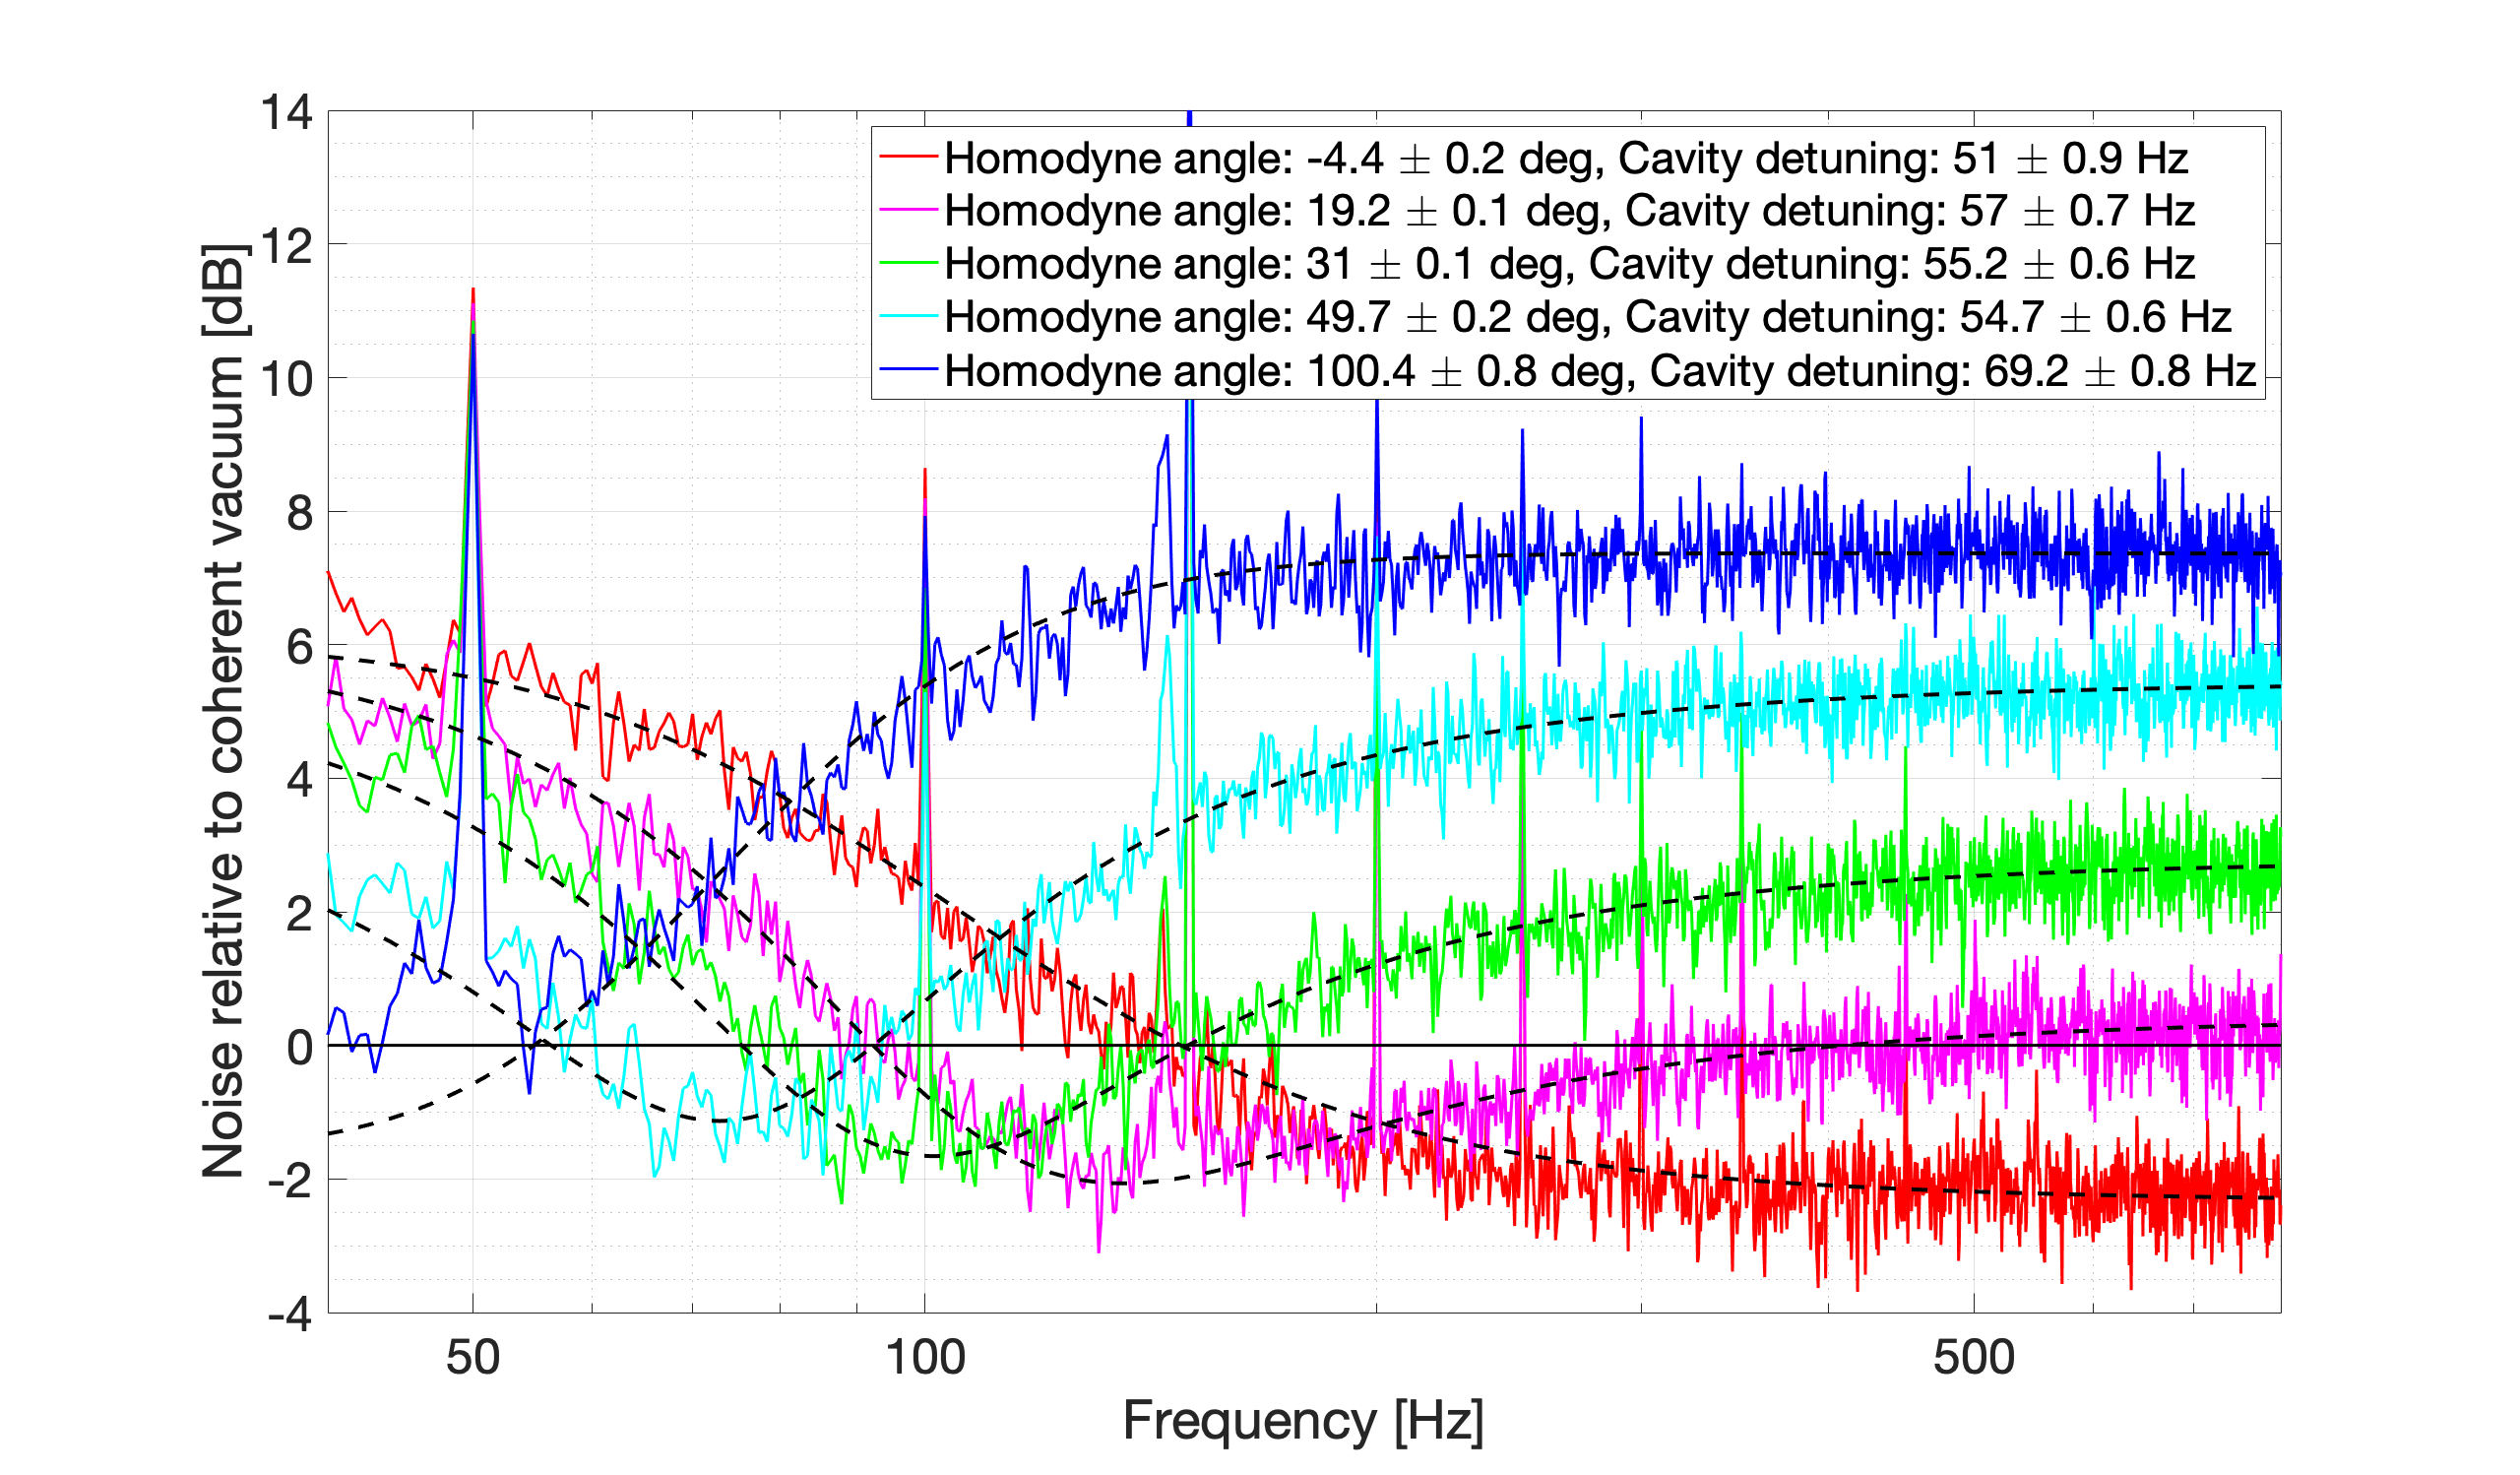
Yuhang and Michael fitted this data with mcmc. The detuning fluctuation with mcmc is 8 Hz. The fit has been started from 60 Hz.
Left: mcmc (detuning: 59-67 Hz)
Right: least square (detuning: 51-69 Hz)
The following table shows the result of mcmc. The generated squeezing with mcmc is 9.0-10.2 dB, which correponds to the nonlinear gain of 3.6-4.5. This fluctuation seems too large.
| detuning (Hz) | homodyne angle (deg) | generated squeezing (dB) | loss (%) |
| 58.7 +1.6/-2.5 | -2.7 +0.5/-0.5 | 9.6 +0.3/-0.2 | 51.9 +0.8/-0.8 |
| 63.8 +0.5/-0.5 | 21.5 +0.1/-0.1 | 9.0 +0.05/-0.02 | 53.9 +0.1/-0.1 |
| 62.4 +0.7/-0.9 | 36.3 +0.3/-0.7 | 9.1 +0.1/-0.1 | 53.8 +0.2/-0.3 |
| 62.4 +1.4/-1.7 | 58.0 +1.3/-1.6 | 9.1 +0.2/-0.1 | 48.8 +1.6/-1.9 |
| 67.5 +1.4/-1.4 | 98.5 +1.5/-1.5 | 10.2 +0.2/-0.3 | 50.5 +2.5/-3.8 |
OPO automatic lock doesn't work again...
A new mixer was tested (elog2626) to be more stable than the old one (elog2616). Actually, from elog 2616, the error is only about 1 count.
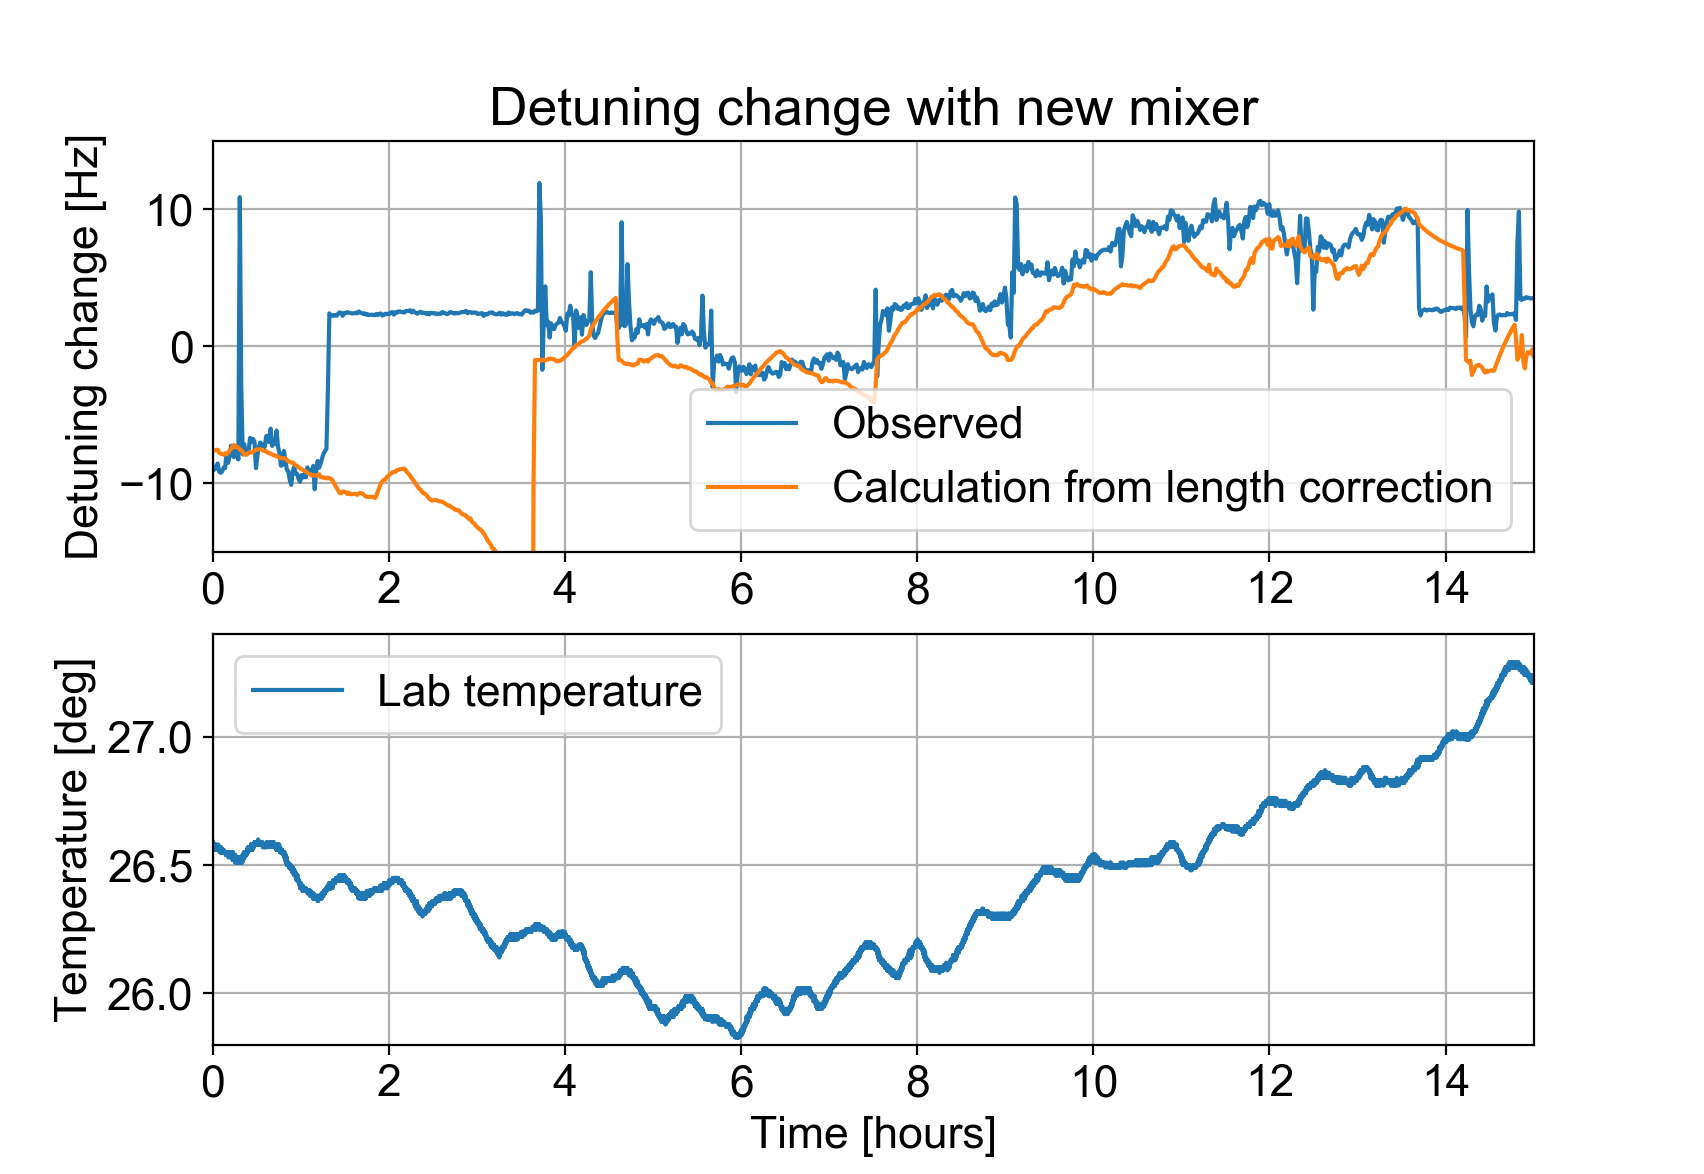
Anyway, the detuning was monitored with the new mixer. The result is attached here. The detuning change follows the correction change as well.
Especially, the correlation of detuning change and temperature change is shown in the attached figure. From this figure, it looks that they are quite correlated.
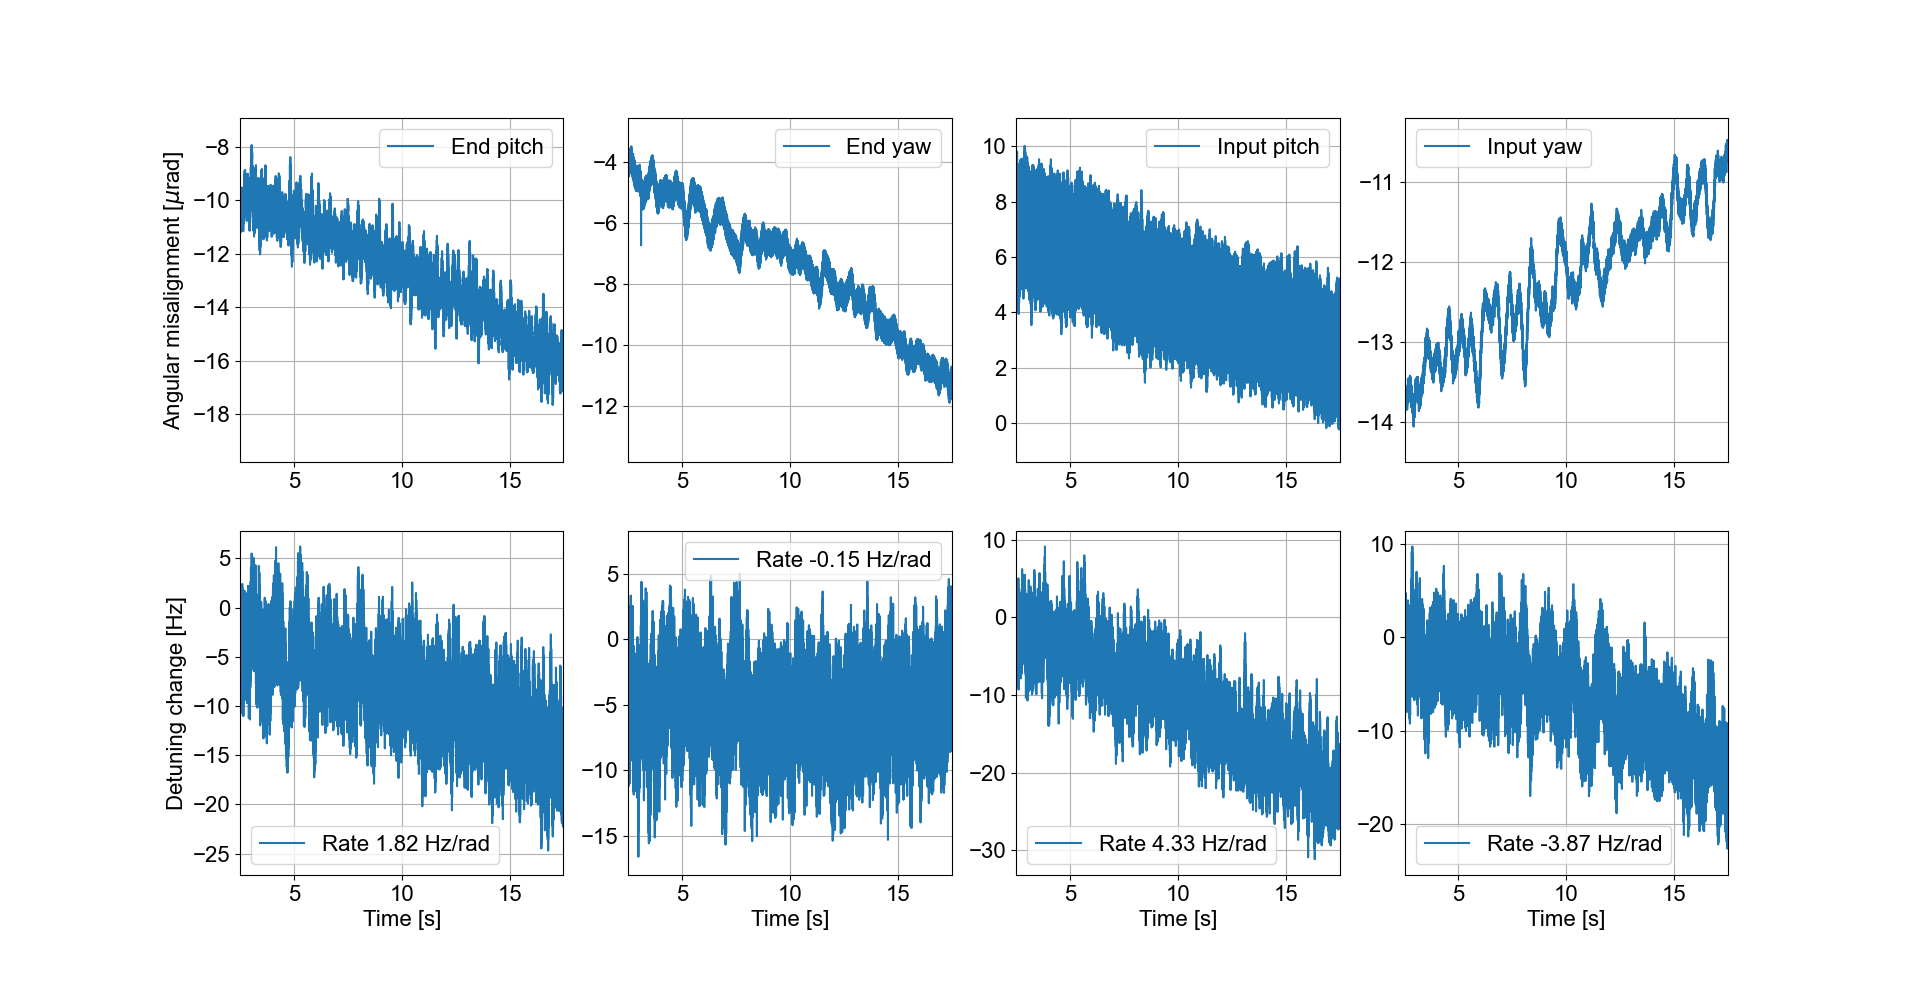
When cavity mirror alignment changes, the optical axis of cavity will change. This makes intra-cavity beam hits on different points on cavity mirrors. For example, when a pitch pertubation 'x' is introduced to cavity end mirror, according to cavity geometry, the intra-cavity beam will change beam hitting position on end mirror by 'x*(R-L)/2' while change beam hitting position on input mirror by 'x*(R+L)/2'. In our case, R~440m and L~300m.
When FC is locked with GR both in length and alignment, we can introduce the pertubation for input\end pitch\yaw. The detuning change is taken simulatenously. However, it is noticed that only small amount of misalignment can be introduced (about 5urad), otherwise, cavity get unlock. This introduced misalignment corresponds to a beam position change on the other cavity mirror by about 2mm.
The misalignment and detuning change is attached. We can see that the input mirror misalignment introduce more detuning change. This can be reasonable since the end mirror has more layers of coatings, which is more probably to have difference for phase error between GR and IR.
The detuning measurement had some problems. The main issue is that pointing loop was not kept to be zero while these scanning.
When pointing loop is kept to be zero, either we introduce pertubation to input or end mirror yaw/pitch, the beam hitting position can change only on input mirror. Therefore, when we do this scan, we are doing a map similar to elog2615. But instead of end mirror in elog 2615, this scan is for input mirror. Attached figure 1 shows the schematic of this scanning process.
Since the PR/BS pointing loop has angular scanning range of about 200urad, which can scan a range only about 0.8mm on input mirror. After doing these scan on input/end mirrors y/p, we got detuning change, input/end mirror oplev signal, and pointing error signal as attached figure 2-5.
With position change of about 0.8mm on input mirror, the detuning change is less than 5Hz. (This is a detuning change smaller than the flat region found on filter cavity end mirror in elog2615.)
Michael and Yuhang
It was found that the detuning change is highly related with the correction signal sent to main laser when filter cavity is controlled with GR (elog2636).
To confirm this effect, we sent a sinusoidal signal to main laser temperature which can change main laser frequency up to few GHZ. After that, we collected the data of filter cavity end mirror z_corr, fc__ir_tra, and fc_ir_detuning.
Using the same method as elog2636 but the calibration factor from correction signal to length is from elog2606 because the control loop gain needs to be considered. Then we get cavity correction signal and detuning change as attached figures. This proves again the detuning change caused by the presence of AOM.

| green power (mW) | 0 | 20 |
| p pol PLL frequency (MHz) | 240 | 180 |
| OPO temperature (kOhm) | 7.163 | 7.163 |
| BAB maximum (mV) | 55.6 | 250 |
| nonlinear gain | 1 | 4.5 |
OPO automatic lock recovered by itself.
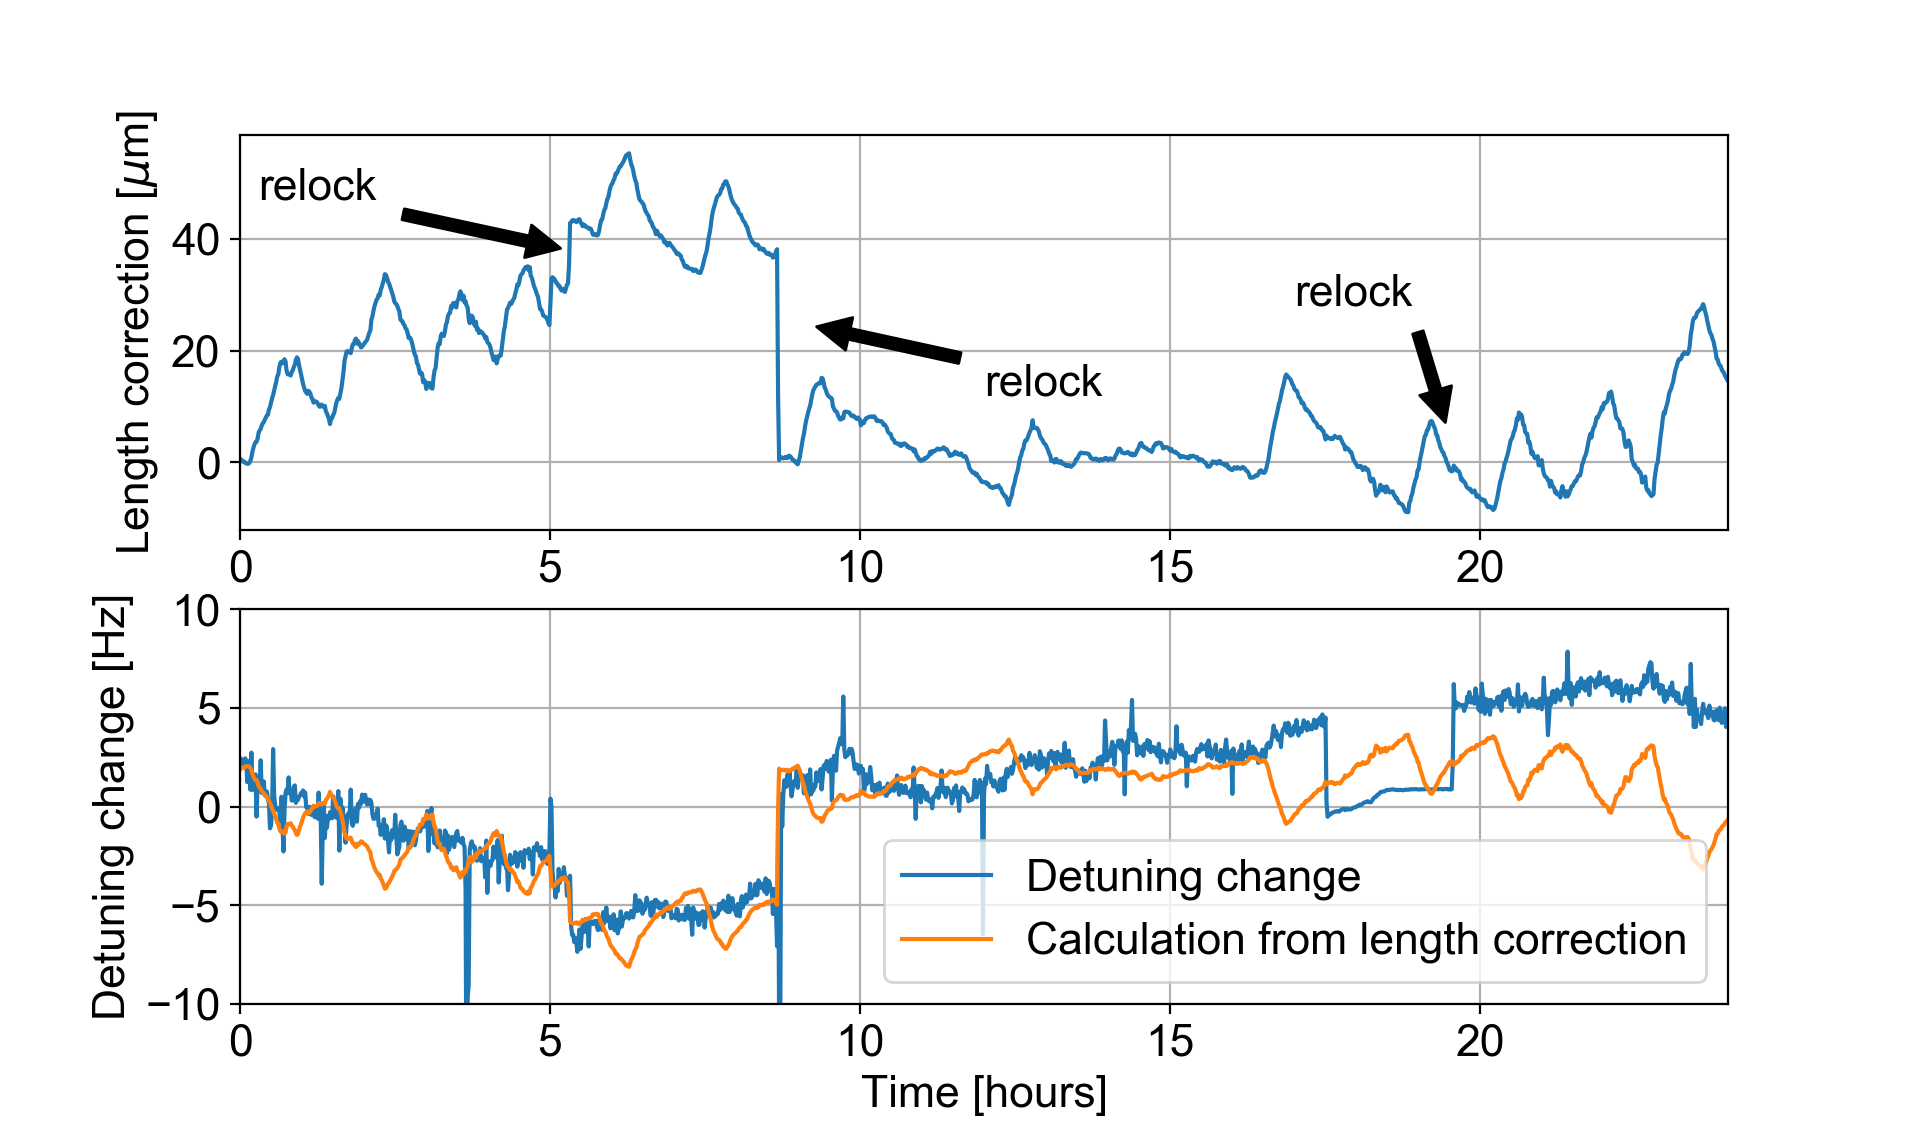
Due to the presence of AOM, the length/frequency change influence GR and IR resonance in a different way. But if GR is always kept on resonance, IR detuning should have a change of 1.83e5 * cavity length correction.
In elog2611, I took a 24 hours monitor of detuning change and correction signal change. I checked the pointing loop is always kept around the good point. I used the simple above equation and compared the calculation and observed detuning change. To calibrate the observed correction to length change, the calibration method in elog2629 is used. Discrepancy between calculation and observation was found in the attached figure, but I think it is not surprising bacause the input and end mirror may have horizontal and vertical translational motion. By hitting on different position of mirror with 100um, detuning can change by few Hz.
To see if there is frequency drift effect from RF source, I tried to use DDS. I took DDS3 CH0 for the time being.
1. I removed 12dB attenuator connected to the output of DDS3 CH0.
2. I put 8dB attenuator (2*3+2).
3. Amplify with 13.6dB.
4. Goes to the amplifier which was used for old AOM RF source.
The frequency in DDS3 was found to be 109.541930MHz to make IR TEM00 on resonance.
First I optimized the p pol PLL frequency to maximize the amplitude of CCFC error signal. The optimized p pol PLL frequency was 200 MHz for OPO temperature of 7.163 kOhm and the CCFC calibration amplitude was 134mVpp.
Then I checked the nonlinear gain. The nonlinear gain was 4.4, which corresponds to the generated squeezing of 10.1dB.
| green power (mW) | 0 | 20 |
| p pol PLL frequency (MHz) | 260 | 200 |
| OPO temperature (kOhm) | 7.163 | 7.163 |
| BAB maximum (mV) | 55.6 | 245 |
| nonlinear gain | 1 | 4.4 |
I used a red LEMO cable between DDS output and mixer for CCFC LO to have larger detuning. The figure 1 shows CCFC FDS. The 50Hz bump somehow disappeared today. The detuning fluctuation is 51-69Hz. Note that the detuning fluctuation is not bad (51-57 Hz) other than the anti-squeezing quadrature.
I found that the 50Hz and its harmonics are already very large in shot noise (figure 2). The DC balance or ground condition is not good?
Degradation parameters:
sqz_dB = 10.1; % generated squeezing (dB)
L_rt = 120e-6; % FC losses
L = 0.49; % Propagation losses
A0 = 0.06; % Squeezer/filter cavity mode mismatch
C0 = 0.02; % Squeezer/local oscillator mode mismatch
ERR_L = 1.5e-12; % Lock accuracy (m)
ERR_csi = 30e-3; % Phase noise (rad)

Yuhang and Michael fitted this data with mcmc. The detuning fluctuation with mcmc is 8 Hz. The fit has been started from 60 Hz.
Left: mcmc (detuning: 59-67 Hz)
Right: least square (detuning: 51-69 Hz)
The following table shows the result of mcmc. The generated squeezing with mcmc is 9.0-10.2 dB, which correponds to the nonlinear gain of 3.6-4.5. This fluctuation seems too large.
| detuning (Hz) | homodyne angle (deg) | generated squeezing (dB) | loss (%) |
| 58.7 +1.6/-2.5 | -2.7 +0.5/-0.5 | 9.6 +0.3/-0.2 | 51.9 +0.8/-0.8 |
| 63.8 +0.5/-0.5 | 21.5 +0.1/-0.1 | 9.0 +0.05/-0.02 | 53.9 +0.1/-0.1 |
| 62.4 +0.7/-0.9 | 36.3 +0.3/-0.7 | 9.1 +0.1/-0.1 | 53.8 +0.2/-0.3 |
| 62.4 +1.4/-1.7 | 58.0 +1.3/-1.6 | 9.1 +0.2/-0.1 | 48.8 +1.6/-1.9 |
| 67.5 +1.4/-1.4 | 98.5 +1.5/-1.5 | 10.2 +0.2/-0.3 | 50.5 +2.5/-3.8 |
I am very sorry that I sent a wrong information to Aritomi-san.
The optical losses information Aritomi-san listed is actually detuning in Hz. (If you compare this 'wrong' losses with detuning in legend of mcmc figure, you can see they are the same)
The real optical losses are attached in this comment. They change from 49% to 54%.
[Aritomi, Yuhang]
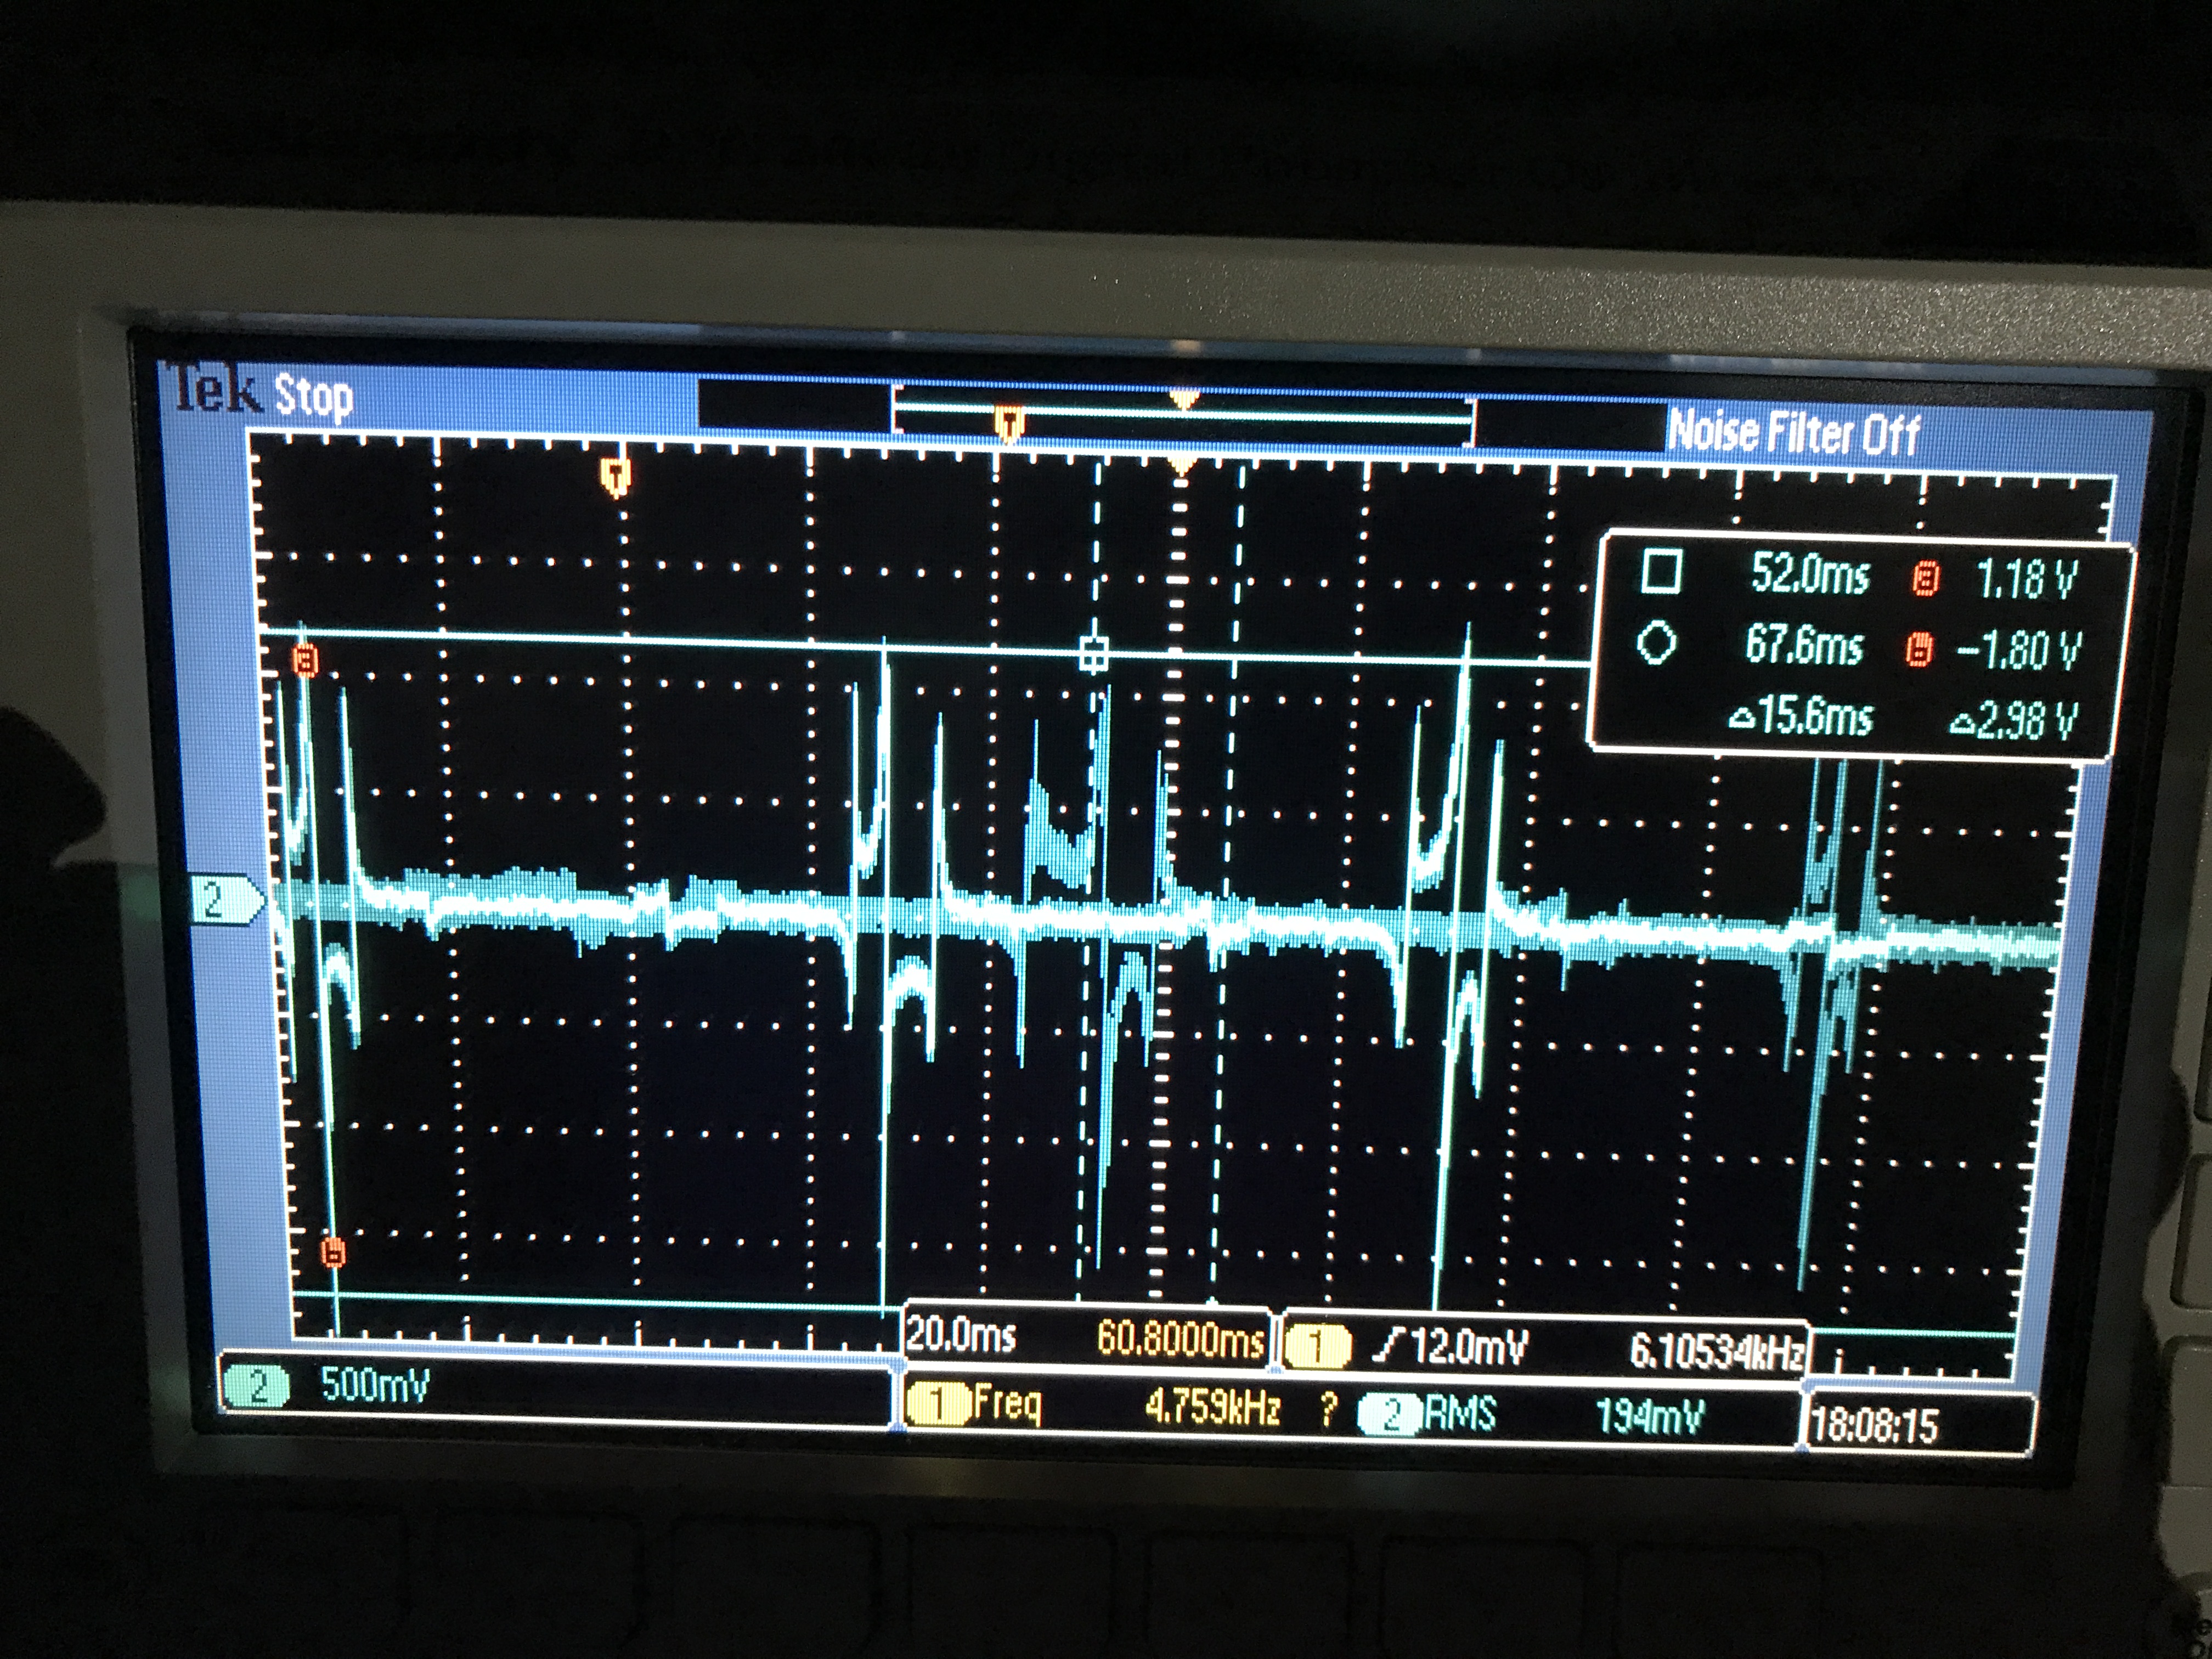
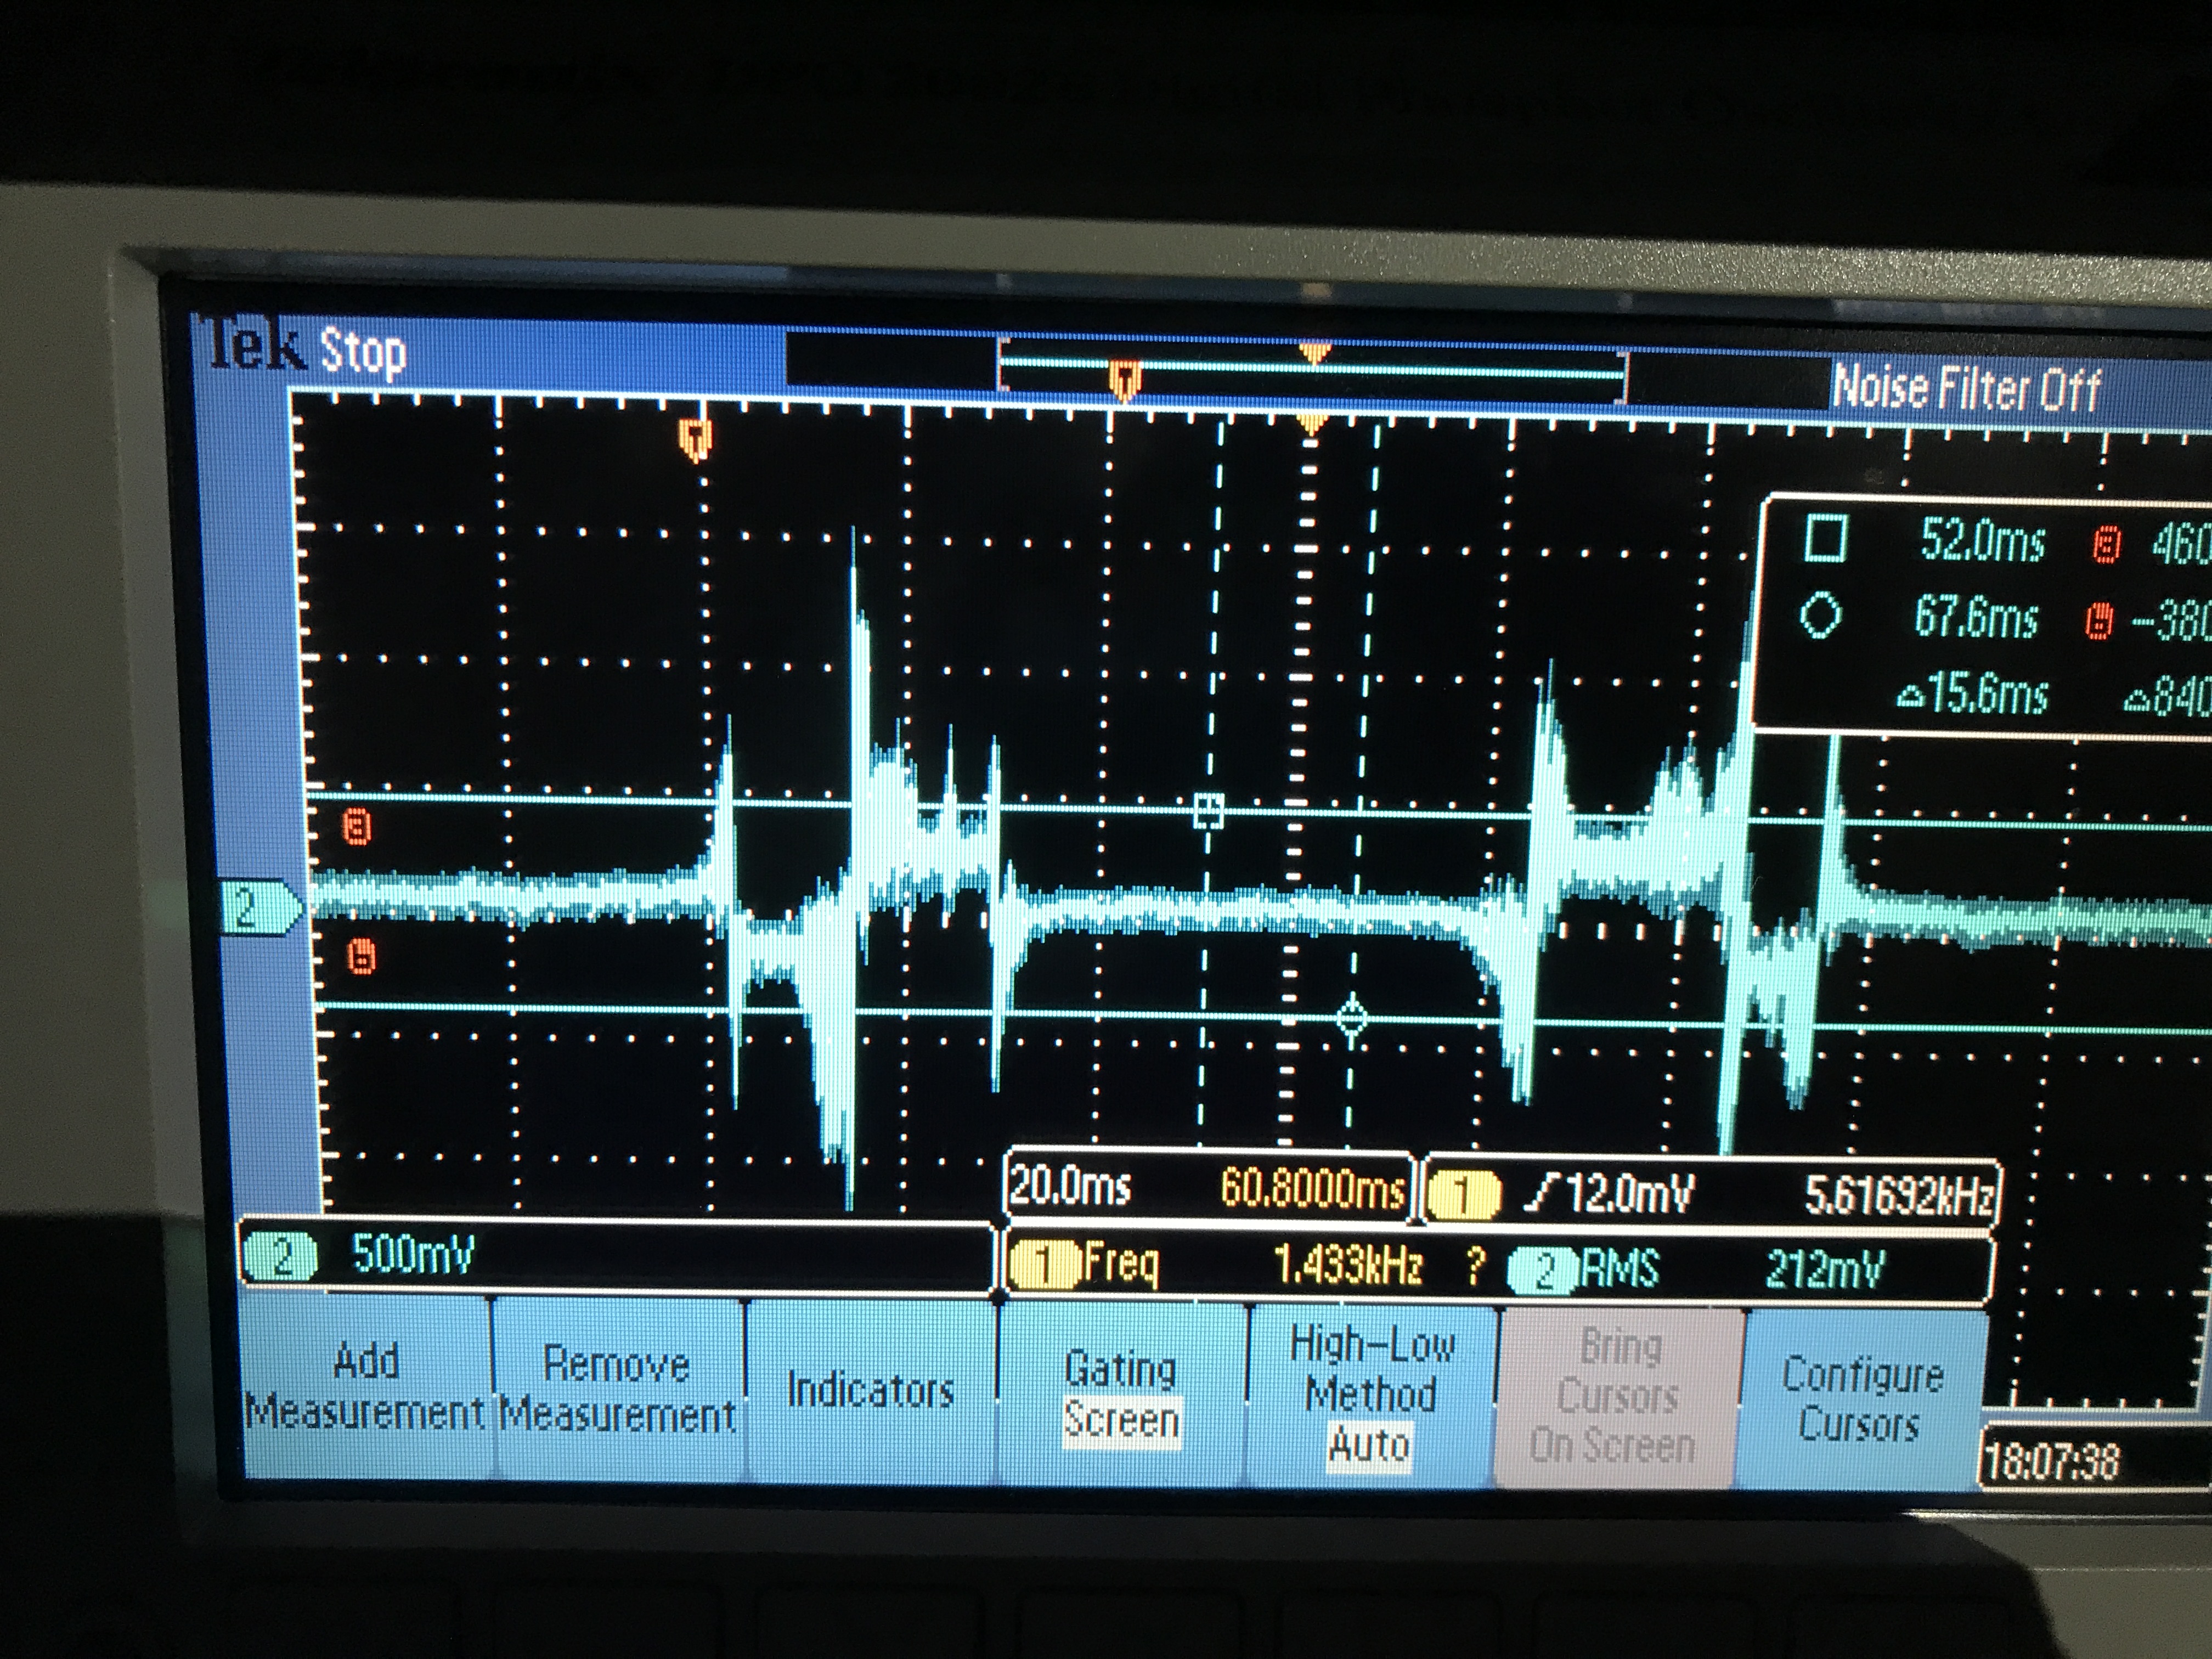
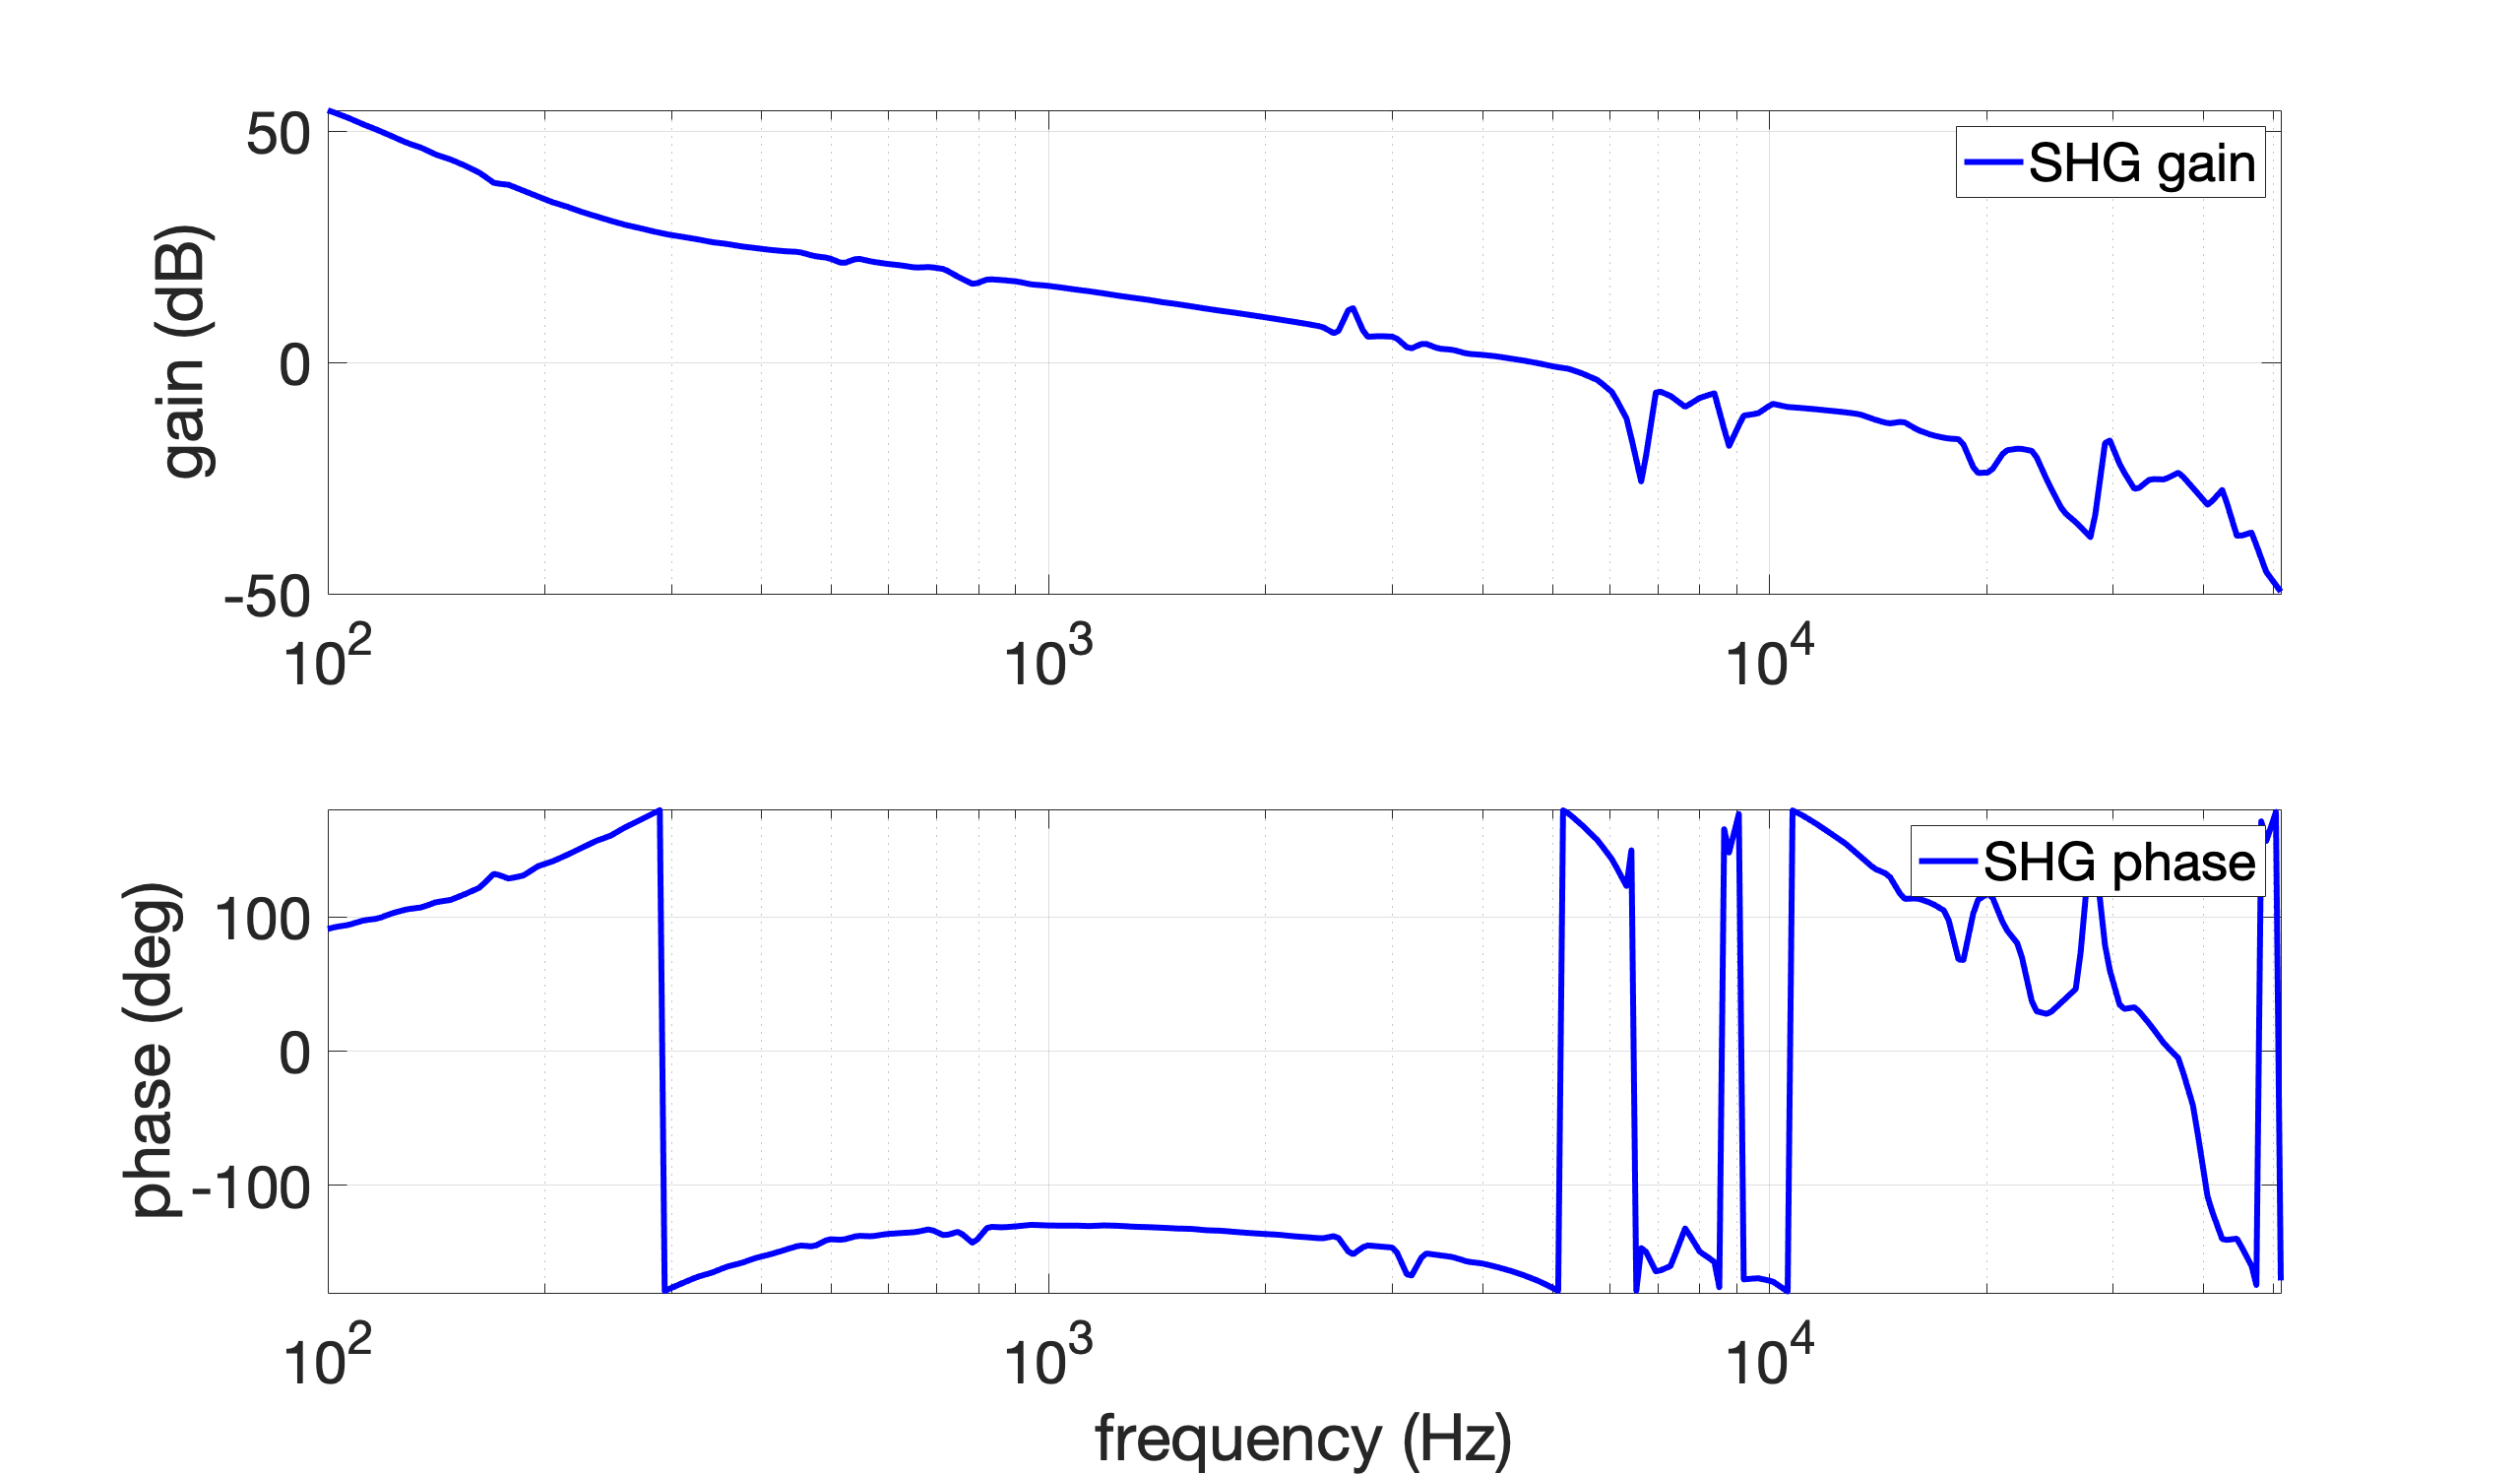
Today we found that FC green error signal was noisy due to SHG oscillation. The figure 1 and 2 show the FC error signal with SHG gain of 1.4 and 1.6. We decreased the SHG gain from 1.6 to 1.4. The SHG OLTF with gain of 1.4 is shown in figure 3. The UGF is 4.7 kHz and phase margin is 10 deg.
We also found that the FC green injection power was reduced. We changed the SHG temperature and the green injection power increased from 18.8 mW to 23.7 mW.
Yuhang and Michael fitted this data with mcmc. However, the detuning fluctuation is larger than that with least square... In this fit, the fit has been started from 60Hz and the detuning fluctuation could be smaller with higher fit starting frequency.
Left: mcmc (detuning: 50-68 Hz)
Right: least square (detuning: 49-61 Hz)