NAOJ GW Elog Logbook 3.2

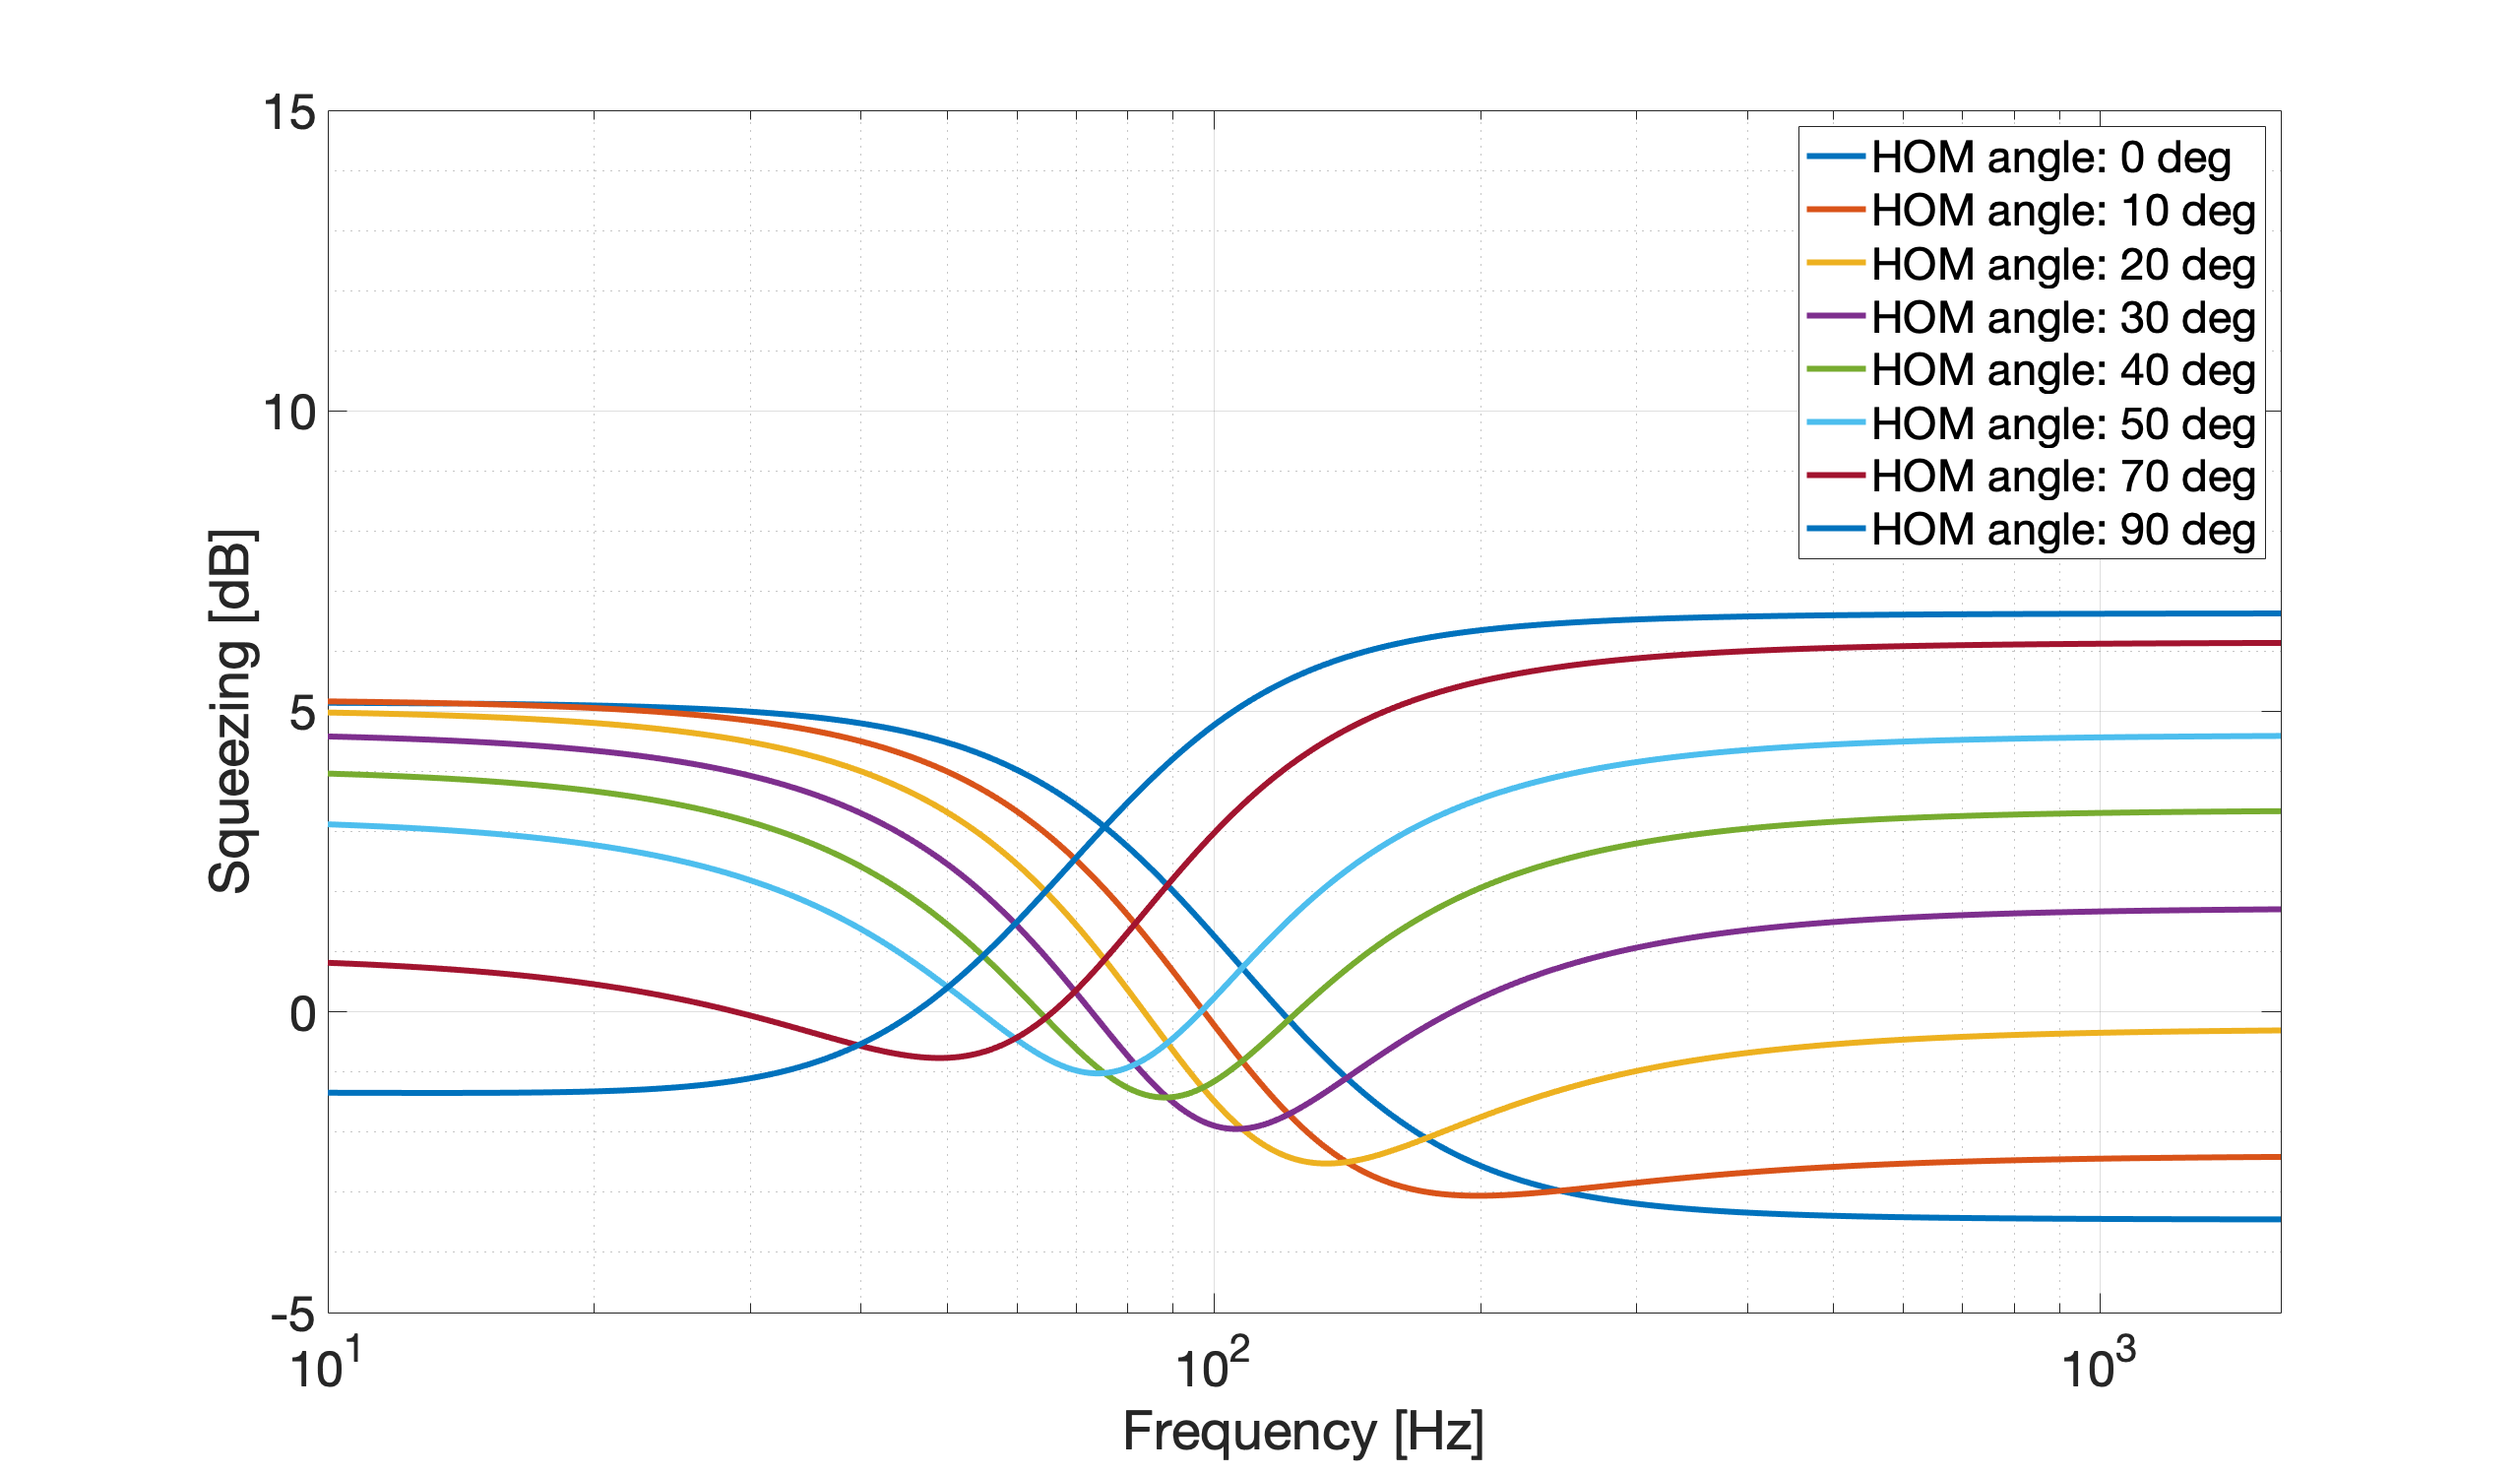
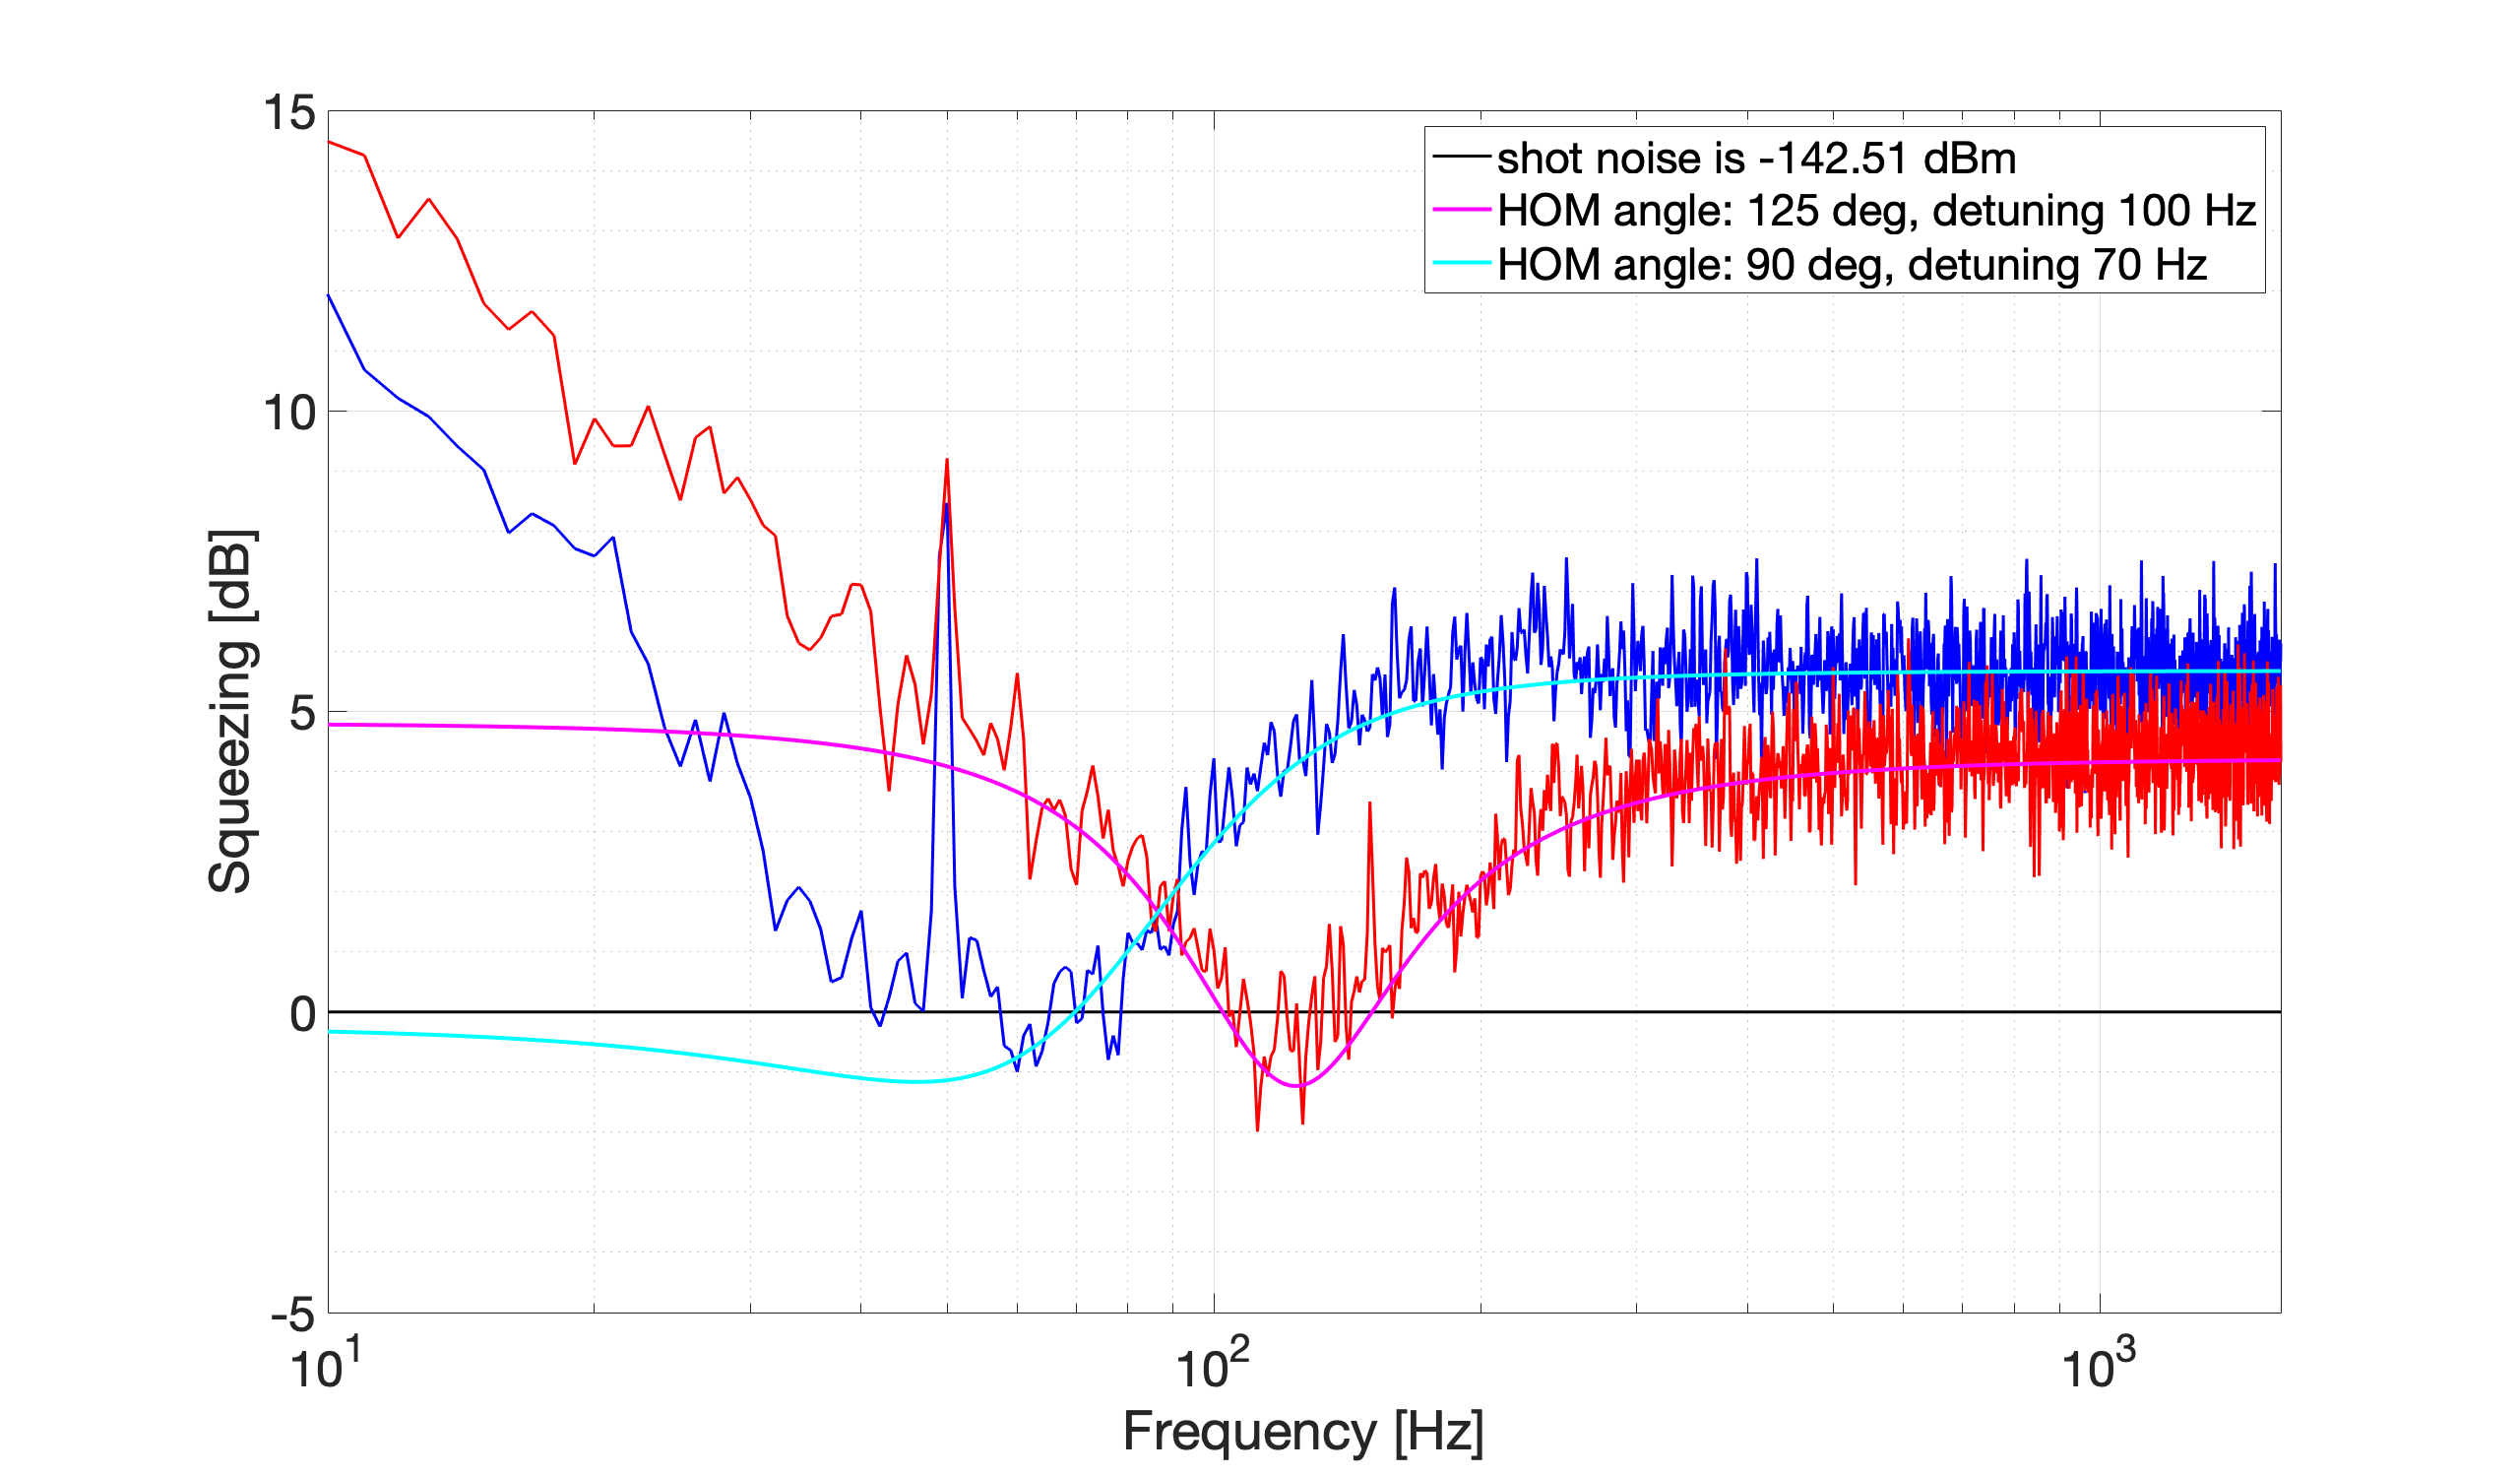
Attached figure is FDS curve with correct detuning (54Hz). With following parameters, frequency at which squeezing crosses shot noise is around 120Hz and frequency at which anti squeezing crosses shot noise is around 45Hz.
sqz_dB = 8; % produced SQZ
L_rt = 150e-6; % FC losses
L_inj = 0.20; % Injection losses
L_ro = 0.10; % Readout losses
A0 = 0.05; % Squeezed field/filter cavity mode mismatch losses
C0 = 0.05; % Squeezed field/local oscillator mode mismatch losses
ERR_L = 8.5e-12; % Lock accuracy [m]
ERR_csi = 80e-3; % Phase noise[rad]
phi_Hom = [0/180*pi, 10/180*pi, 20/180*pi, 30/180*pi, 40/180*pi, 50/180*pi, 70/180*pi ,90/180*pi]; % Homodyne angle [deg]
det = -54; % detuning frequency [Hz]
Simon, Pengbo
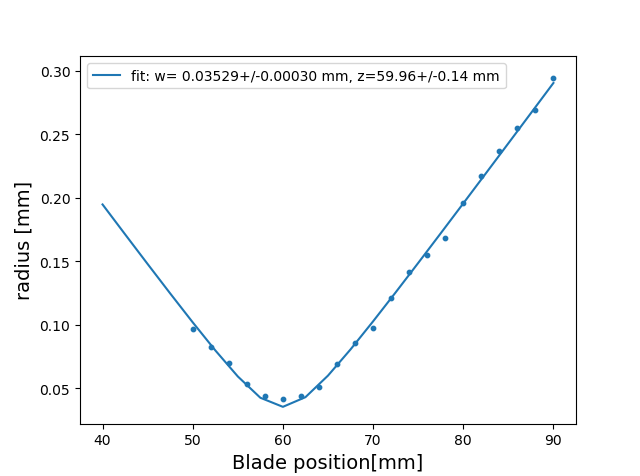
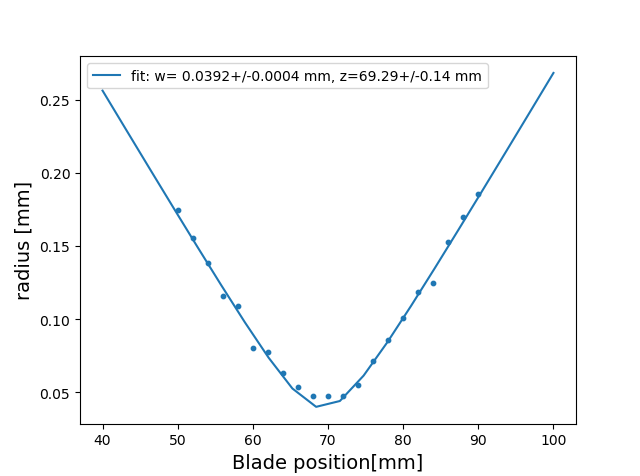
We remove the first PBS of the FI because it will block the reflective beam, so we put another PBS behind the first HWP, then remeasure the beam waist.
The result shows the waist is about 0.03529 mm at Z_position = 59.96 mm, which is good, our next step will be to recover the birefringence measurement system and test the performance of the new system.
Eleonora, Matteo and Yuhang
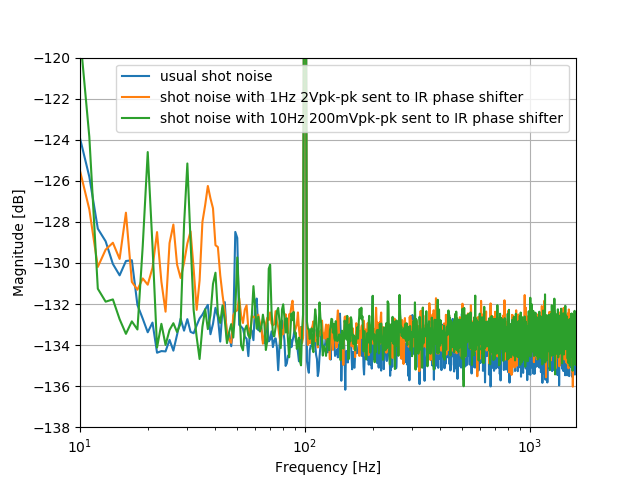
When we measure squeezing, we need to lock phase of LO with squeezing. Since the phase of squeezing is influenced a lot by suspended mirrors, the correction signal we send to IR phase shifter is quite large. We want to know how it will influence the measurement of squeezing.
On one hand, the power of IRMC transmission will be modulated. As we reported in entry 1883, we had 10% of IRMC transmission reduction when we drive IR phase shfiter with whole range. We did calculation, if we have 10% power reduction, we will have shot noise reduction of 10log10(0.9), which is 0.46 dB of reduction. This is the maximum reduction while the reduction in the real case should be half of 10log10(0.97), which corresponds to 0.066dB reduction of shot noise.
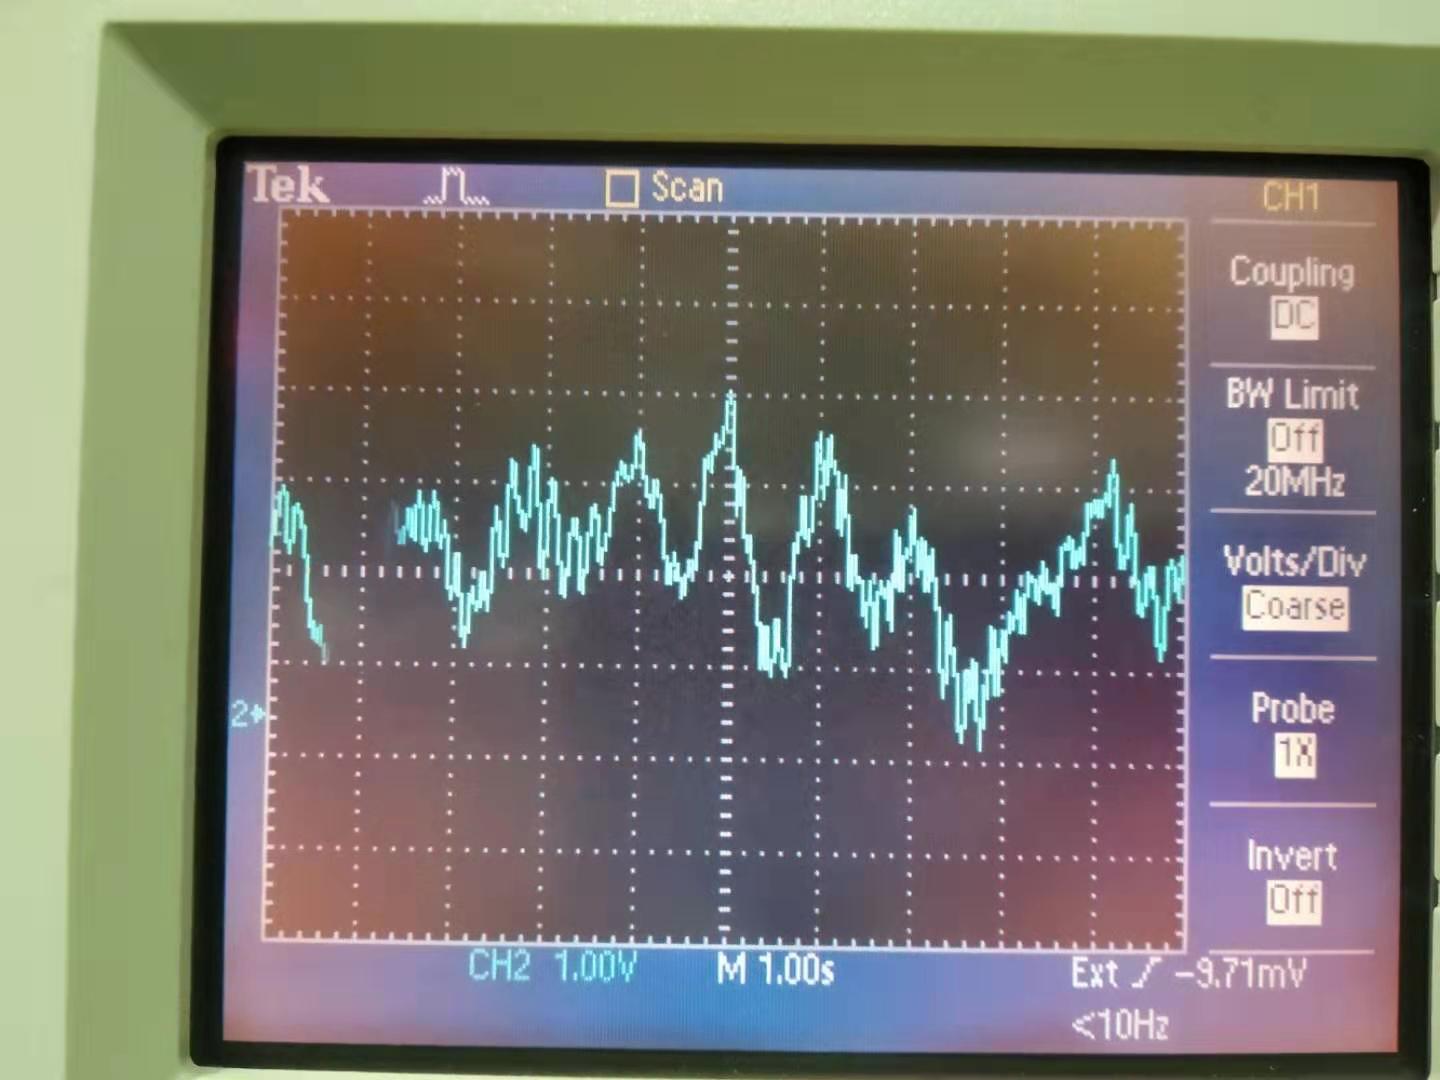
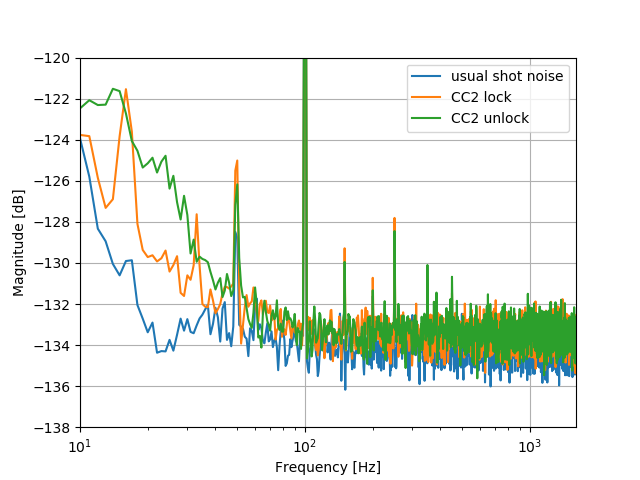
On the other hand, there are frequency components of noise sent to IR phase shifter(attached figure 1). We measured the spectrum of homodyne when only lock CC2. (OPO is locked with p-pol, no pump sent to OPO, CC is on resonance inside OPO by tuning PLLp-pol, then let field goes to FC and reflects to homodyne, the 7MHz on homodyne is used to lock CC2) The result is shown in the attached figure 2. We also tried to send sine wave to IR phase shifter, and measured homodyne spectrum. This result is shown in the attached figure 3. These two measurement proves that the low frequency bump has contribution from IR phase shifter noise.
Please check the attached videos.
1st video shows the old broken cable.
2nd video shows the new good cable.

Simon, Pengbo
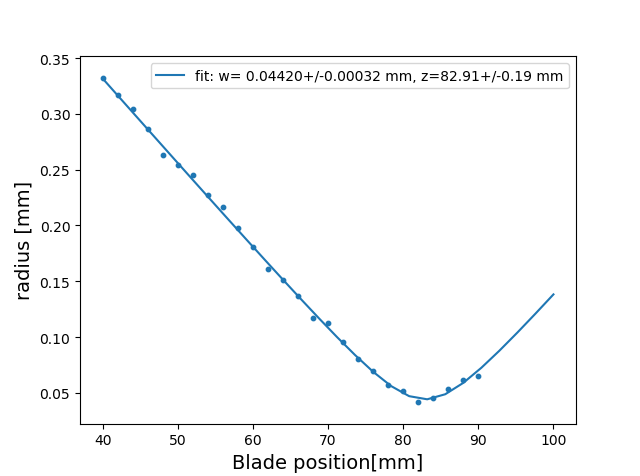
We move the first lens back to the FI direction with 1 cm, then move the second lens by 0.5 cm to the direction of the input beam.
As can be see from the image, the waist z_position change from 80mm to 70mm, and the radius is smaller than before.
we think by moving the second lens for another 0.5 cm, the waist should exist at the z_position around 60 mm.
Also the waist radius might reduce a little bit.
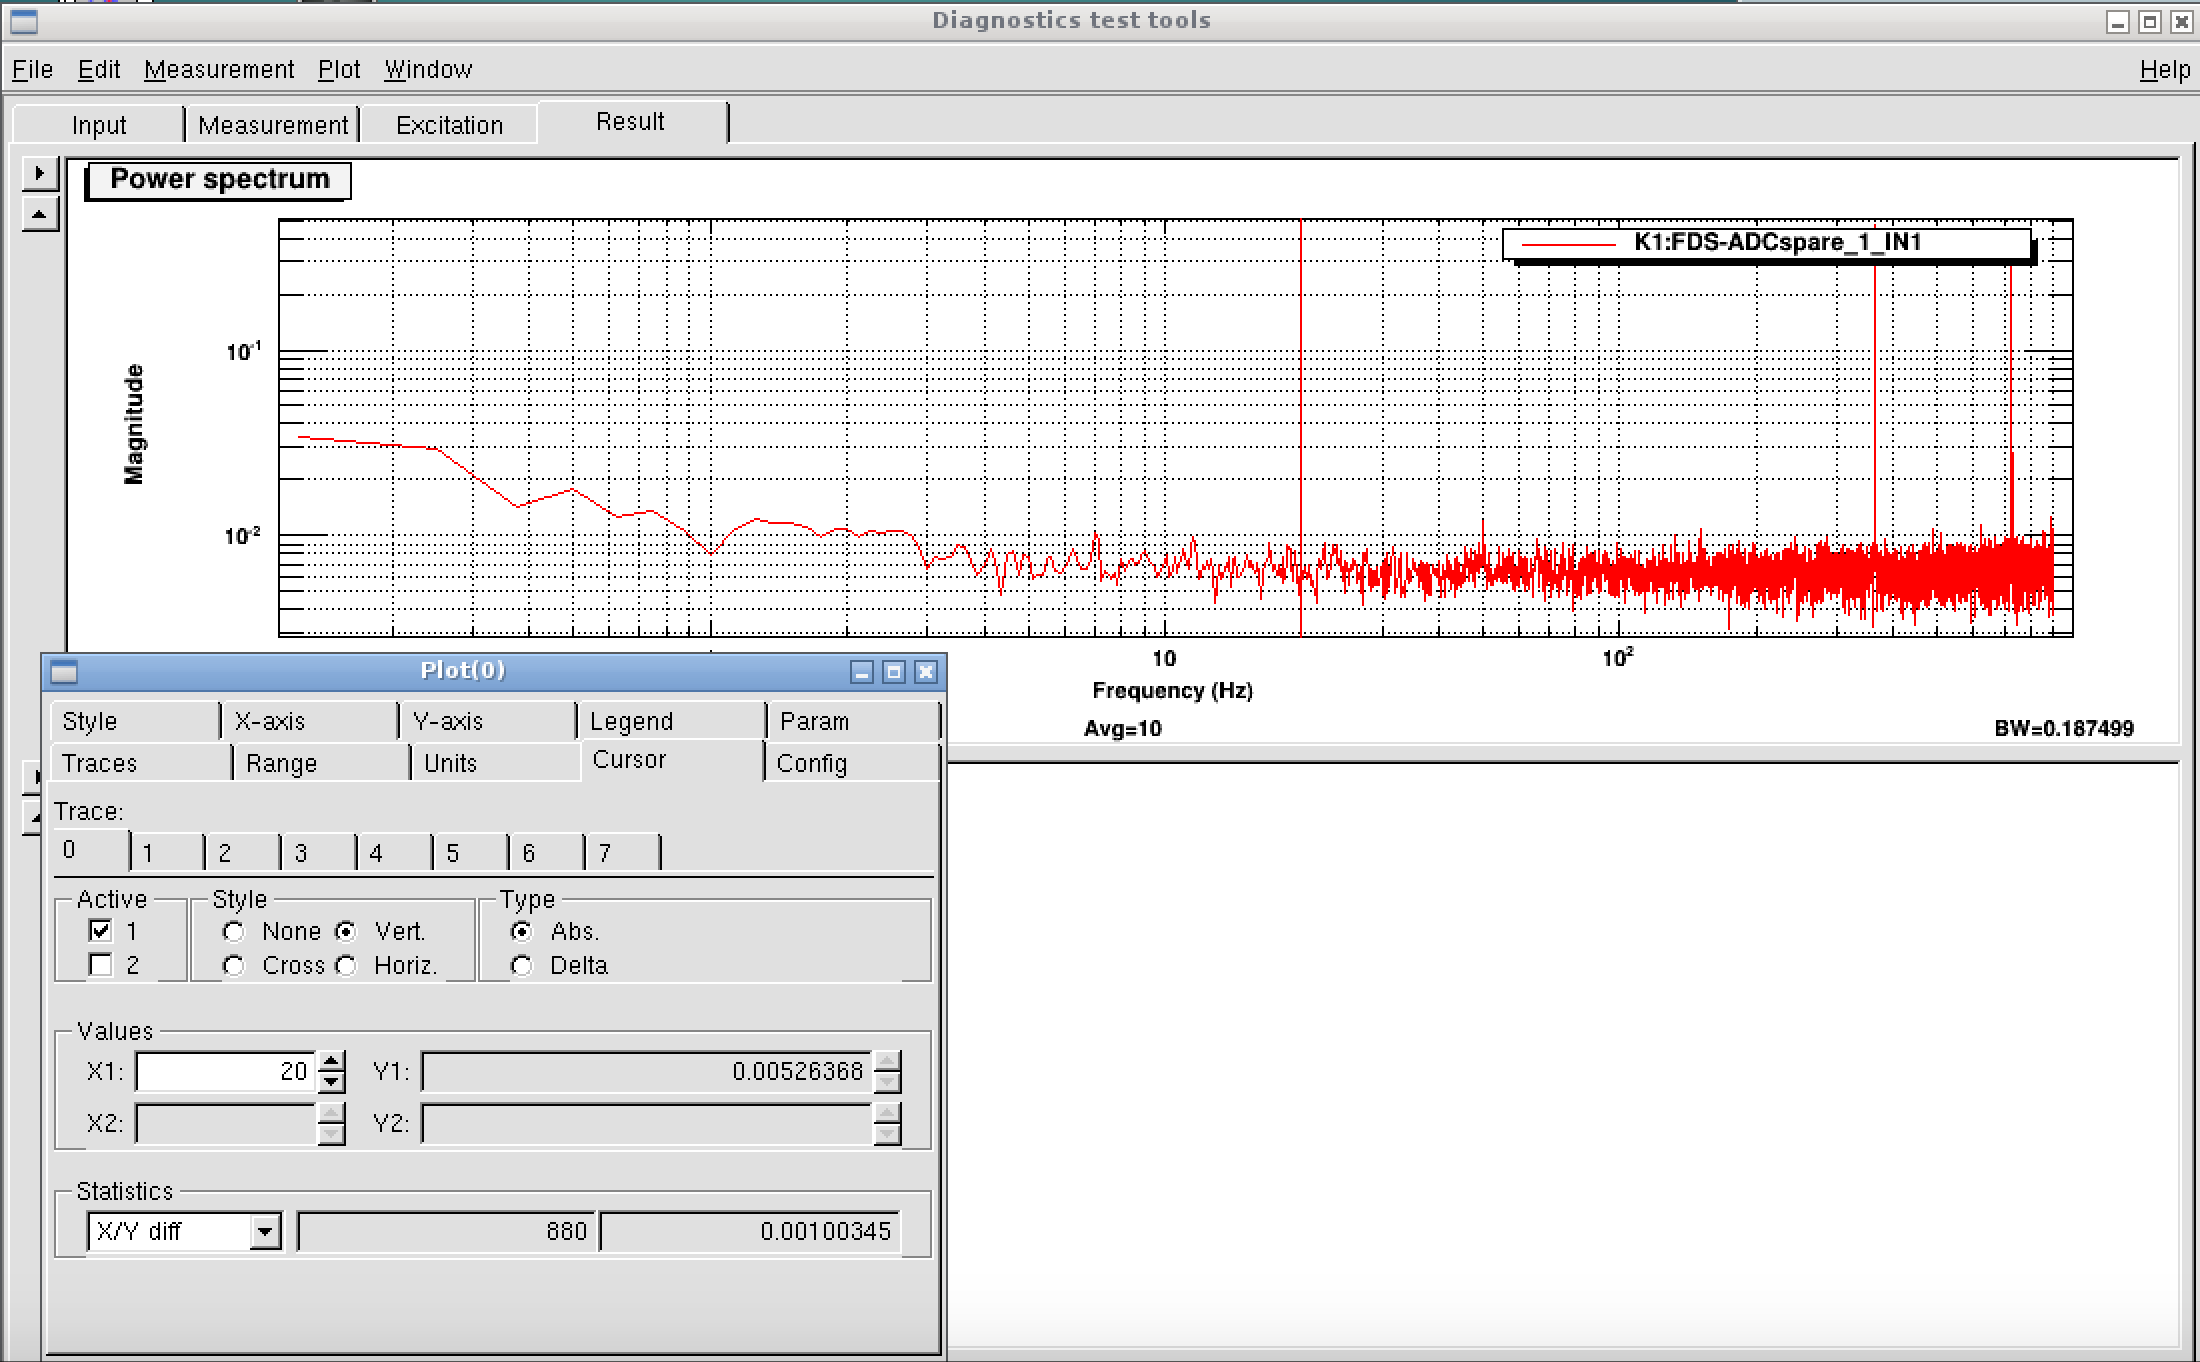
The measurement is done by measure in DGS with 50 Ohm inserted into the channel.
The unit of measurement is counts, so we need to do calibration. The calbration factor is 0.61V for 1000 counts (see entry #1315). So we have
Noise_ADC = ~ 3e-6 [V/sqrt(Hz)]
or alternatively
Noise_ADC = 20*log(3e-6) = -110 dBVrms
This is almost 40dB higher than the noise of Network analizer we always use. So if we use DGS to record data, we will use at least 100 amplification given by pre-amplifier (SR560).

[Aritomi, Eleonora, Matteo]
To reduce LO backscattering, we reduced LO power by a factor of 10. We also increased CC2 gain from 3 to 10.
Attached picture is FDS when CC2 demodulation phase is 20deg and 40deg. There is still large bump below 60Hz.
We thought the bump is changing when CC2 demodulation phase is changed, but it seems that bump itself doesn't change with CC2 demodulation phase.
[Aritomi, Eleonora, Matteo]
To reduce the effect of locking accuracy, we reduced green power from 40mW to 25mW.
OPO temperature: 7.172 kOhm, p pol PLL: 200 MHz
Then we measured FDS. CC2 demodulation phase is 20deg for anti squeezing and 130deg for squeezing.
Simon Pengbo
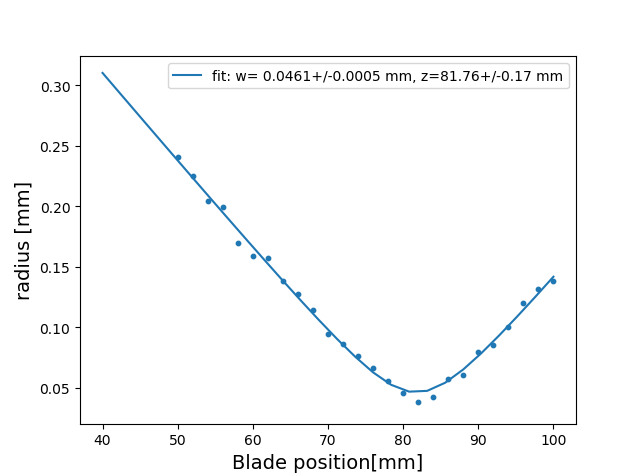
Today, we continue the measurement of the beam waist. First we changed the position of the first lens, putting it bewteen the FI and the PBS, and make it adjustable.
By changing the position of the first lens, we did two x axis scans. It seems that as the first lens moves away from the FI, the waist become lager and closer to laser bench direction.
We will do more tests next week.
I re-aligned another double-pass AOM.
The total diffraction efficiency is about 70% which is reasonable value.
Then I modified the position of BS for ISS.
The next step is align the HOM's beams.
In addition, I ordered pillars for composing stage inside the cryostat chamber.
The drawing will be uploaded on wiki.
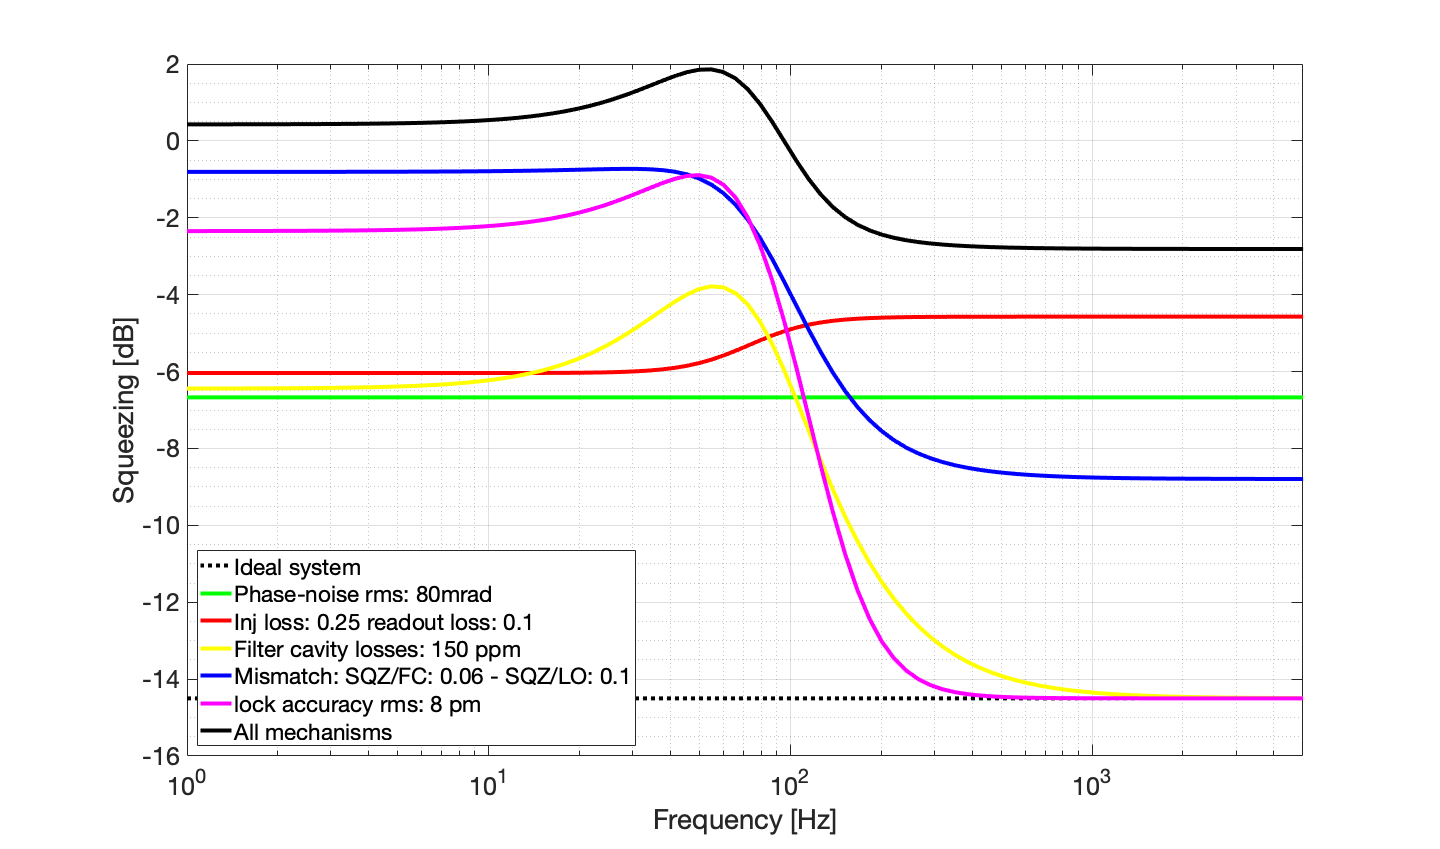
Given the number Aritomi-san used (which are maybe too optimistic about MM), if we reduce the amount of initial squeezing from 16 dB to 6 dB. The effect of lock accuracy is much reduced and in priciple we should be able to go below shot noise.

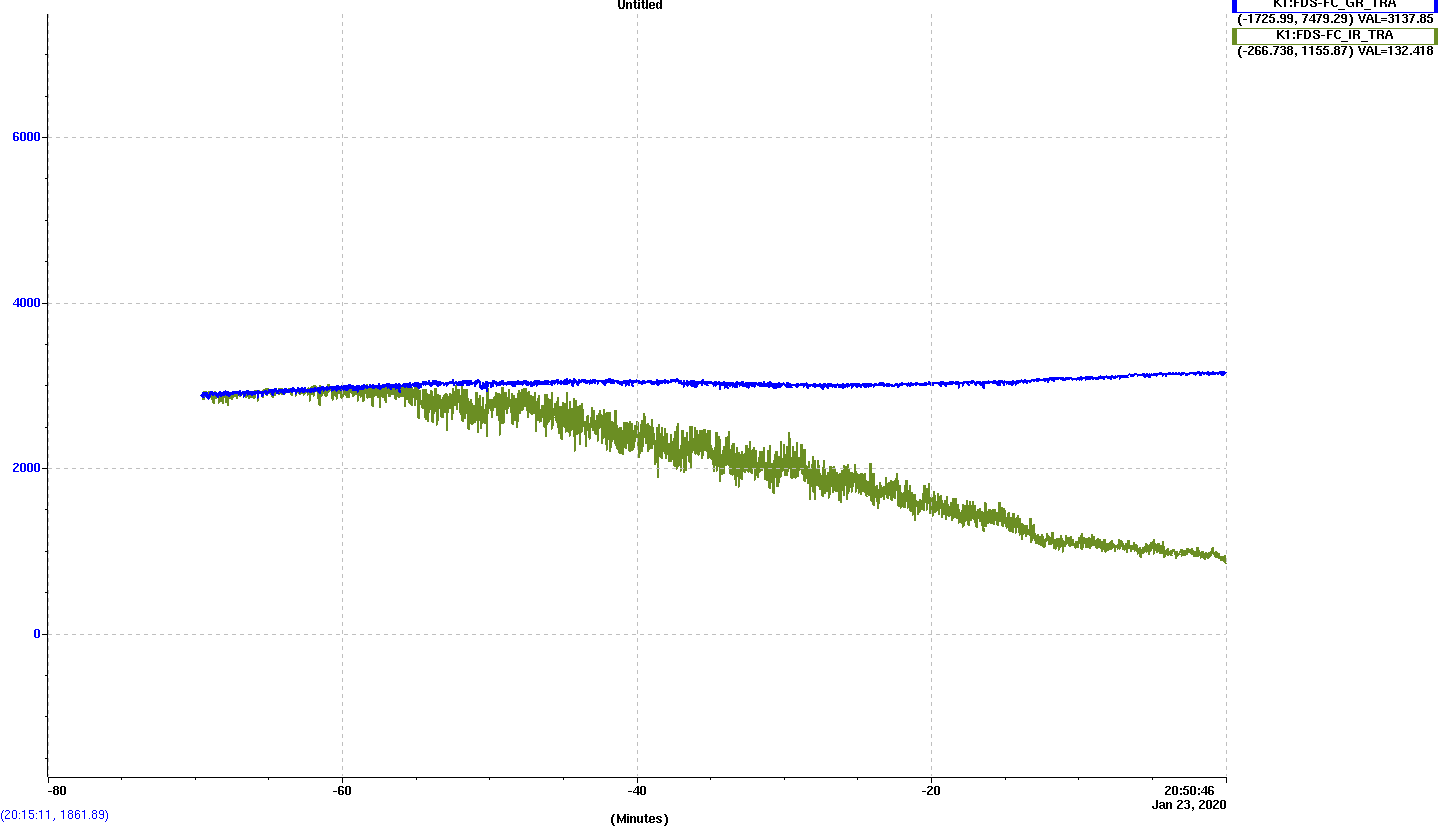
We lock FC with green (and dithering alignment on pitch), set BAB on resonance and monitored both IR and transmitted power. See attached plot.
IR transmission starts to decrease after ~15 min.
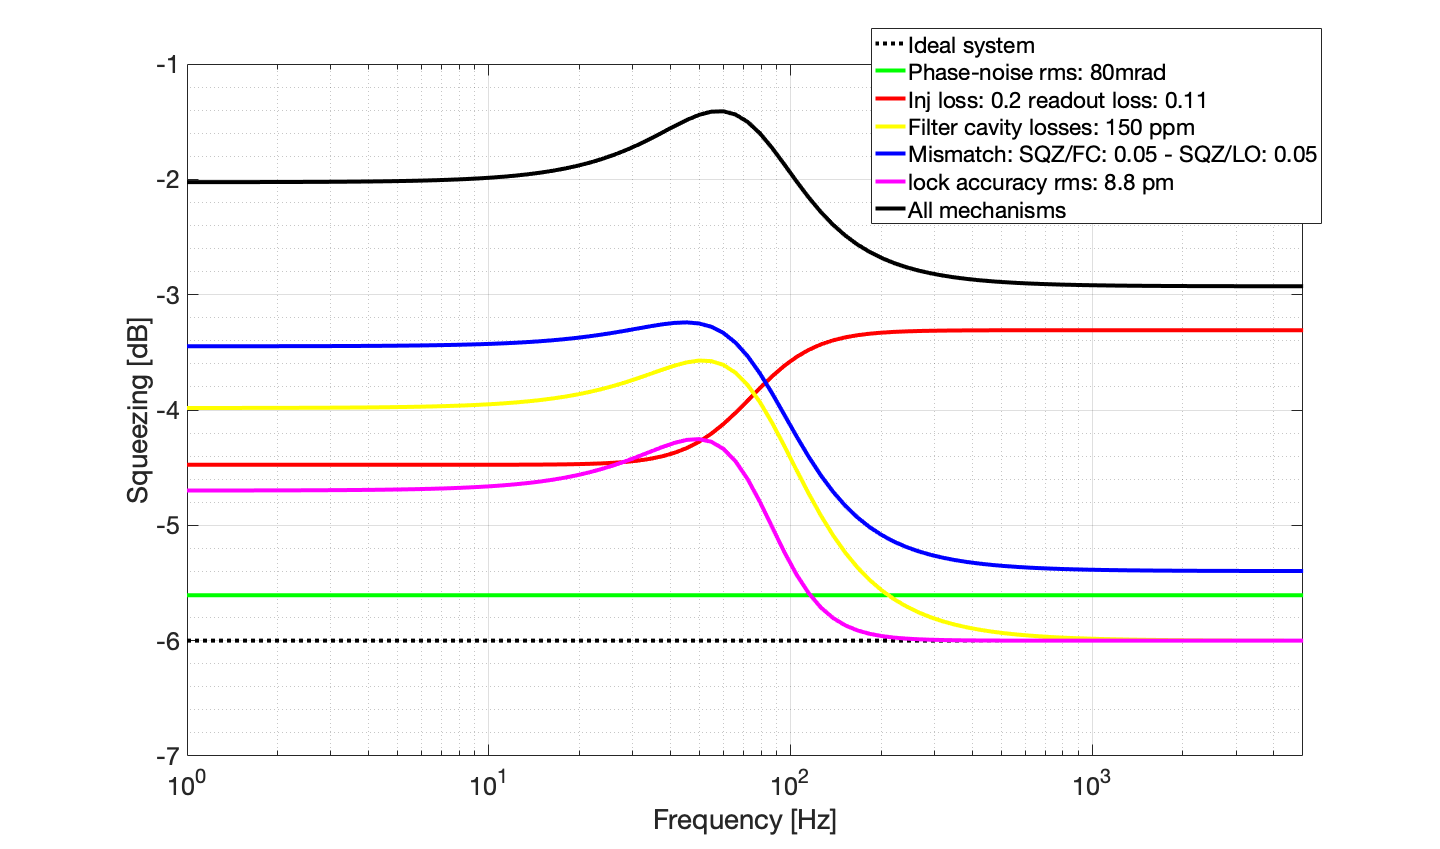
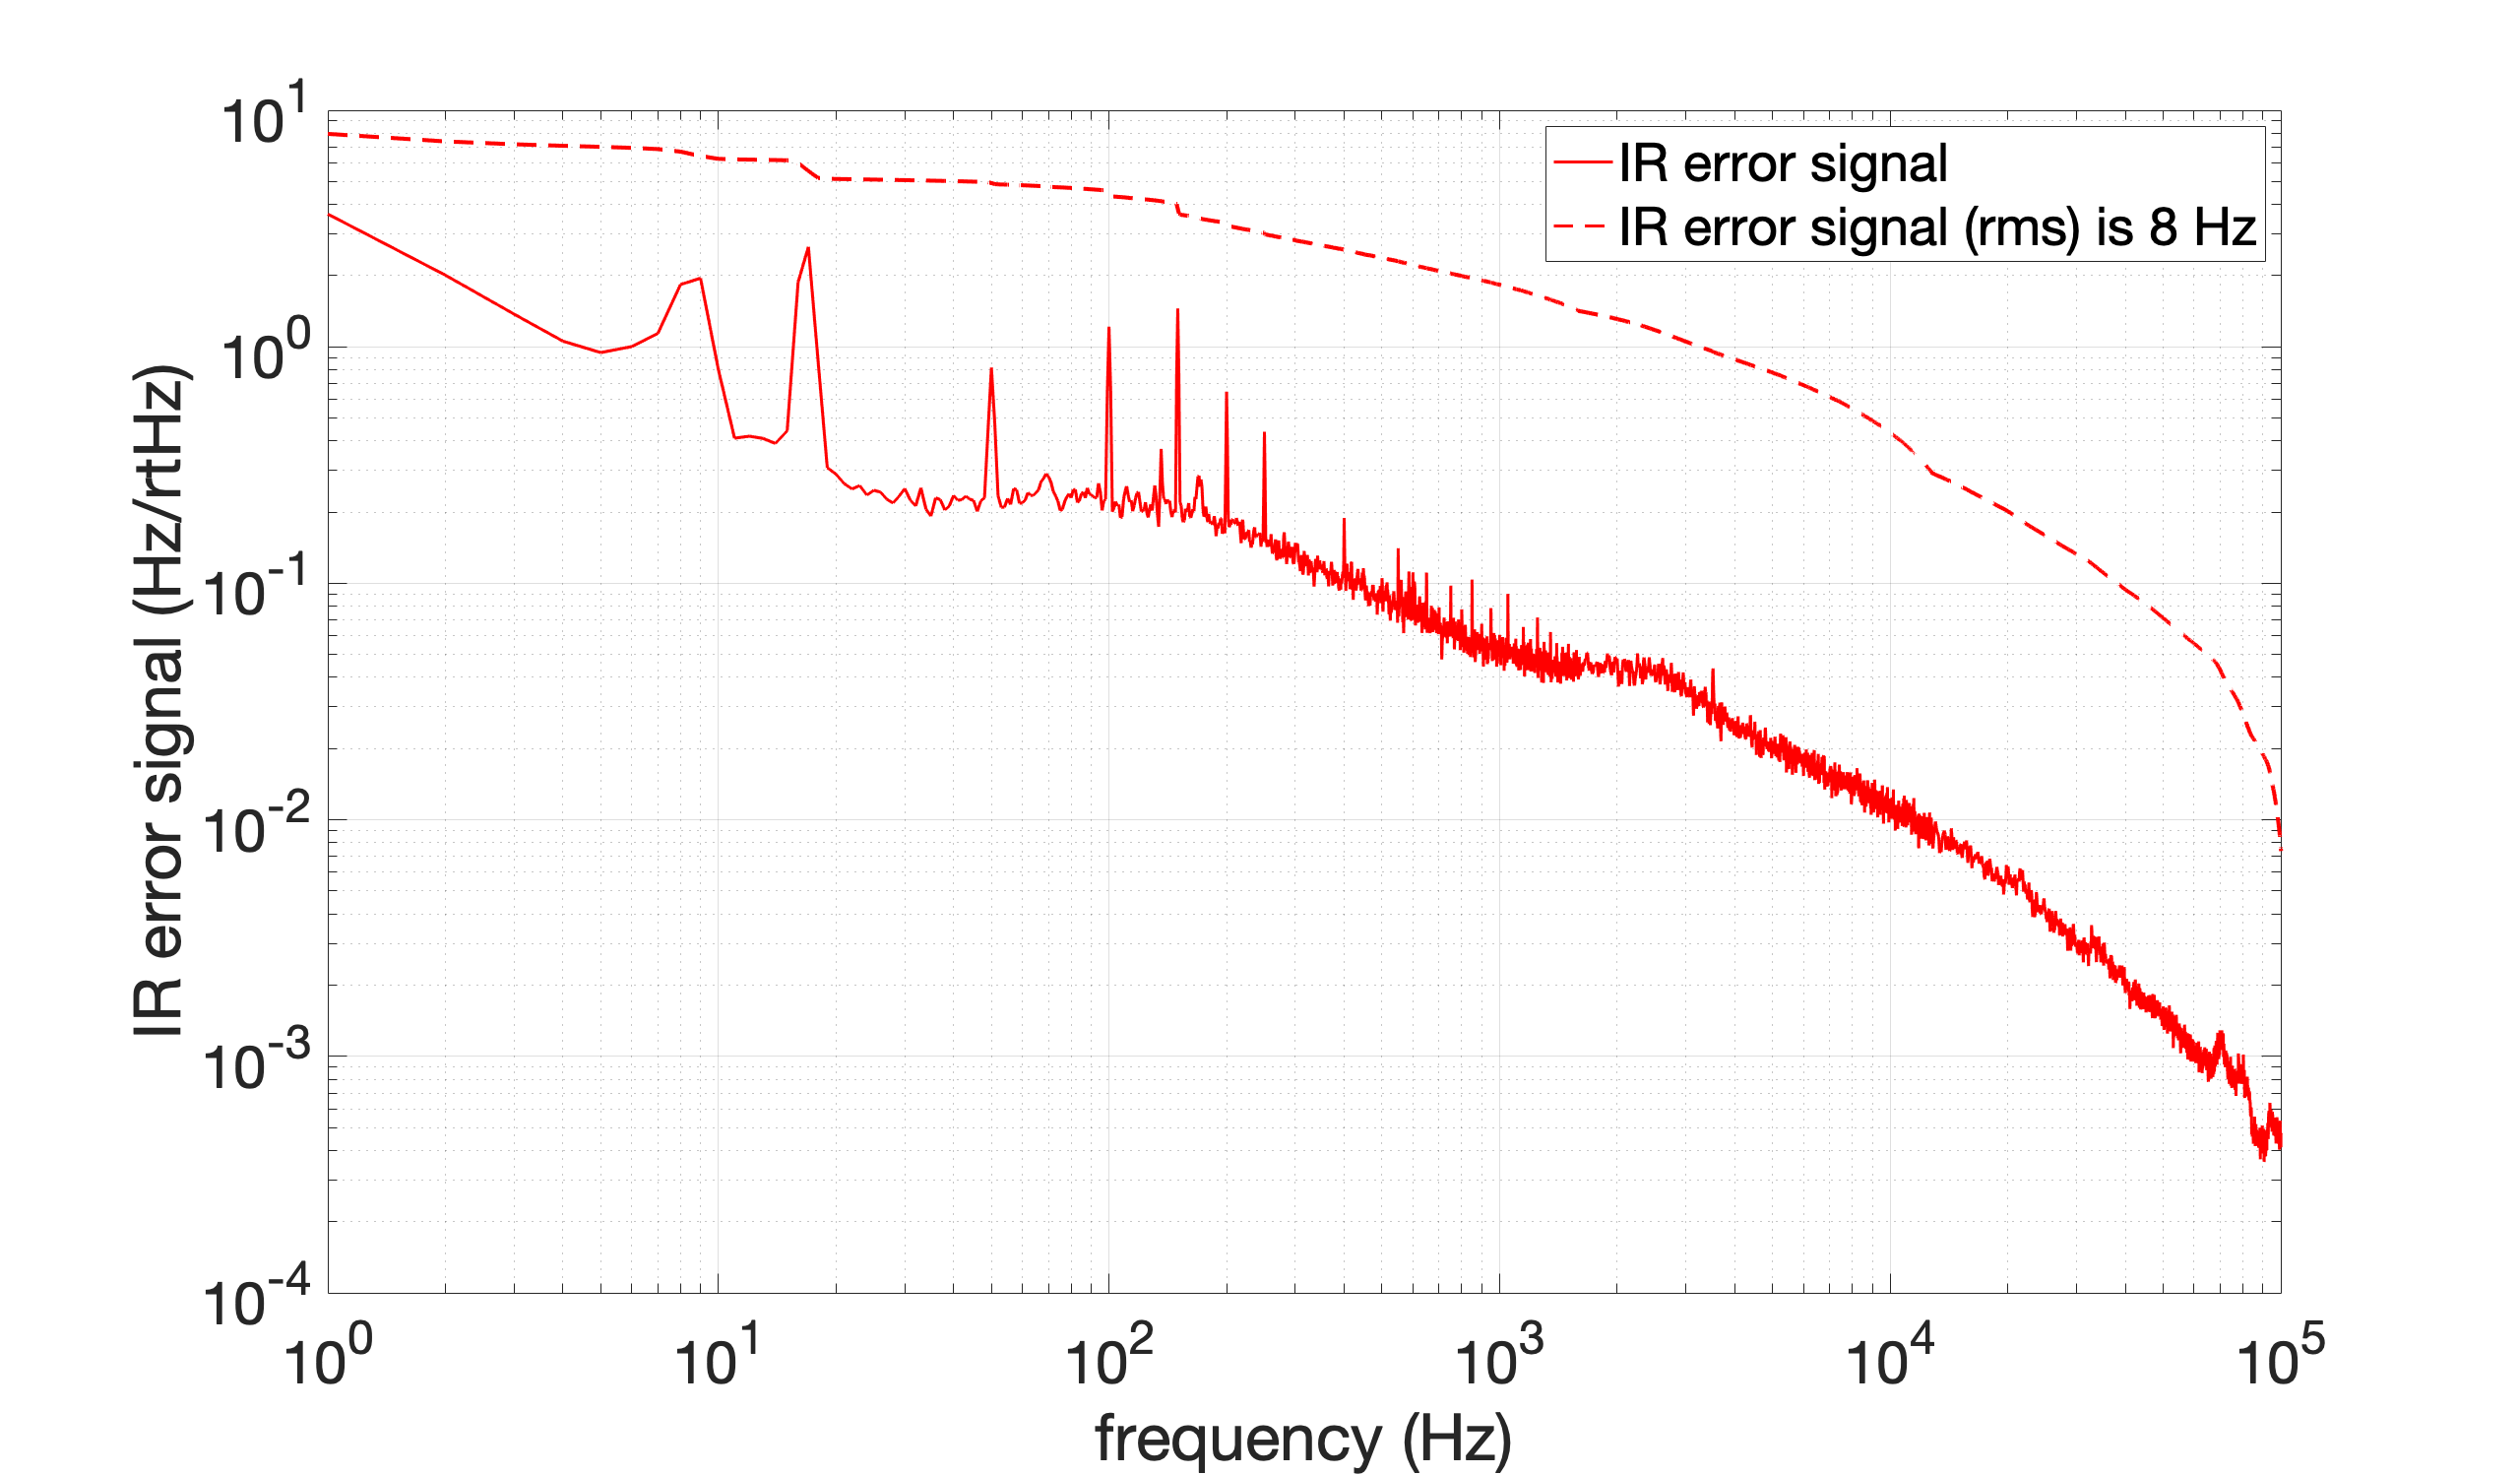
[Aritomi, Eleonora, Yuhang]
First we measured locking accuracy as shown in FIG. 1. Locking accuracy is 8 Hz which corresponds to 8.8 pm.
Then we changed green pump power from 50mW to 40mW so that we can reproduce FDS measurement before. OPO temperature and p pol PLL is as follows.
| green power (mW) | 0 | 40 |
| OPO temperature (kOhm) | 7.2 | 7.2 |
| p pol PLL (MHz) | 300 | 190 |
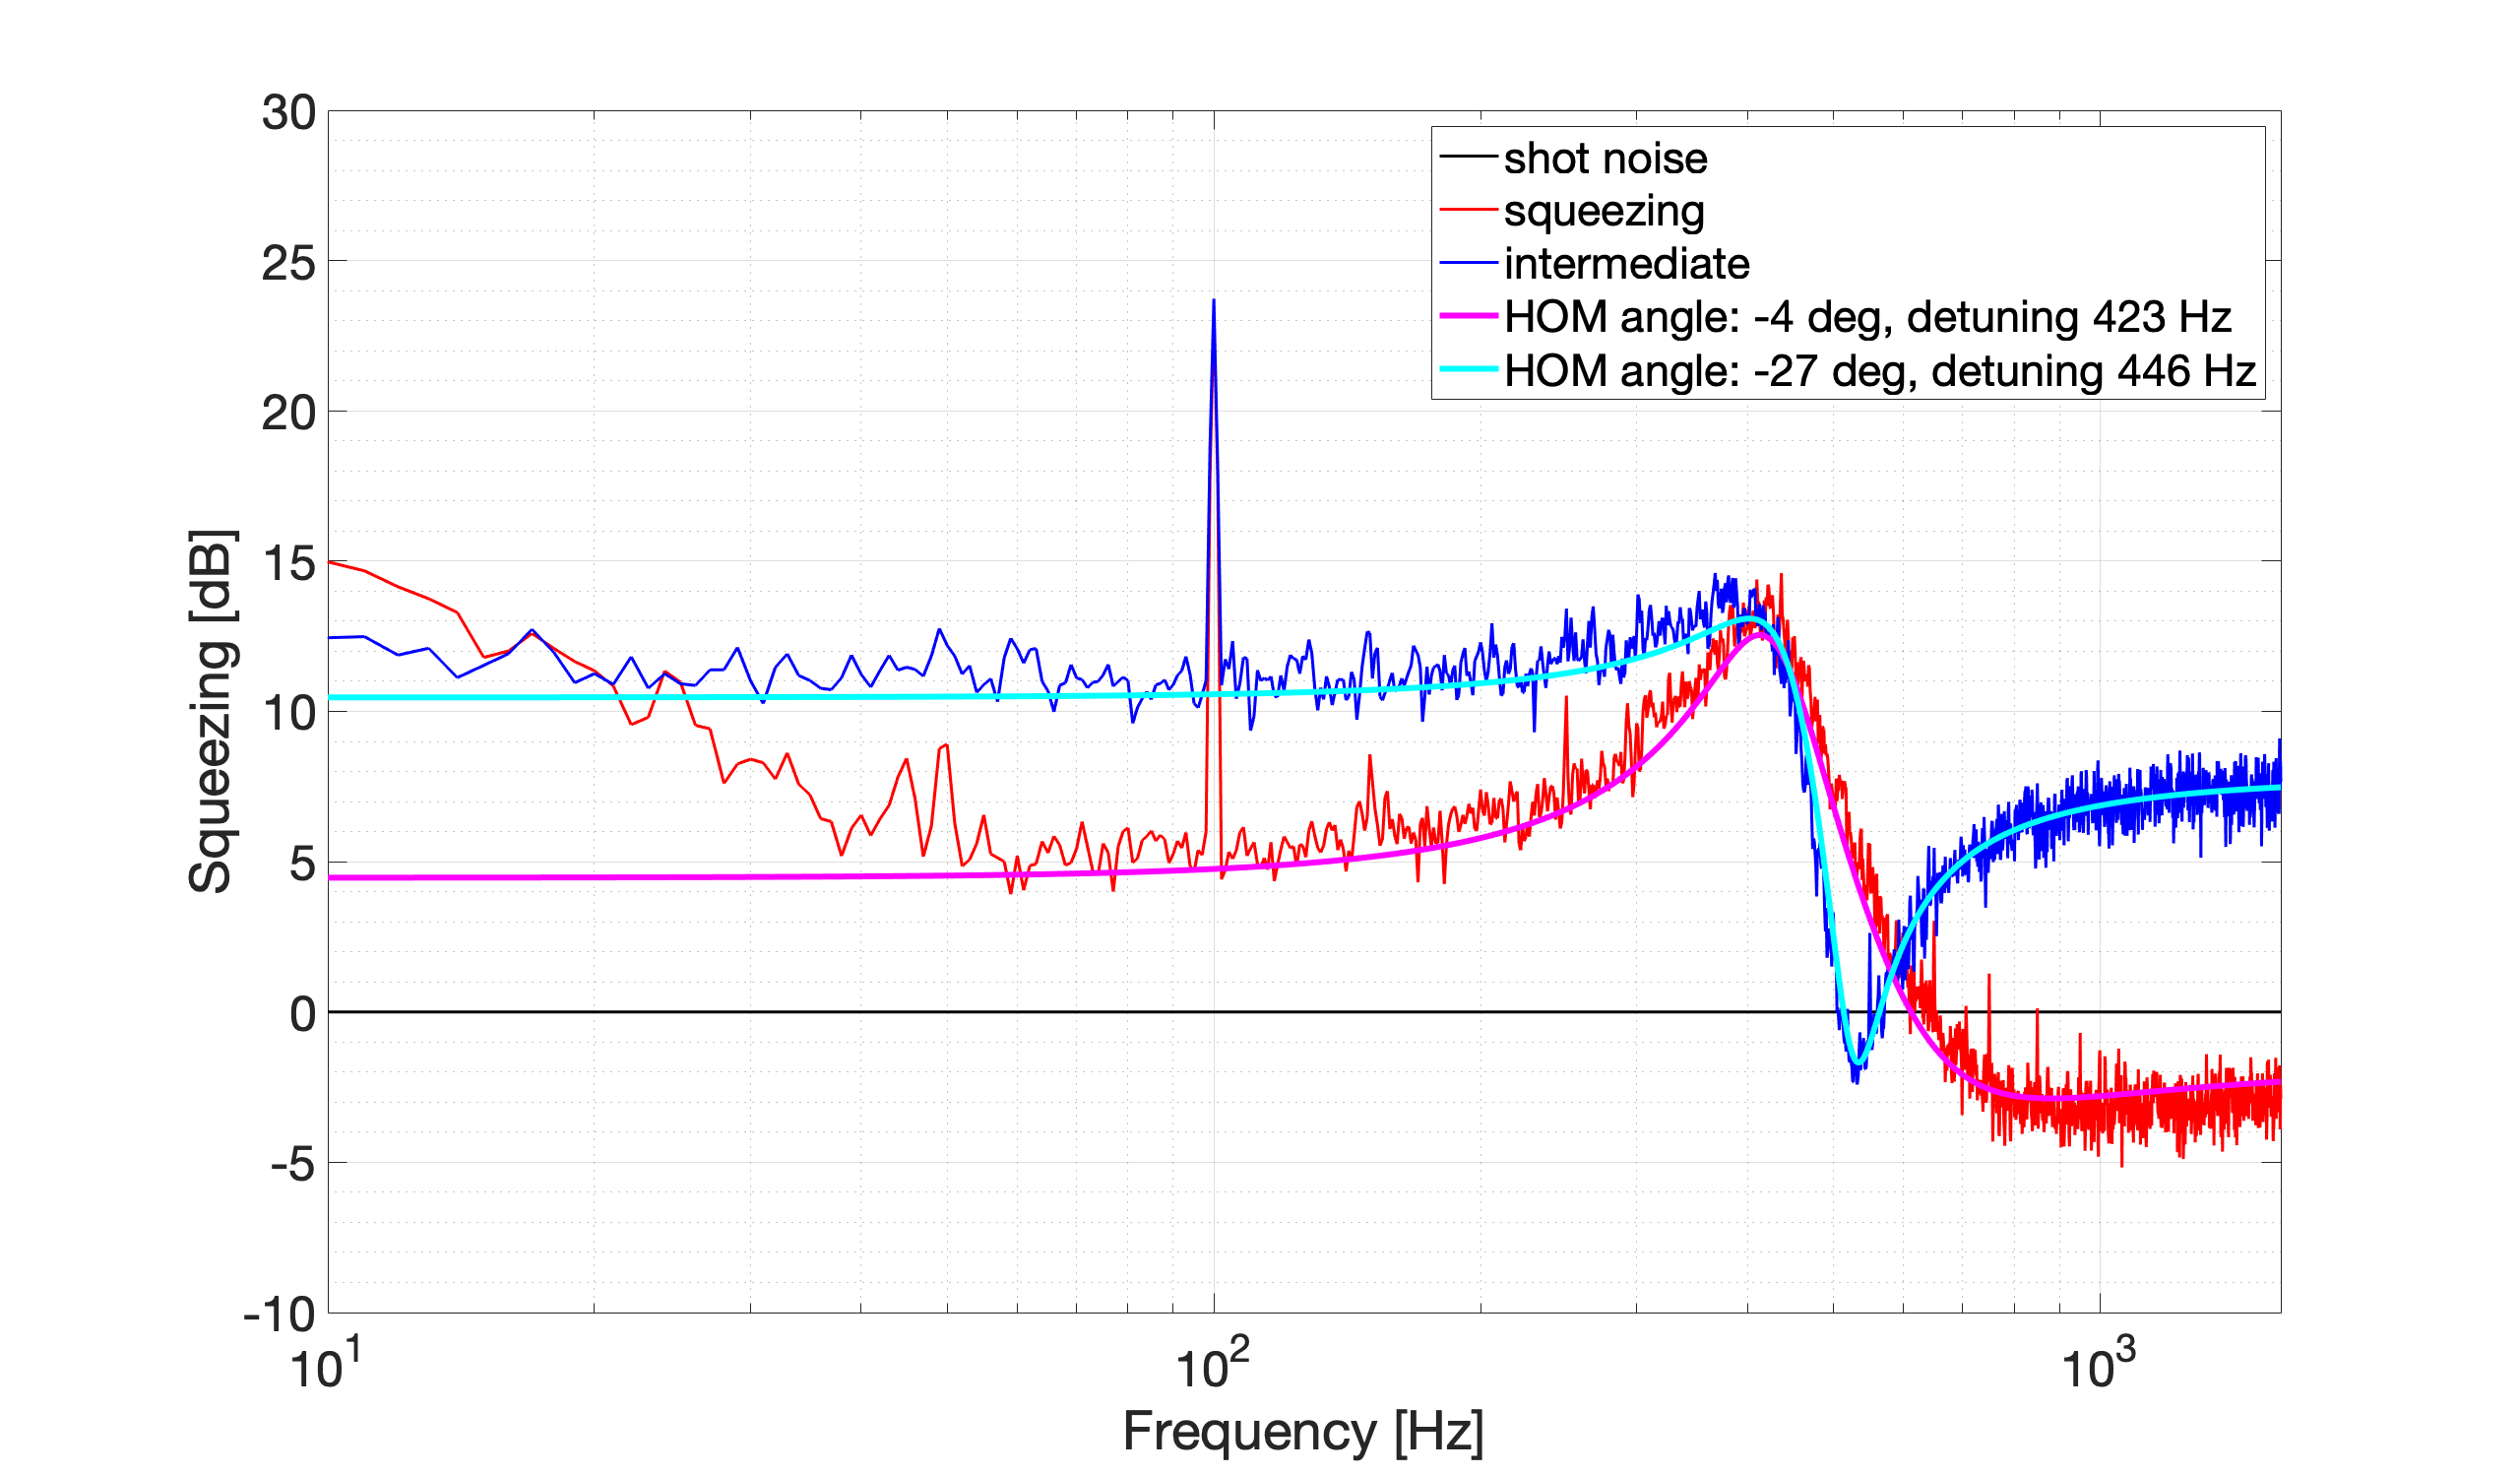
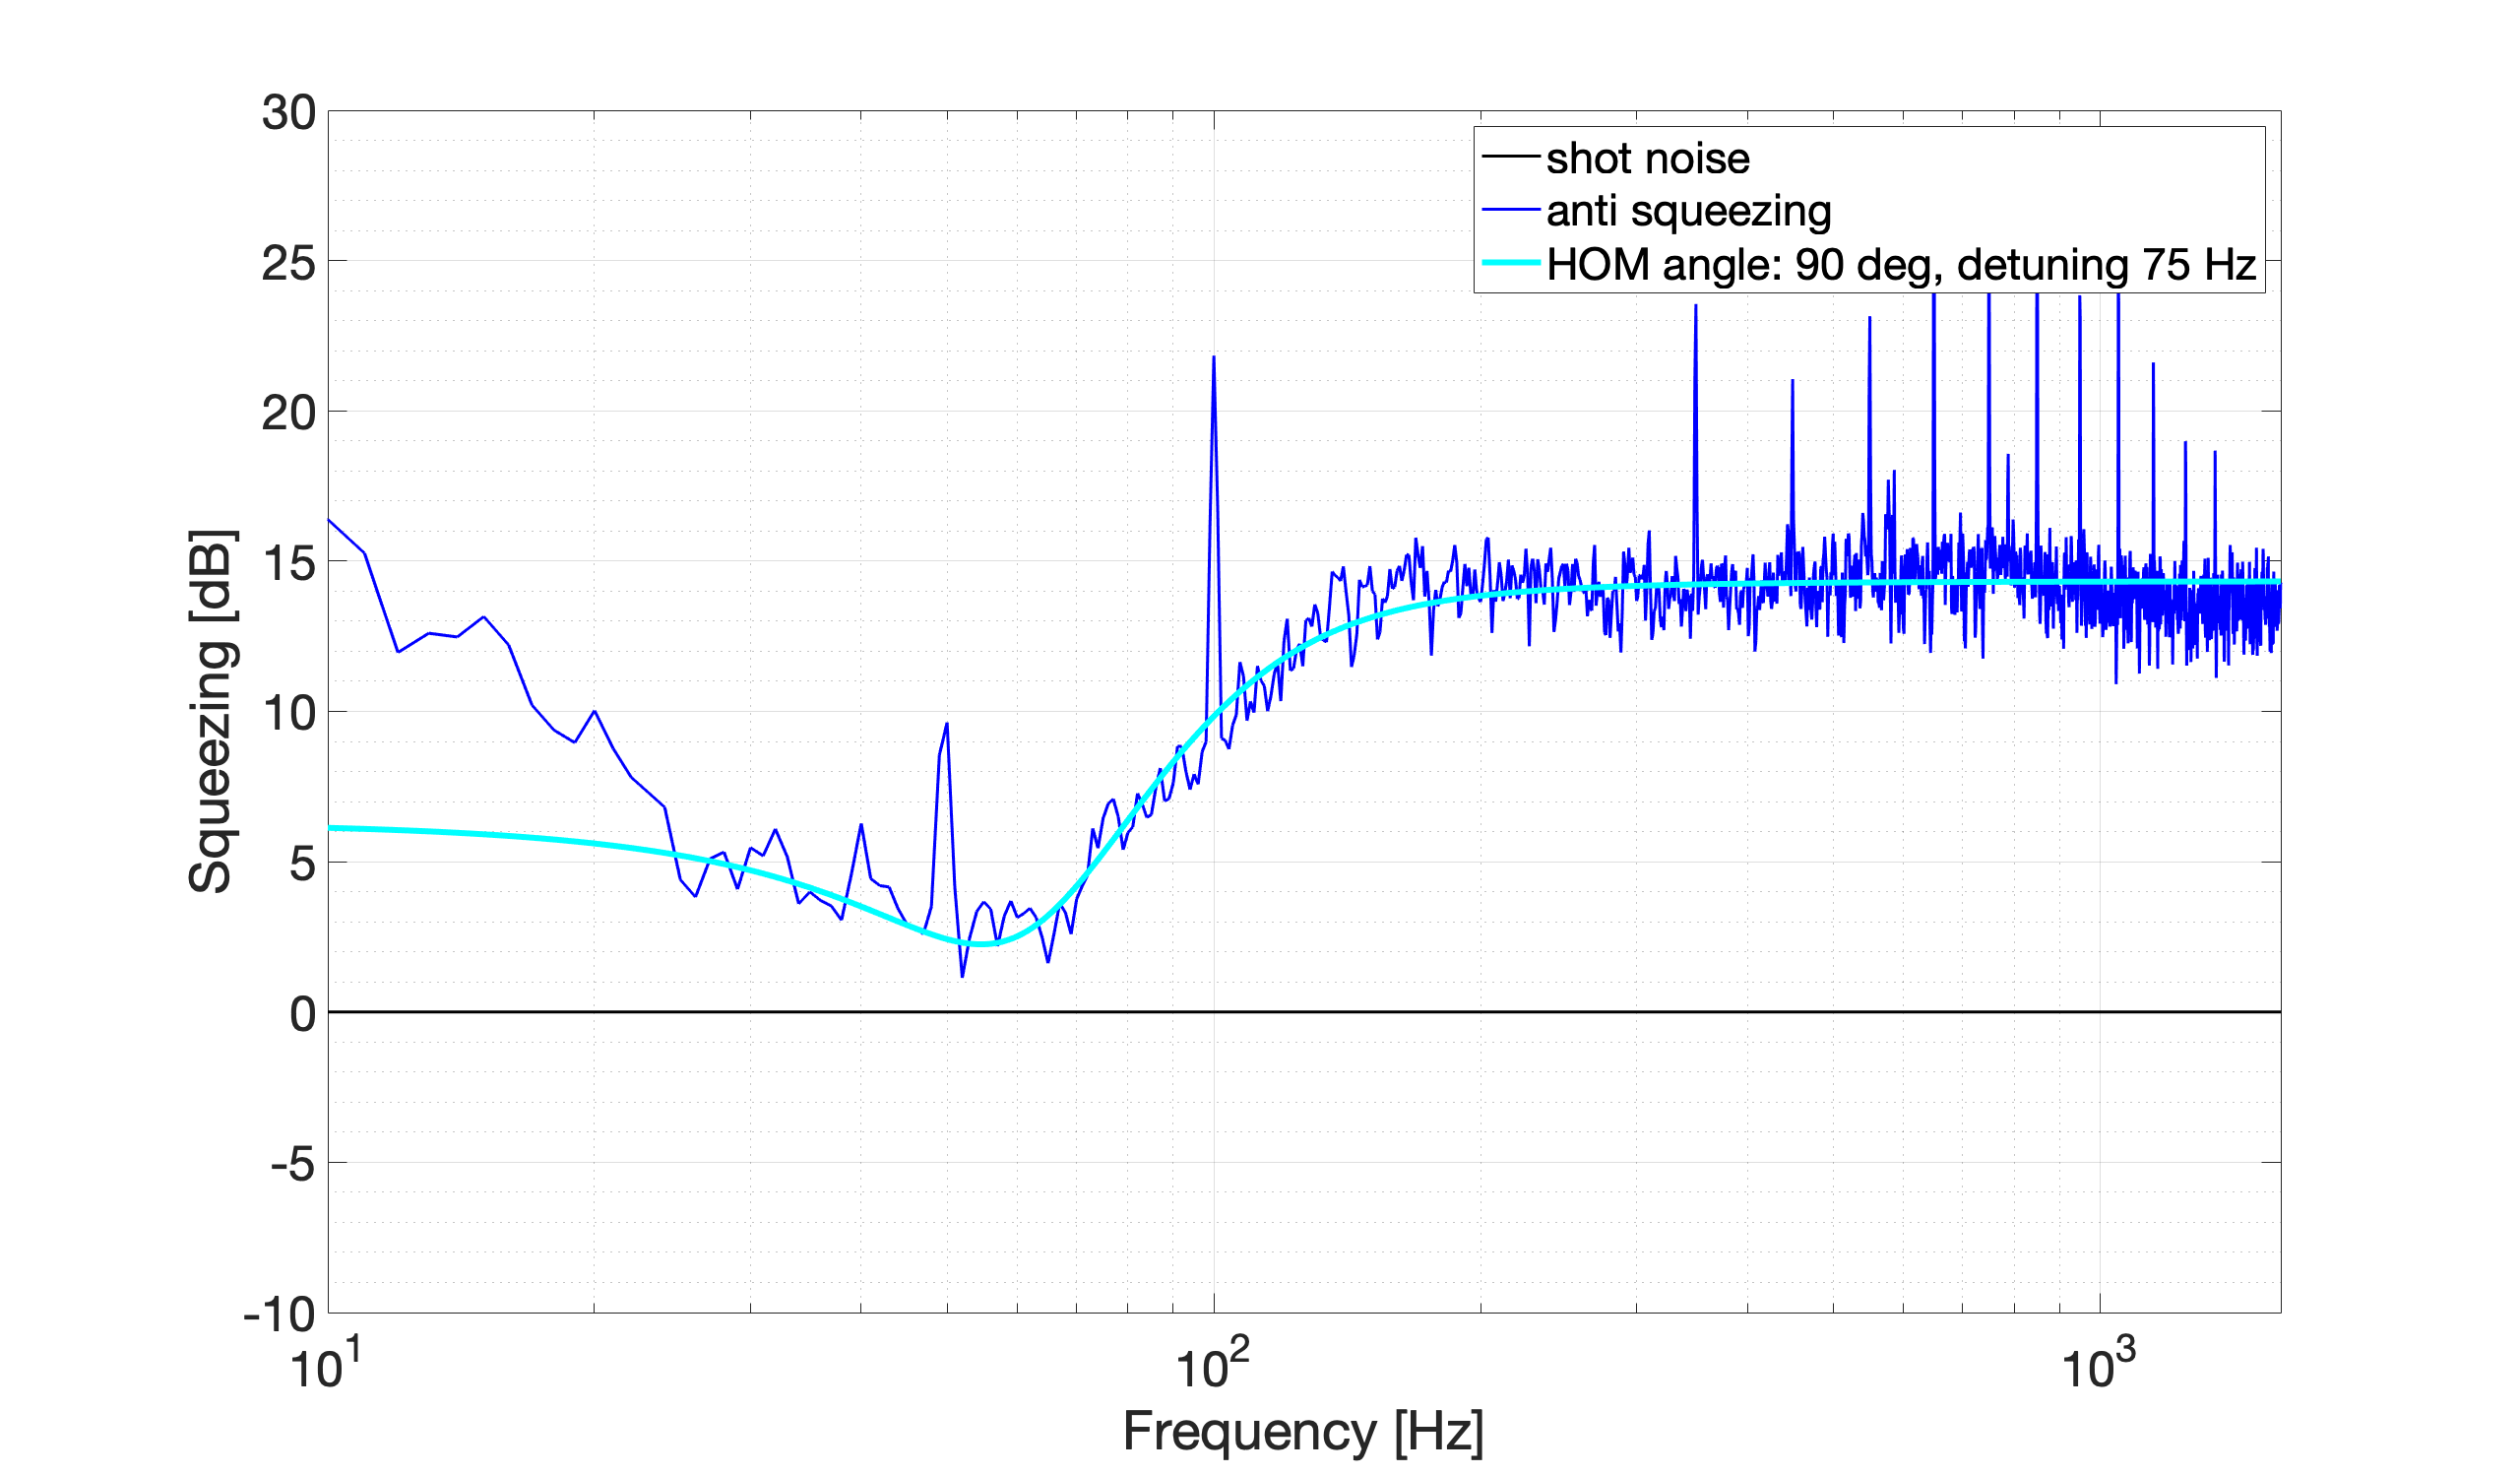
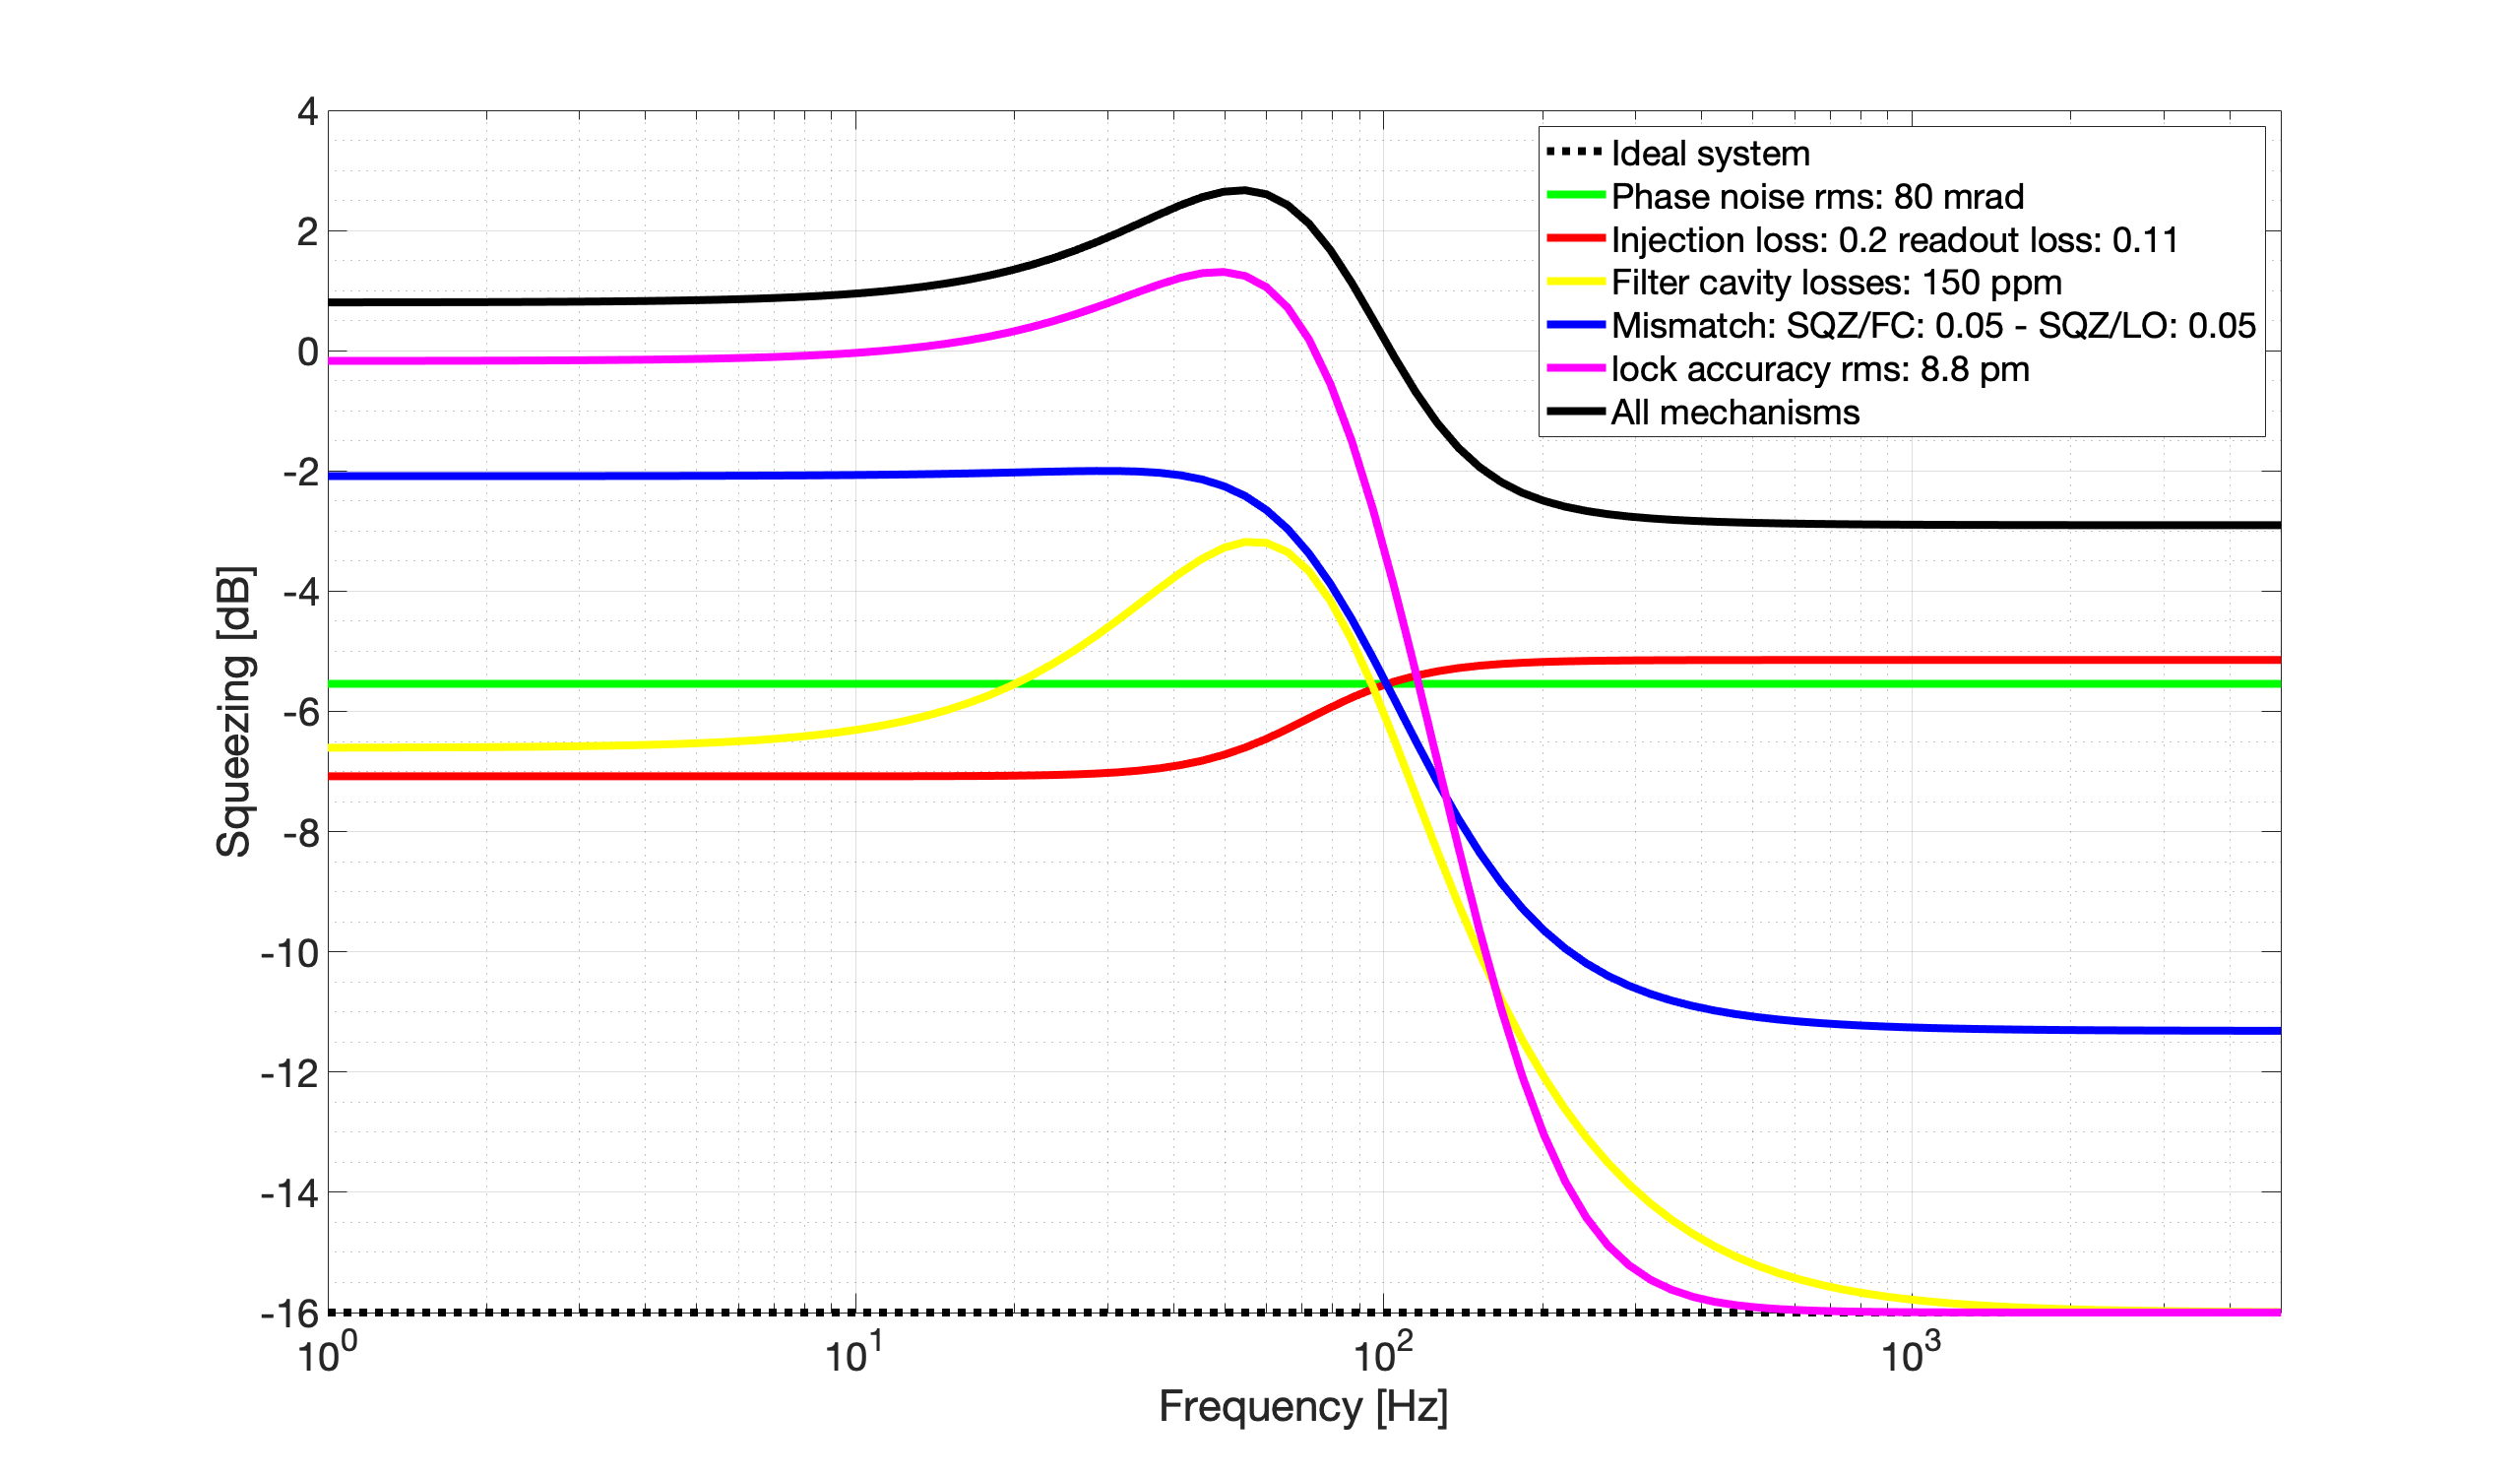
Then we measured FDS around 400 Hz and 75 Hz detuning (FIG. 2 and FIG. 3). The parameters are as follows. Degradation budget is shown in FIG. 4.
It seems that locking accuracy is limiting squeezing level at low frequency.
sqz_dB = 16; % produced SQZ
L_rt = 150e-6; % FC losses
L_inj = 0.20; % Injection losses
L_ro = 0.11; % Readout losses
A0 = 0.05; % Squeezed field/filter cavity mode mismatch losses
C0 = 0.05; % Squeezed field/local oscillator mode mismatch losses
ERR_L = 8.8e-12; % Lock accuracy [m]
ERR_csi = 80e-3; % Phase noise[rad]
phi_Hom = [-4/180*pi, -27/180*pi]; % Homodyne angle [rad]
det = [423 446]; % detuning frequency [Hz]
sqz_dB = 16; % produced SQZ
L_rt = 150e-6; % FC losses
L_inj = 0.20; % Injection losses
L_ro = 0.11; % Readout losses
A0 = 0.05; % Squeezed field/filter cavity mode mismatch losses
C0 = 0.05; % Squeezed field/local oscillator mode mismatch losses
ERR_L = 8.8e-12; % Lock accuracy [m]
ERR_csi = 80e-3; % Phase noise[rad]
phi_Hom = 90/180*pi; % Homodyne angle [rad]
det = 75; % detuning frequency [Hz]
Given the number Aritomi-san used (which are maybe too optimistic about MM), if we reduce the amount of initial squeezing from 16 dB to 6 dB. The effect of lock accuracy is much reduced and in priciple we should be able to go below shot noise.
Pengbo, Simon
Today we were struggeling hard to align the beam in the sample-area horizontal to the optical table while crossing the probe-beam.
After some hours of work fine-tuning the lenses and steering-mirror, and constant measurements with the blade, we could achieve a good alignment in the end.
Then, we started to check the power-adjustment with the motorized HWP by turning it for 45 degrees. However, we recognized that there is no beam anymore coming out of the FI, from any of its openings.... So, something must have been wrong.
Therefore, we checked the beam-path to the FI again with much lower intensity and saw that the FI became misaligned somehow.
We think that our initial strategy by using adjustable posts may not be enough for the FI...
As a strategy, I will try to find a suitable micrometer-stage for the FI tomorrow and rebuild it.
[Yuhang, Aritomi, Eleonora]
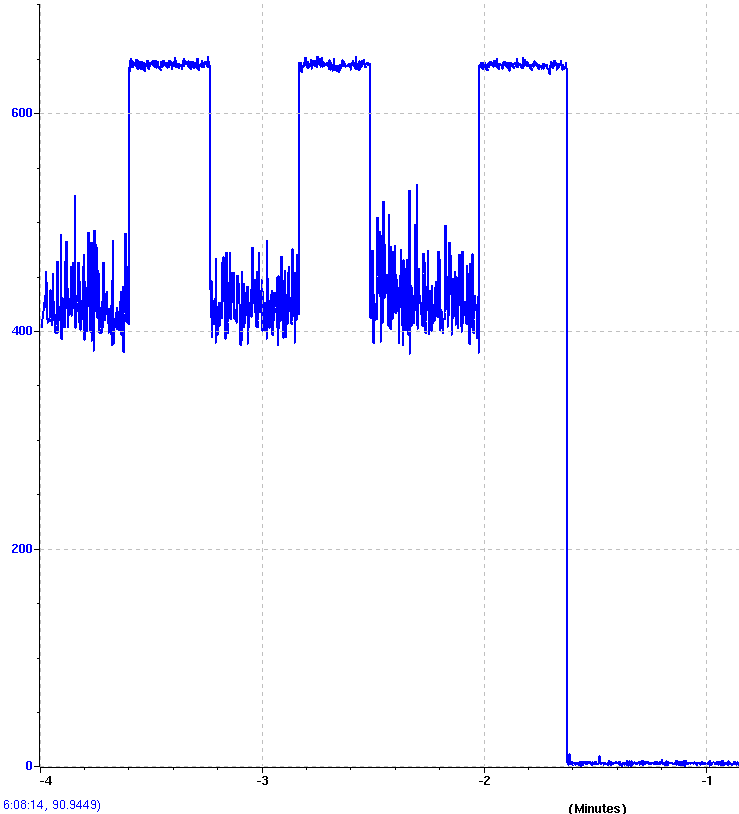
We measured FC round trip losses with the usual lock-unlock technique. (See pic 1). We found about 150 ppm. The associated expected sqz degradation in plotted in fig 2.
Below I reported the computation. The formulas used are from this paper.
P_res = 425;
P_in = 640;
R_gamma = P_res/P_in;
gamma = 0.06;
R = (R_gamma-gamma)/(1-gamma);
T = 0.00136;
L = (T/2)* (1-R)/(1+R) = 148 e-6
I adjusted the beam size at AOMs by changing the positions of lenses.
I aligned one of the AOMs and I could get about 70 % diffaction efficiency with double-pass.
Then I put a BS for ISS.
The next step is align another AOM and install a BS.
with help of Simon
We injected Helium gas into the cryostat chamber.
Current temperature is about 200 K.
It is rising now.
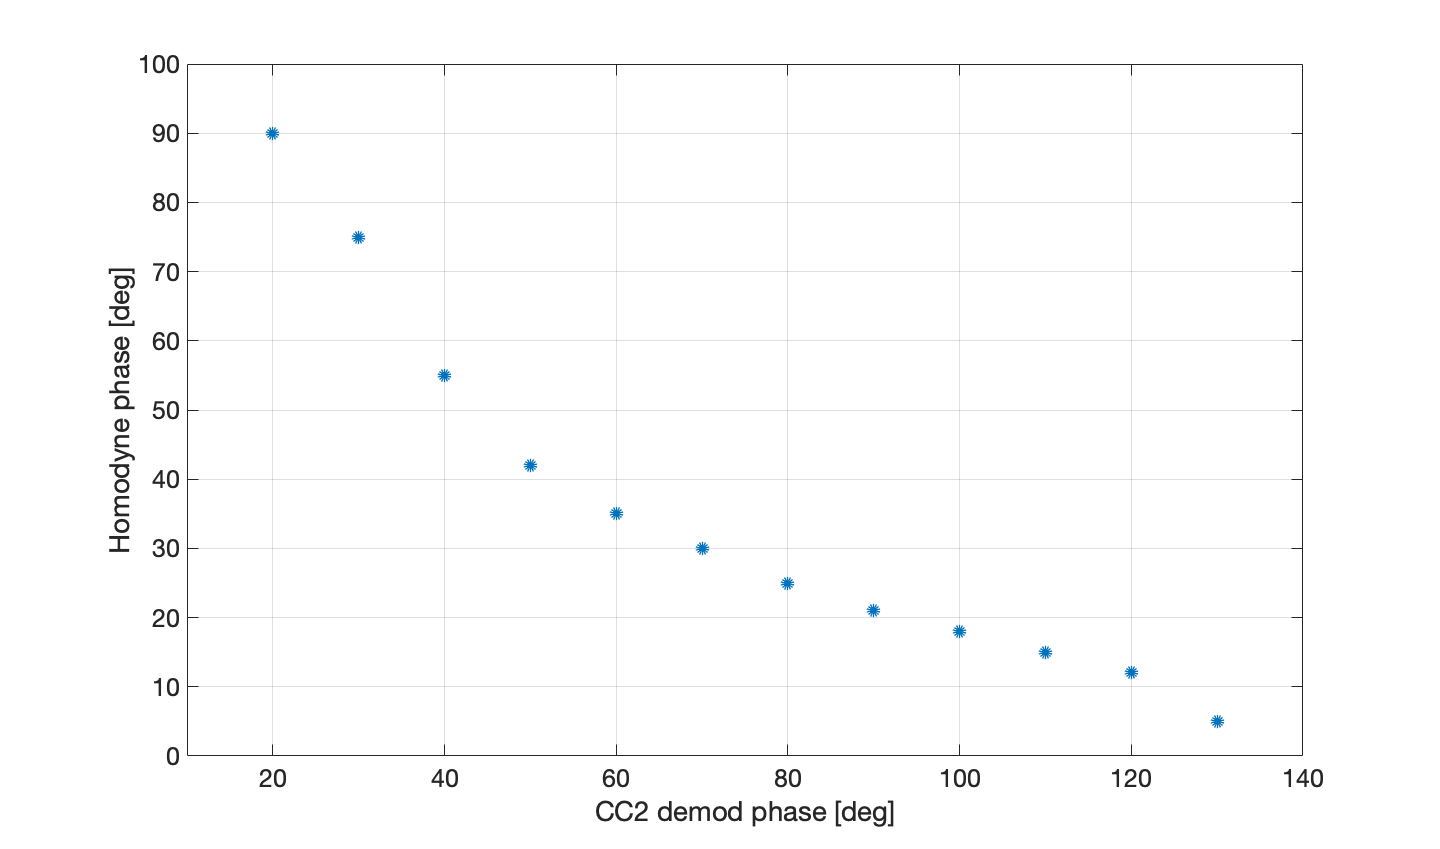
The relation between the CC2 demodulation phase and the measured squeezing phase can be found in this document, uploaded on the Virgo logbook. More details can be found in the entry #44285 of the Virgo logbook.