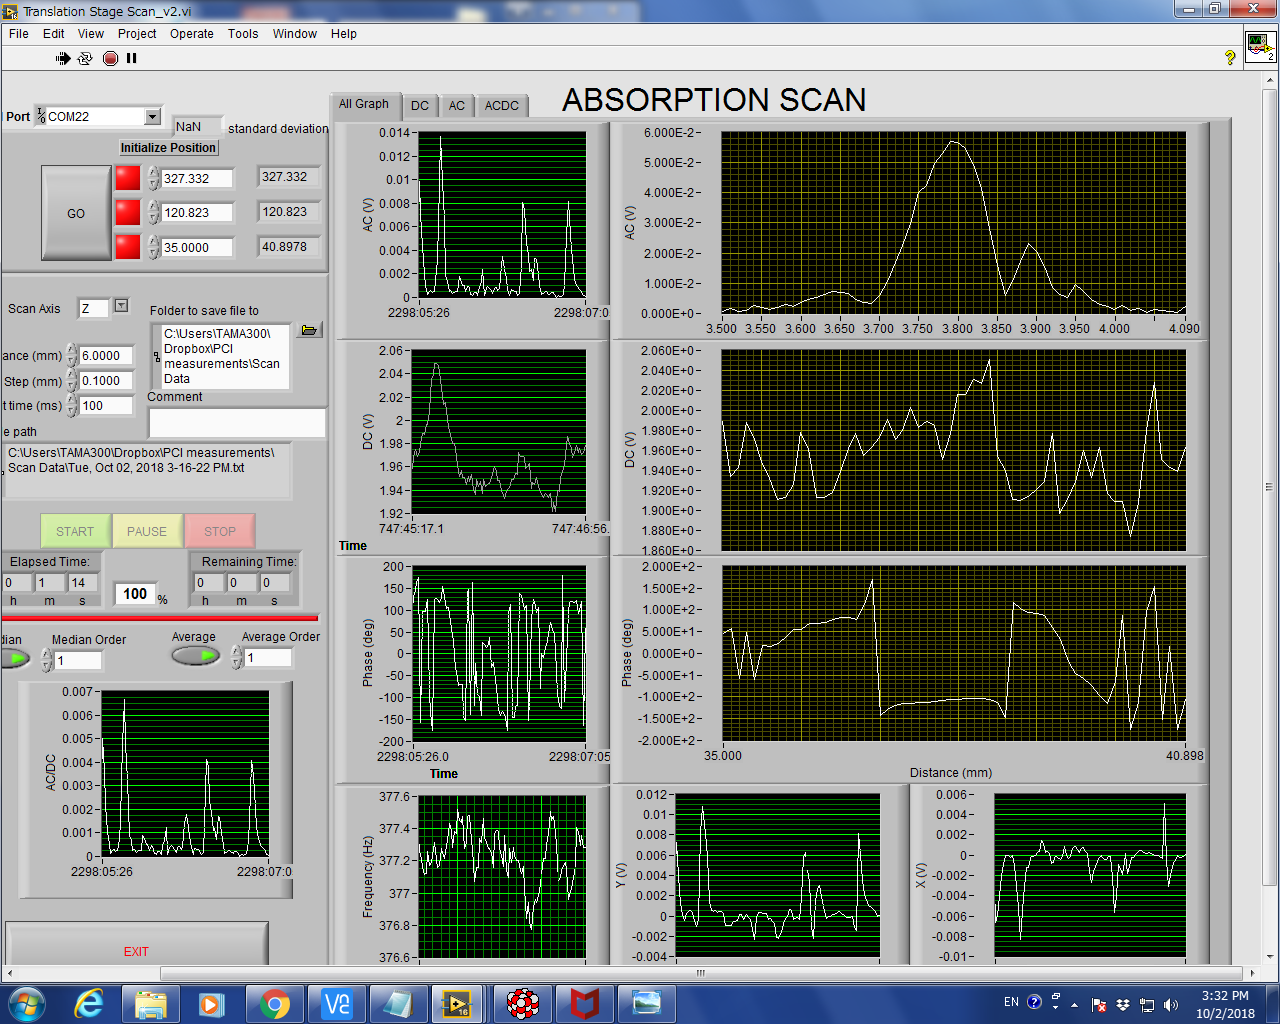
NAOJ GW Elog Logbook 3.2

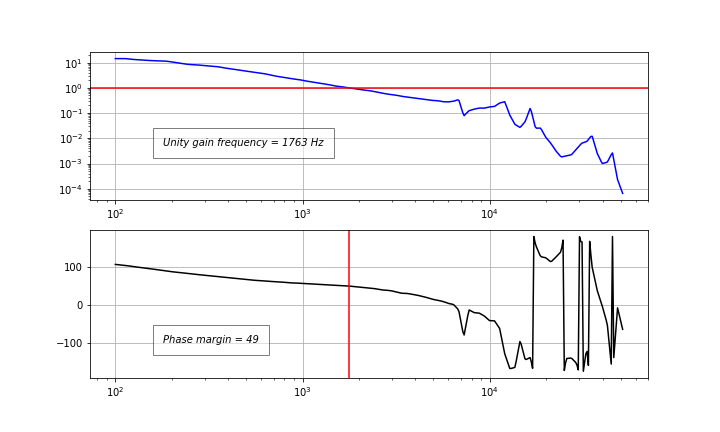
Actually this work started around two months ago. At the beginging, we tried to fit the original data by using poles, zeros and q. At that time, we tried to use the virgo toolbox based on matlab and got some fine results. We also tried to use LISO to do this fit.
However, for our filter design for GRMC, it is not so necessary. So I use the data we took and change it back to imaginary number and then implent zpk filters to it. Finally, by using a first order low pass filter with a coner frequency of 500Hz. And a intergrator of 30Hz(pole) and 1000Hz(zero). And the gain of 2. I got a positive result wihch is shown as attached file. I also attach the python file as attached.

- The width at half maximum of the surface reference scan is 0.65mm, same as the SPTS company.
-
I measured the phase of the pump (temporarily removing the filters from the PD). It is -22deg.
This means that for the surface reference, the calibrated phase is -81.5-(-22)=-59.5deg. Same as the SPTS company (-60deg).
The calibrated phase for the bulk reference is -93.5-(-22)=-71.5deg. Somewhat different but similar to the SPTS company (-66deg). - The surface calibration factor (from entry 973) is R=19 W-1, about 10% higher than the SPTS company (16.9 W-1).
- So I measured the transmission of the sapphire. with a power meter T_sapp = 0.86
- I already measured the transmission of the bulk reference sample in entry 990. T_bulk = 0.55
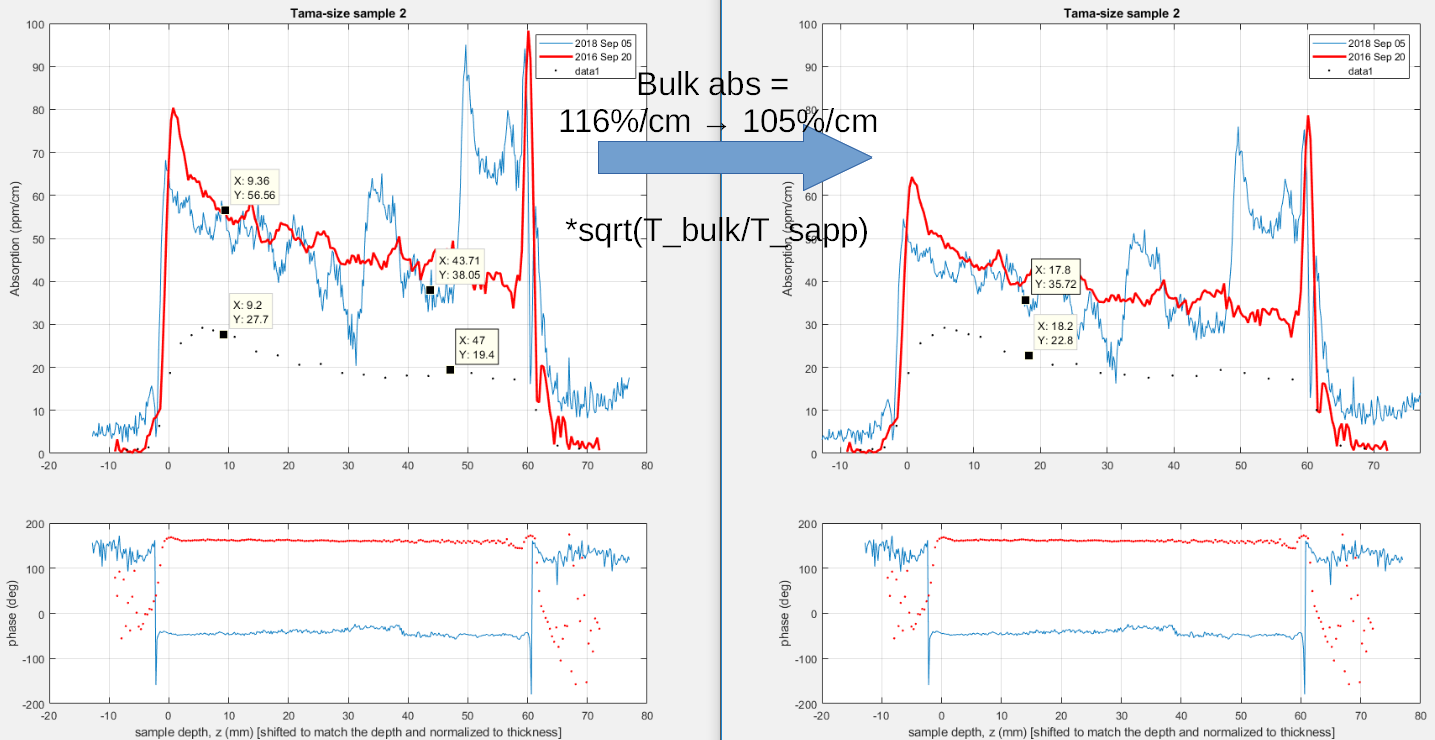
- As absorption value of the bulk reference sample, instead of the nominal value from SPTS, I should use the one I measured with the power meter (entry 990) Abs = 105%/cm
- Using the incident power P_ref=32mW, now the correct calibration factor for bulk is R = AC/DC / ( P_ref*sqrt(T_bulk) * 1.05 ) = 0.78 cm/W
Summary:
- changing the reference absorption value from 116%/cm to 105%/cm reduced the absorption value by 10%
- correcting the power with the transmission coefficient reduced the absorption value of 20% because sqrt(T_bulk/T_sapp)=0.8
So the ratio between my measurement and LMA measurement on the Tama-size sample2 (comparison in entry 984) passed from a factor of about 2 to a factor of about 1.5-1.7
Last week, we put some beam dumpers for auxiliary paths. However there is still some parts are not dumped while the main threat has been dumped.
I tried to disconnect the cable (the signal from the PD) from the spectrum analyzer and the sr560.
The noise is still around 10'000ppm. So the noise doesn't come from some ground loops.
Then I changed the current of the laser diode and rotated the HWP to keep the DC at around 2V, but the noise didn't reduce a lot (still around 7000ppm)
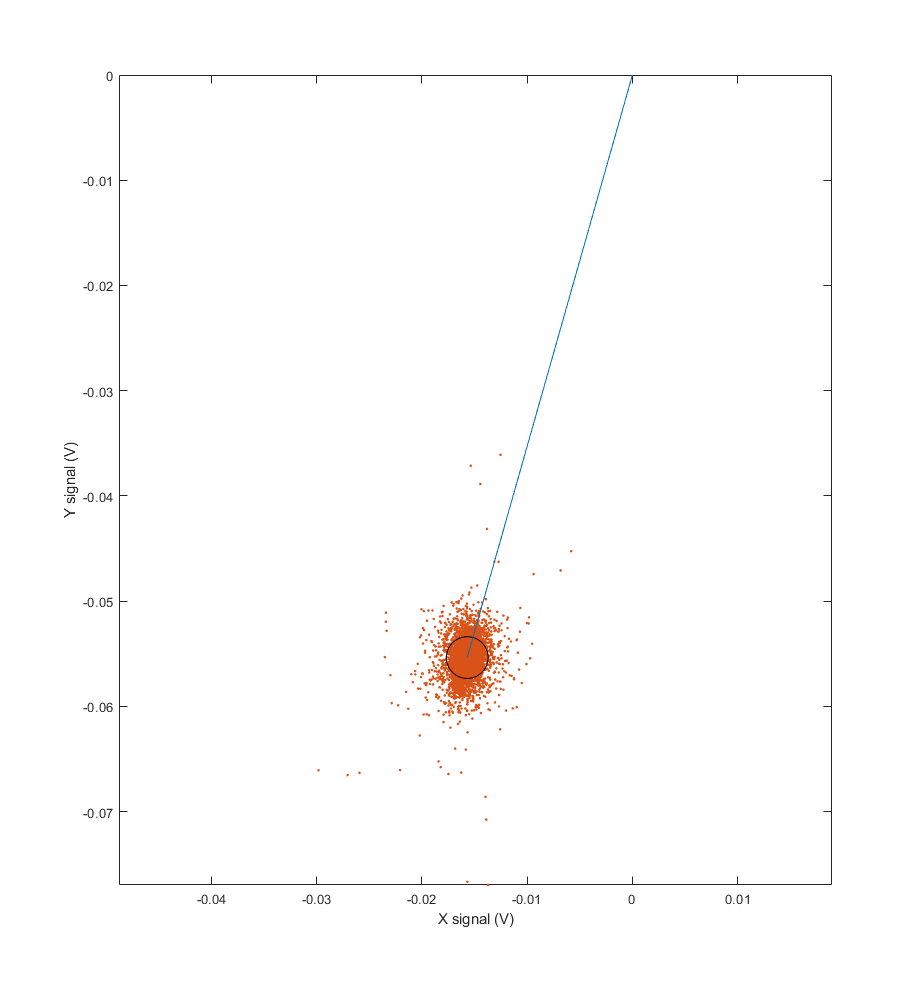
Then I replaced the QWP with a PBS to clean the polarization and the noise reduced by a factor of 10
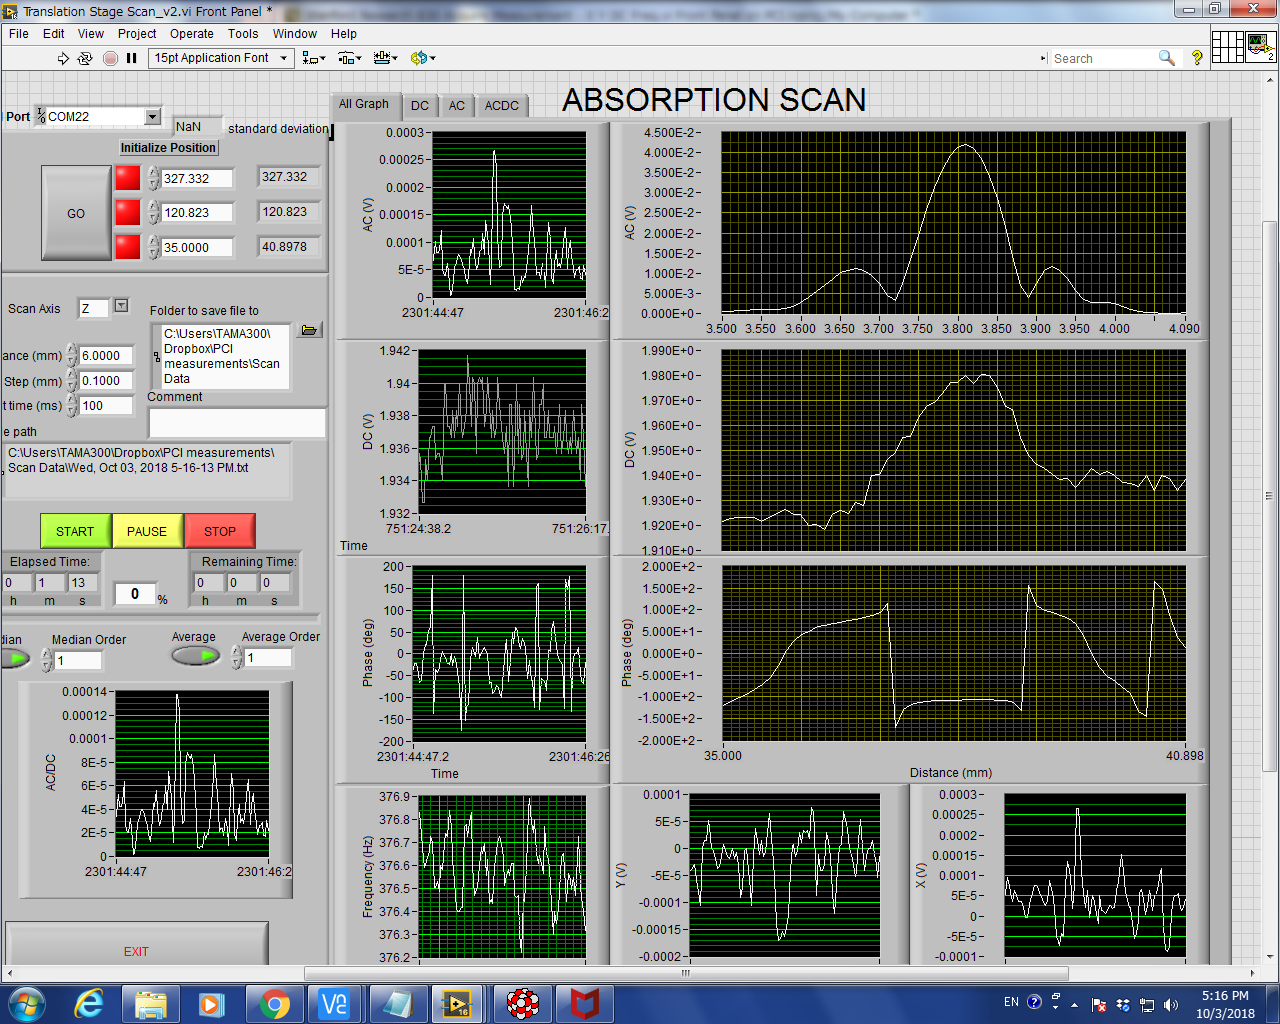
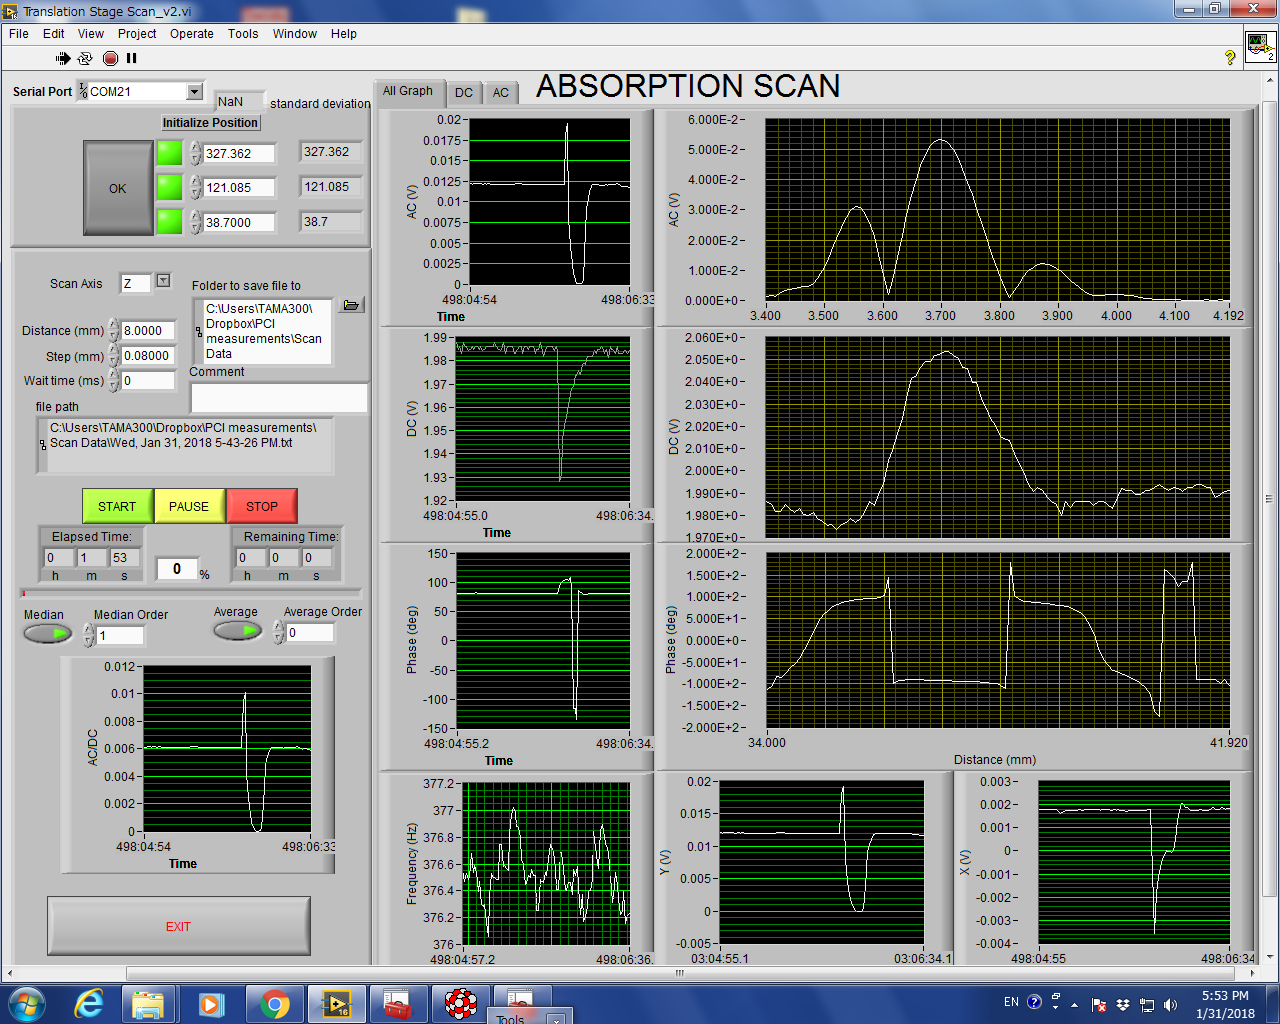
The alignment changed a bit after replacing the QWP. So the screenshot shows the new calibration scan. The AC signal went from 57mV to 45mV.
Now the noise is around 950ppm. See plot
previous crossing point pinhole position
X 327.432
Y 121.255
Z 34.9000
Z 38.85
I tried to disconnect the cable (the signal from the PD) from the spectrum analyzer and the sr560.
The noise is still around 10'000ppm. So the noise doesn't come from some ground loops.
Then I changed the current of the laser diode and rotated the HWP to keep the DC at around 2V, but the noise didn't reduce a lot (still around 7000ppm)
Then I replaced the QWP with a PBS to clean the polarization and the noise reduced by a factor of 10
The alignment changed a bit after replacing the QWP. So the screenshot shows the new calibration scan. The AC signal went from 57mV to 45mV.
Now the noise is around 950ppm. See plot
[Yuhang, Eleonora]
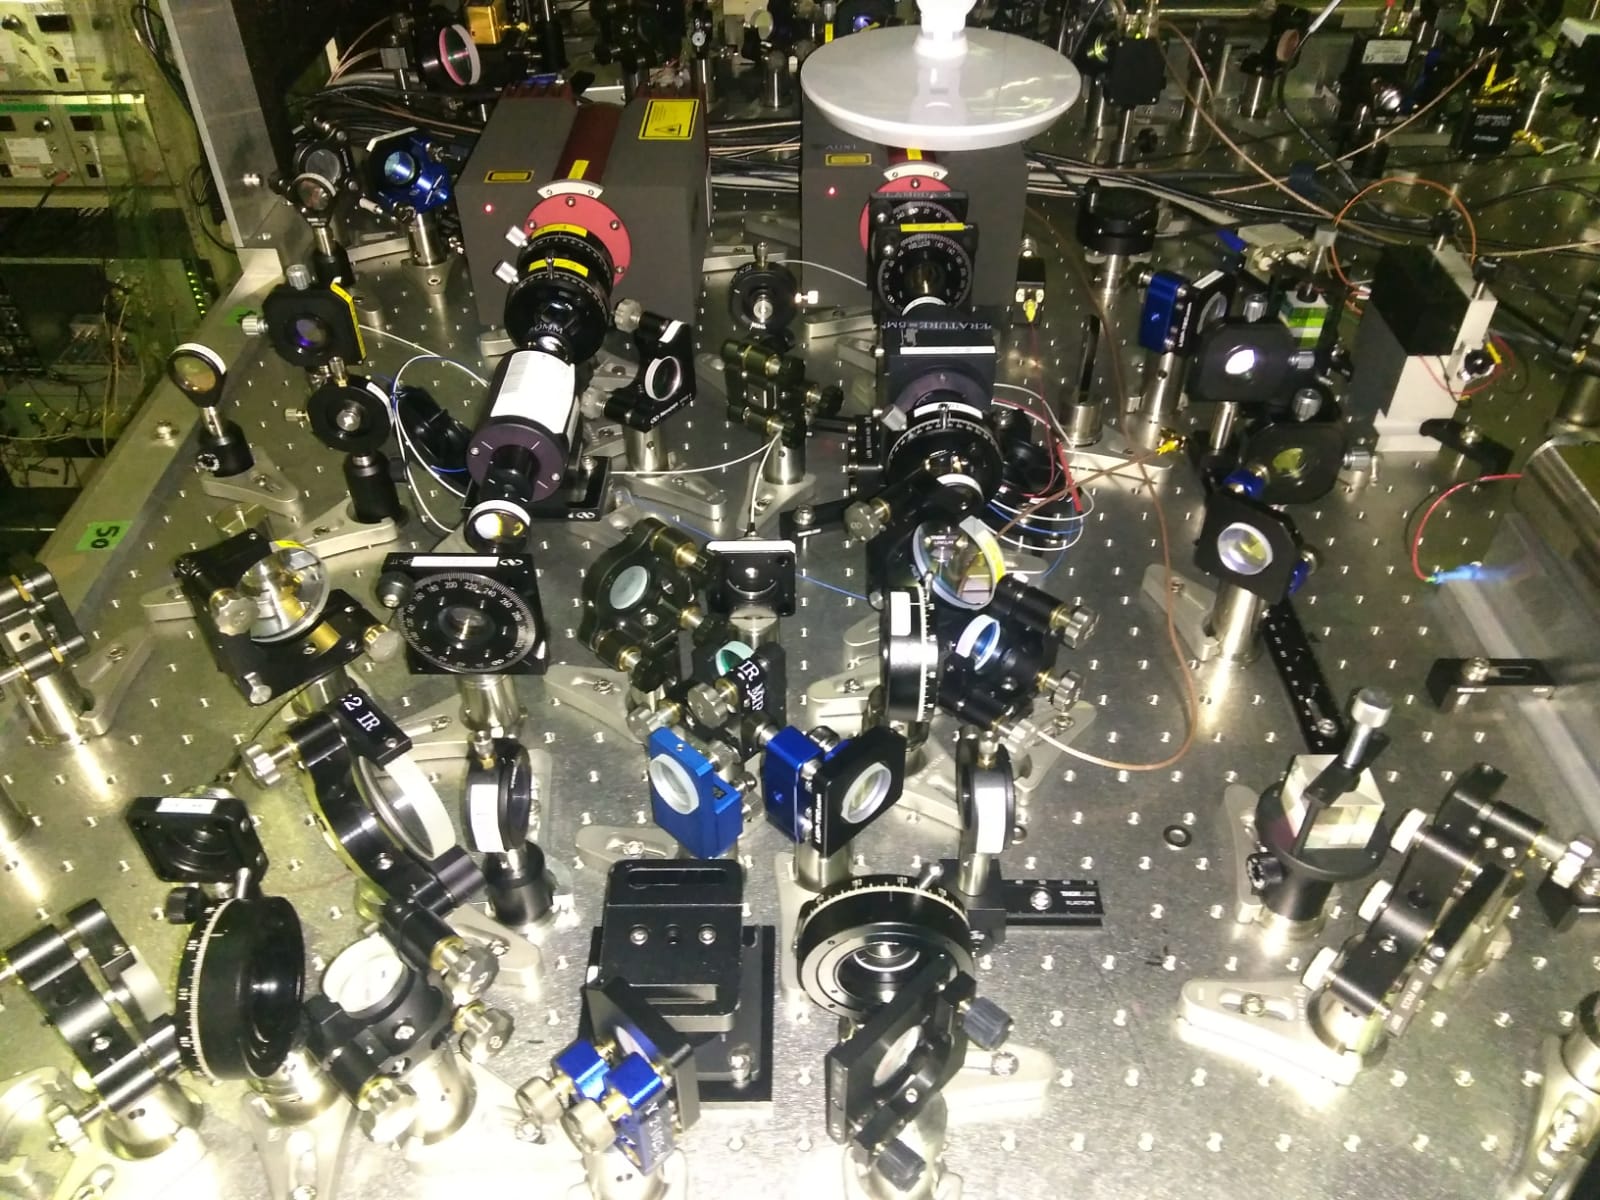
We designed and implemented a new telescope for the EOM. The goal was to increase the allowed power of the p-pol beam and find a reasonable PDH signal.
We followed the recomandation of the seller from Qubig which suggests to use a beam of 1 mm diameter inside the EOM (the crystal side is 3mm).
As input, we have a collimated beam ( 2 mm diameter) and we want to recover a beam with this same size after the EOM, before it recombines with the s-pol beam. In order to do so, we have simply put two lenses with f = 200 mm at a distance of 40 cm from each other and place the EOM at a distance of about 10cm from the first lens, where the beam diamater is between 1 mm and 0.7 mm (see Fig1, 2 and the updated the optical layout in the wiki)
For our laser power, that is 170 mW, the power density (considering diameter of 0.7mm) is about 1W/mm^2 which is less than the treshold of the EOM (10W/mm^2).
We have installed all the optics (except for the EOM which is not yet back) and aligned and matched the beam into the OPO. In parallel we have also recovered the alignment of the s-pol beam.
Pic 3,4,5 show respectively the OPO optical spectum with p-pole beam, s-pole beam and both beams. The heighest HOM are LG modes wich are not easy to get rid of. Anway the final aligment will be done once we have also the EOM.
We repeted the transmissivity measurement.
| input power | transmitted power | Transmissivity | |
| S- POL | 188mW | 400 uW | 0.18% |
| P- POL | 135mW | 244 uW | 0.21% |
Some comments:
1) Since we cannot lock the OPO, in order to make the mesurement, we manually adjust the piezo offset to bring the cavity on the top of the TEM00 resonance, this can affect the precison of the measurament
2) The nominal trasmissivity shoud be 1%, while we found a value that is 5 times smaller. Note that the matching (in particular for the p-pol) is not optimal.
Conclusion: The new design of the EOM telescope seems fine and in this new configuration we should be able to increase the power on the p-pol and get a detectable PDH error signal for the OPO.
[Yuhang, Eleonora]
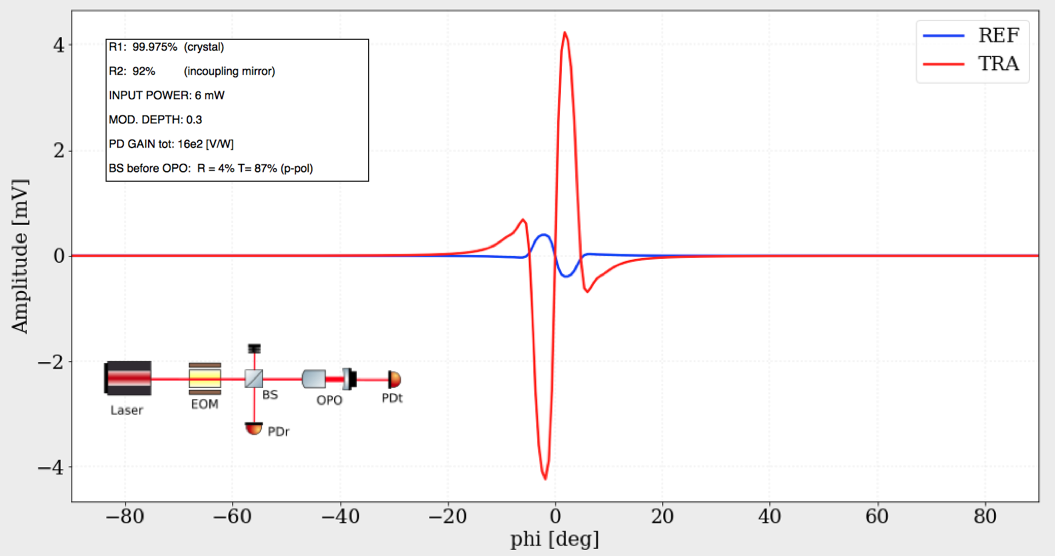
While waiting for the quibig EOM to be repaired, we have tried to estimate the ampituede of the PDH signal expected both in reflection and trasmission of the OPO.
We used the following paramenters:
R1: 99.975% (crystal)
R2: 92% (incoupling mirror)
INPUT POWER: 6 mW
MOD. DEPTH: 0.3
PD GAIN tot: 16e2 [V/W] (photosensitivity at 1064: 0.1 [A/W], amplification:16e3 [V/A])
BS before OPO: R = 4% T= 87% (p-pol)
We did a simulation with Finesse (see attached plot) and confirm it with analytical computation. (We will upload the code on the wiki )
Conclusions:
1) The PDH signal is larger in transmission (due to the fact that in this configuration the cavity is undercoupled)
2) The PDH signal is anyway very small (less than 10 mV pp) with the current values.
It is for sure convenient to lock the cavity in transmission (as done in Virgo1500 and GEO) but we should also consider how to increse the signal. Some possibilities:
1) Increase the input power (change EOM telescope to increase allowed power? How much power is used in GEO and Virgo?)
2) Increase the PD gain (the current one has low photosensitivity for IR)
3) Increase the modulation depth (is it feasable?)
Note that the simulation has been done considering nominal reflectivity values for OPO but we observed that the transmission is lower than expected (0.18% instead of 1%), this may result in a discrepancy between the simulation and the real signal.
[Yuhang, Eleonora]
We have locked the infrared mode cleaner.
Some details:
1) P_in = 10mW P_tra = 7.5mW => Transmissvity: 75% less then expected (90%) but enough for the homodine detection.
2) we locked it in reflection using a TAMA PD. See attached pic 1 and 2.
3) Since we use 15 MHz sidebands (same EOM as SHG) we could use TAMA demodulation board
4) We use a SR560 as temporary servo (1st order low pass, cut of frequency at 3 Hz, gain 10 after lock is engaged and 1 to acquire it)
5) An attenuation of 40 dB had to be put on the demodulated signal before the SR560, in order to avoid overload and be able to acquire the lock.
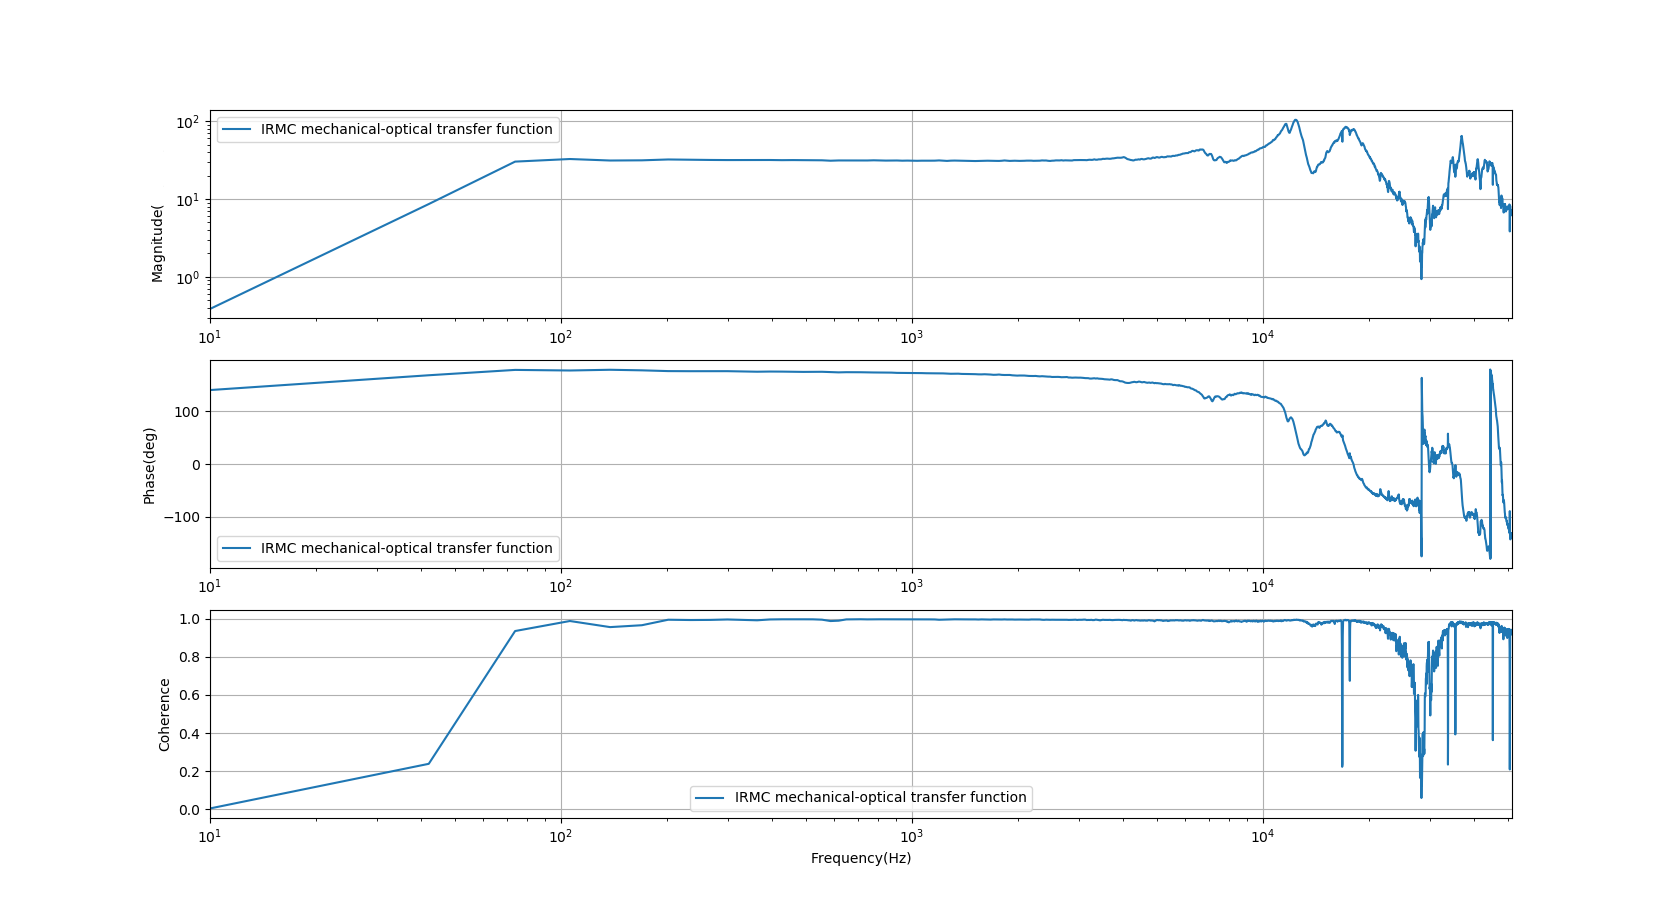
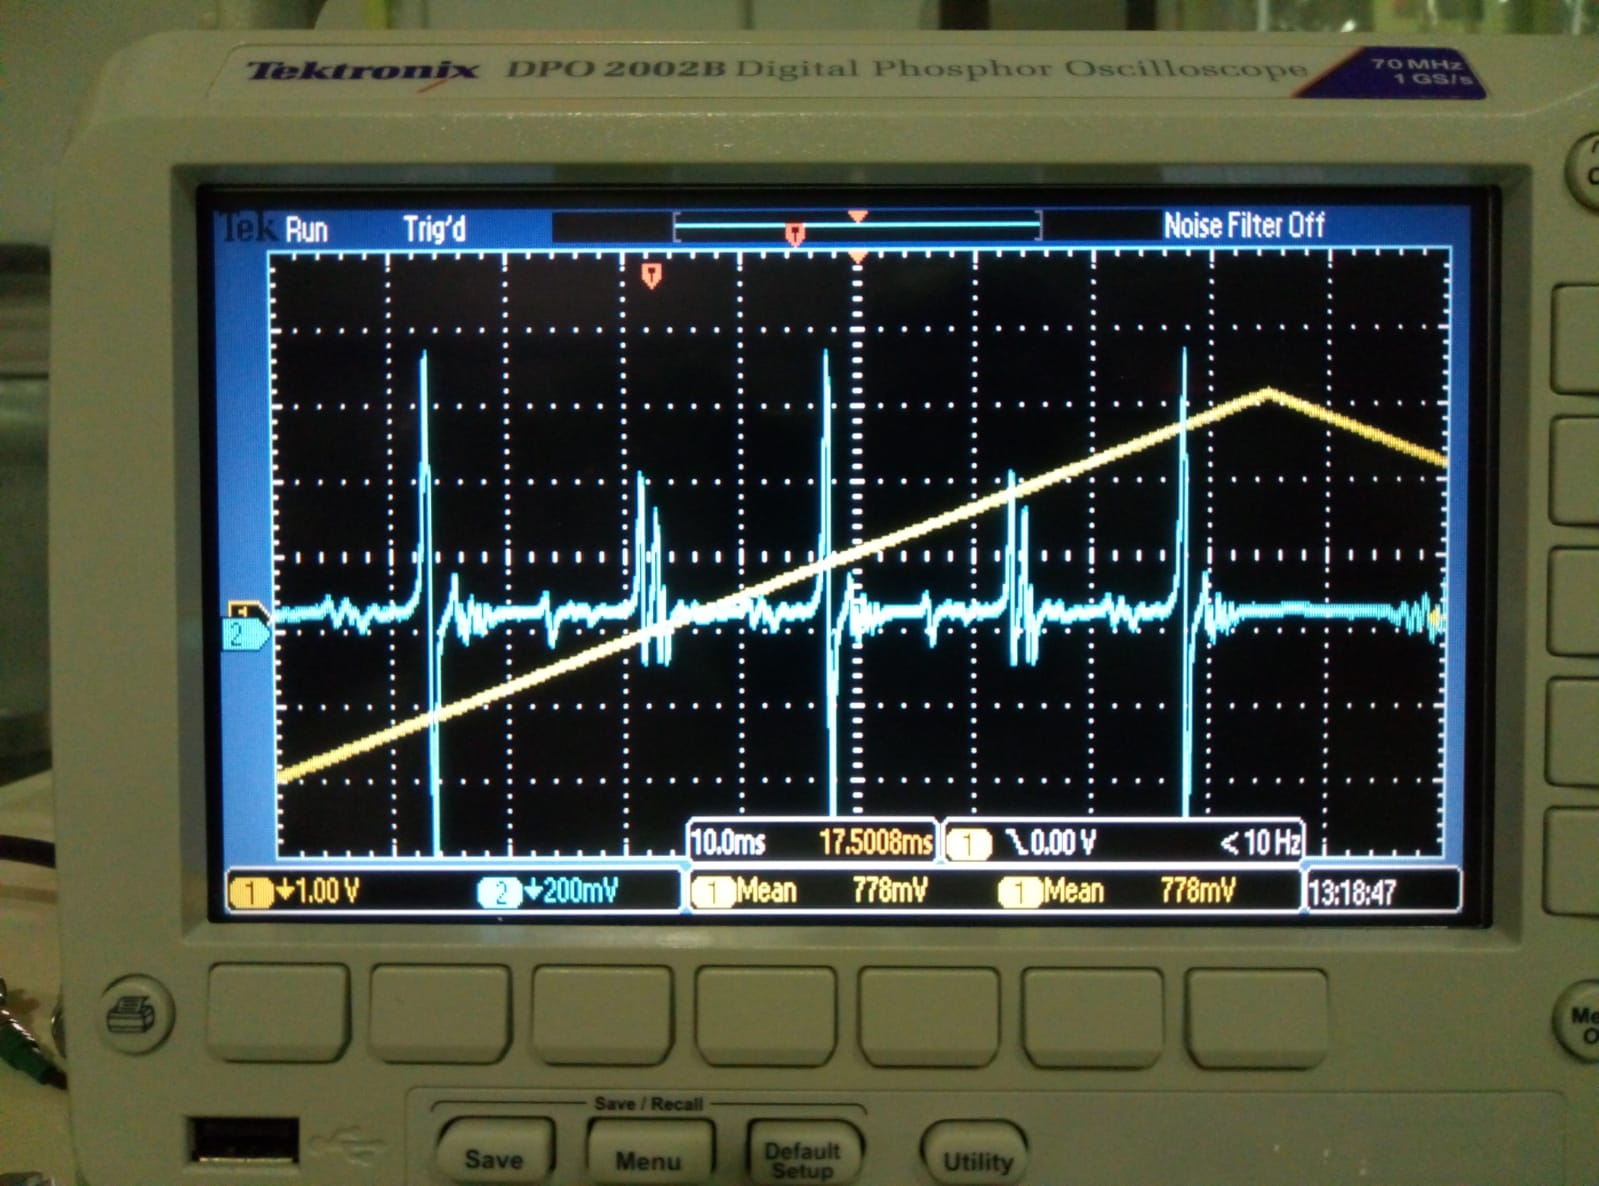
6) We measured the optical-mechanical TF (cavity + piezo). See attached plot (Fig 3). It Note that the high pass filter to compensate the low pass of the piezo driver has not be used.
We have uploaded the data and the plot on the TFs wiki section.
I did some simulation of the green reflection path from the filter cavity input mirror. The detail is in the attached file.
1. I clean up the IRMC, fortunatly, the dirty is outside so we can clean it.
2. For the RF signal, I used the TAMA PD which was used for FC reflection.
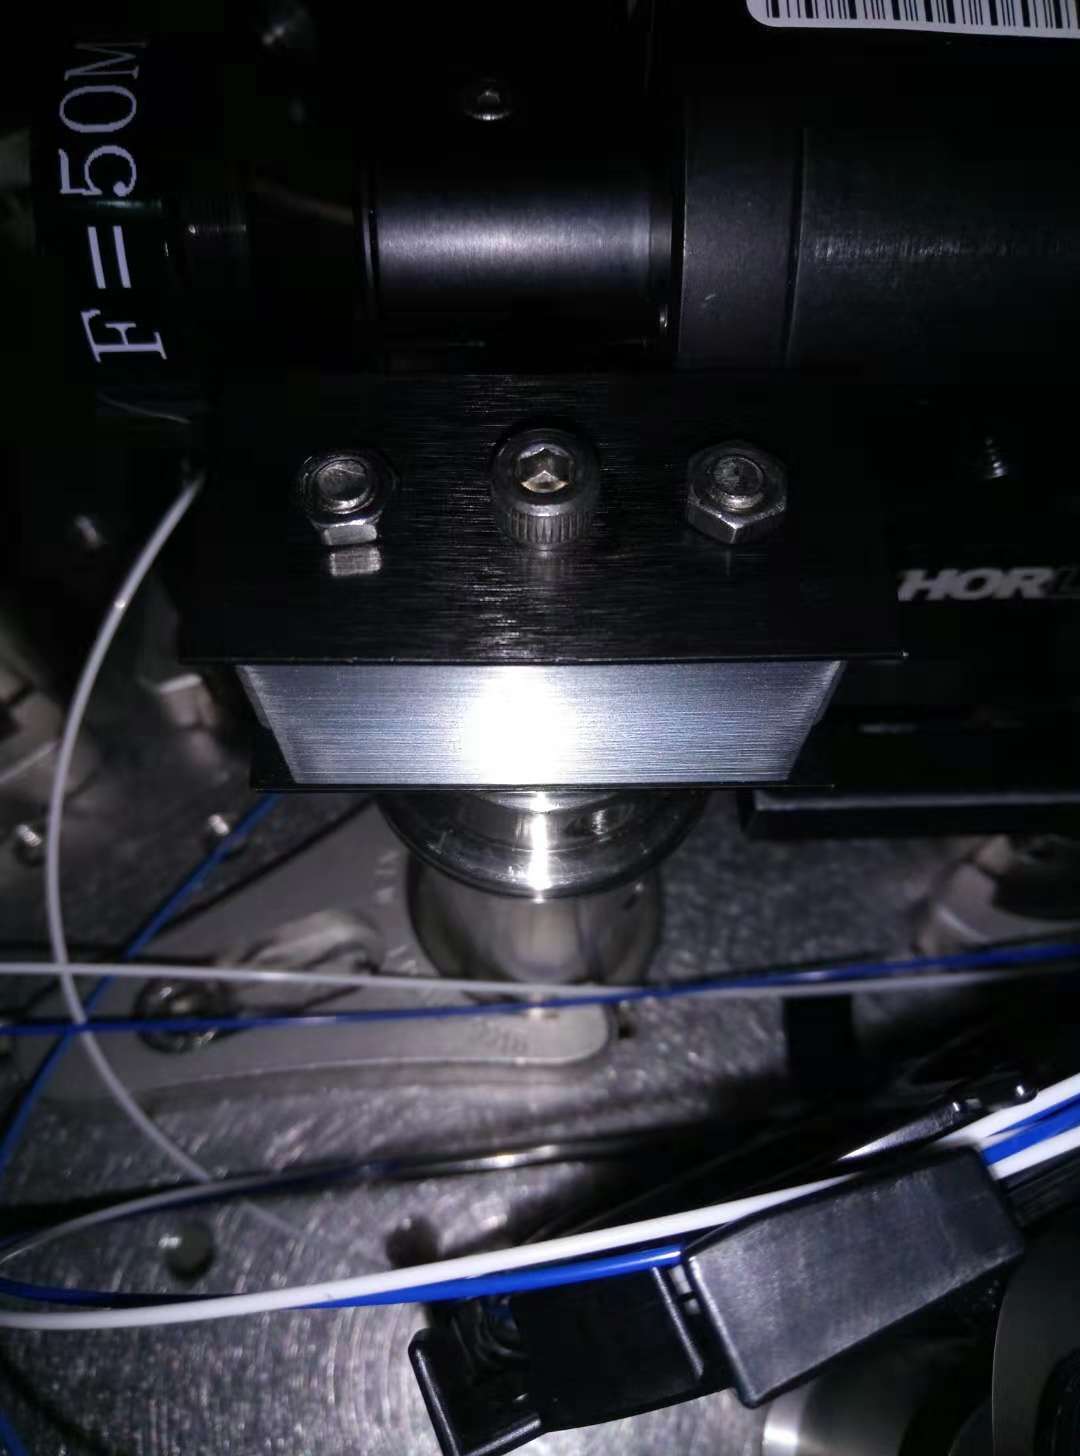
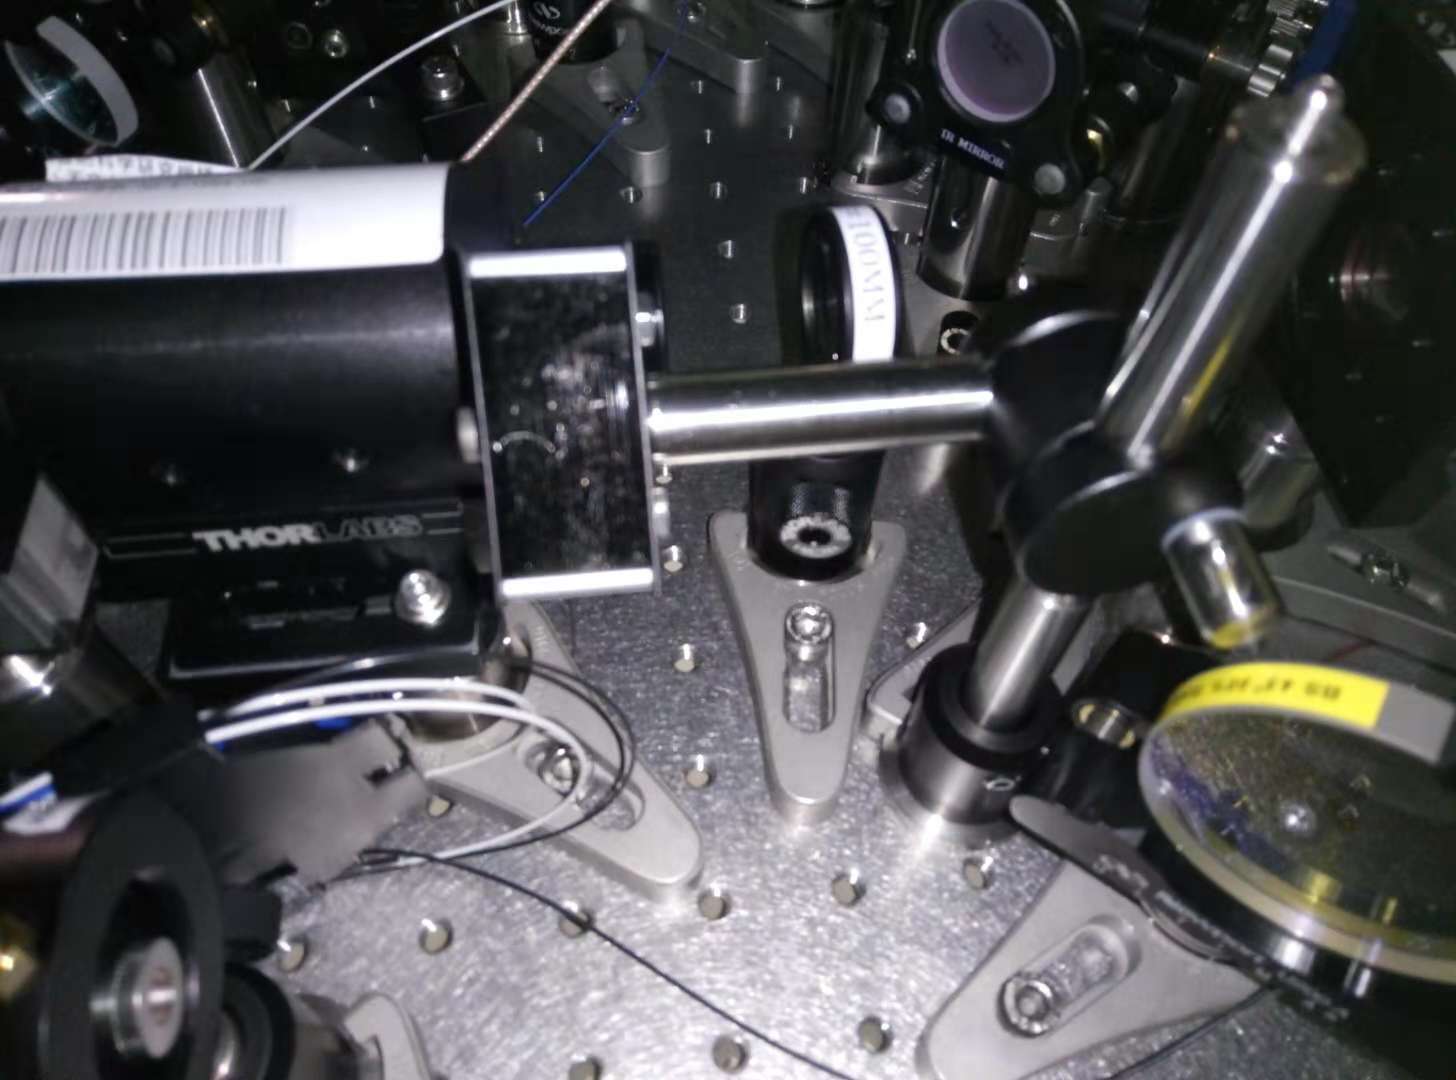
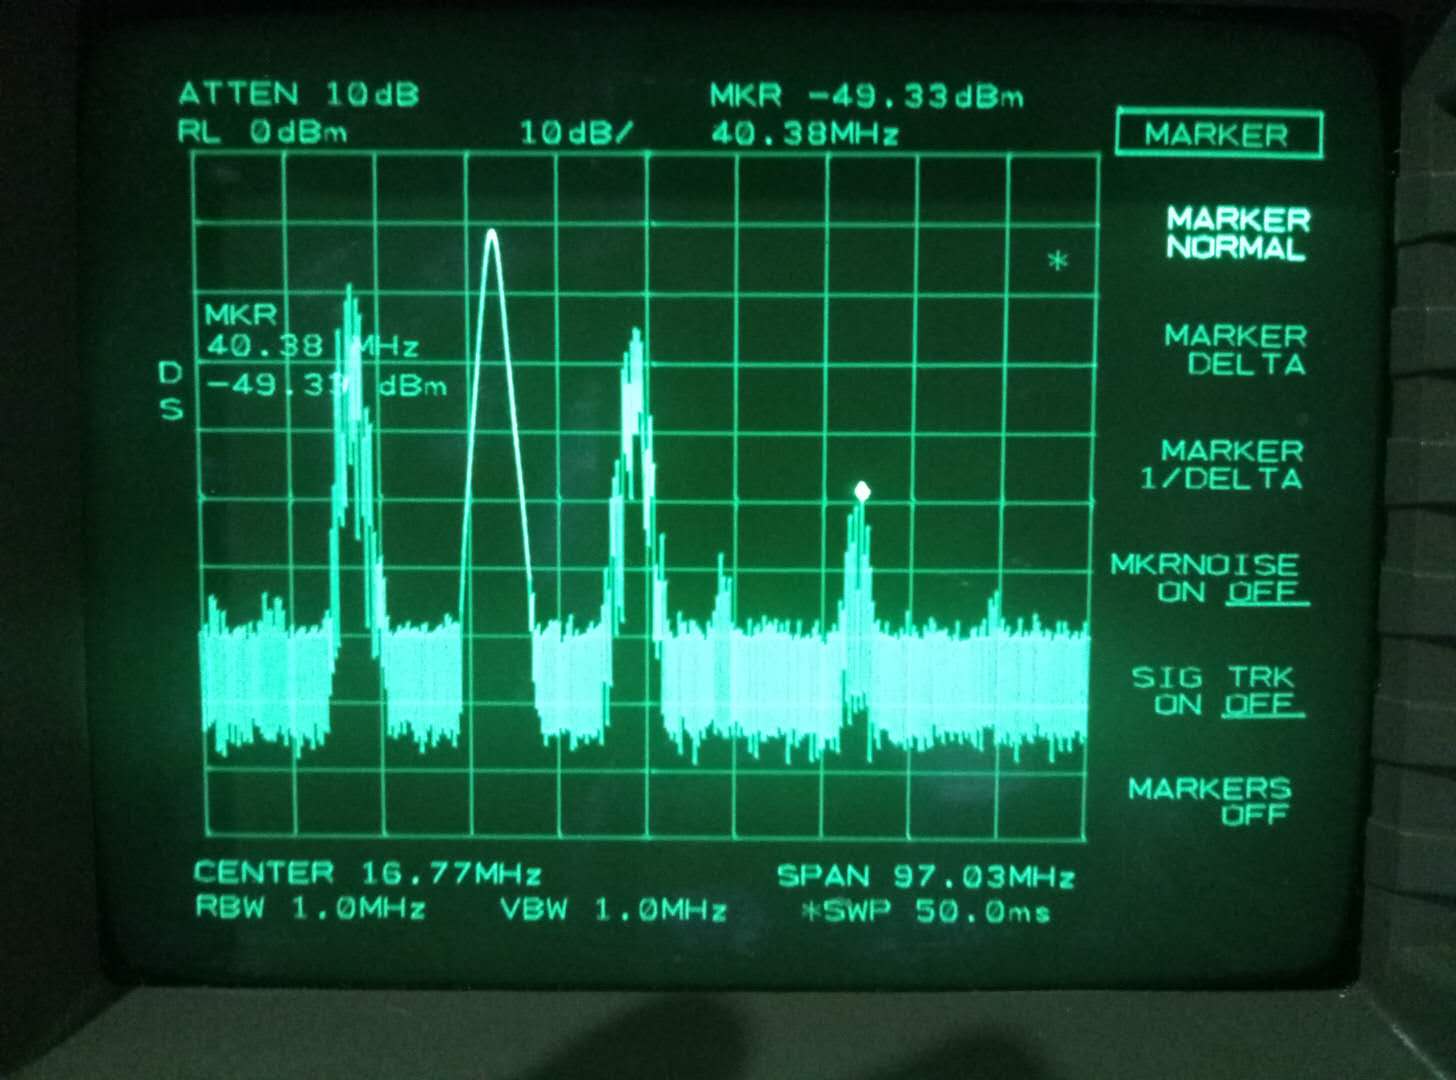
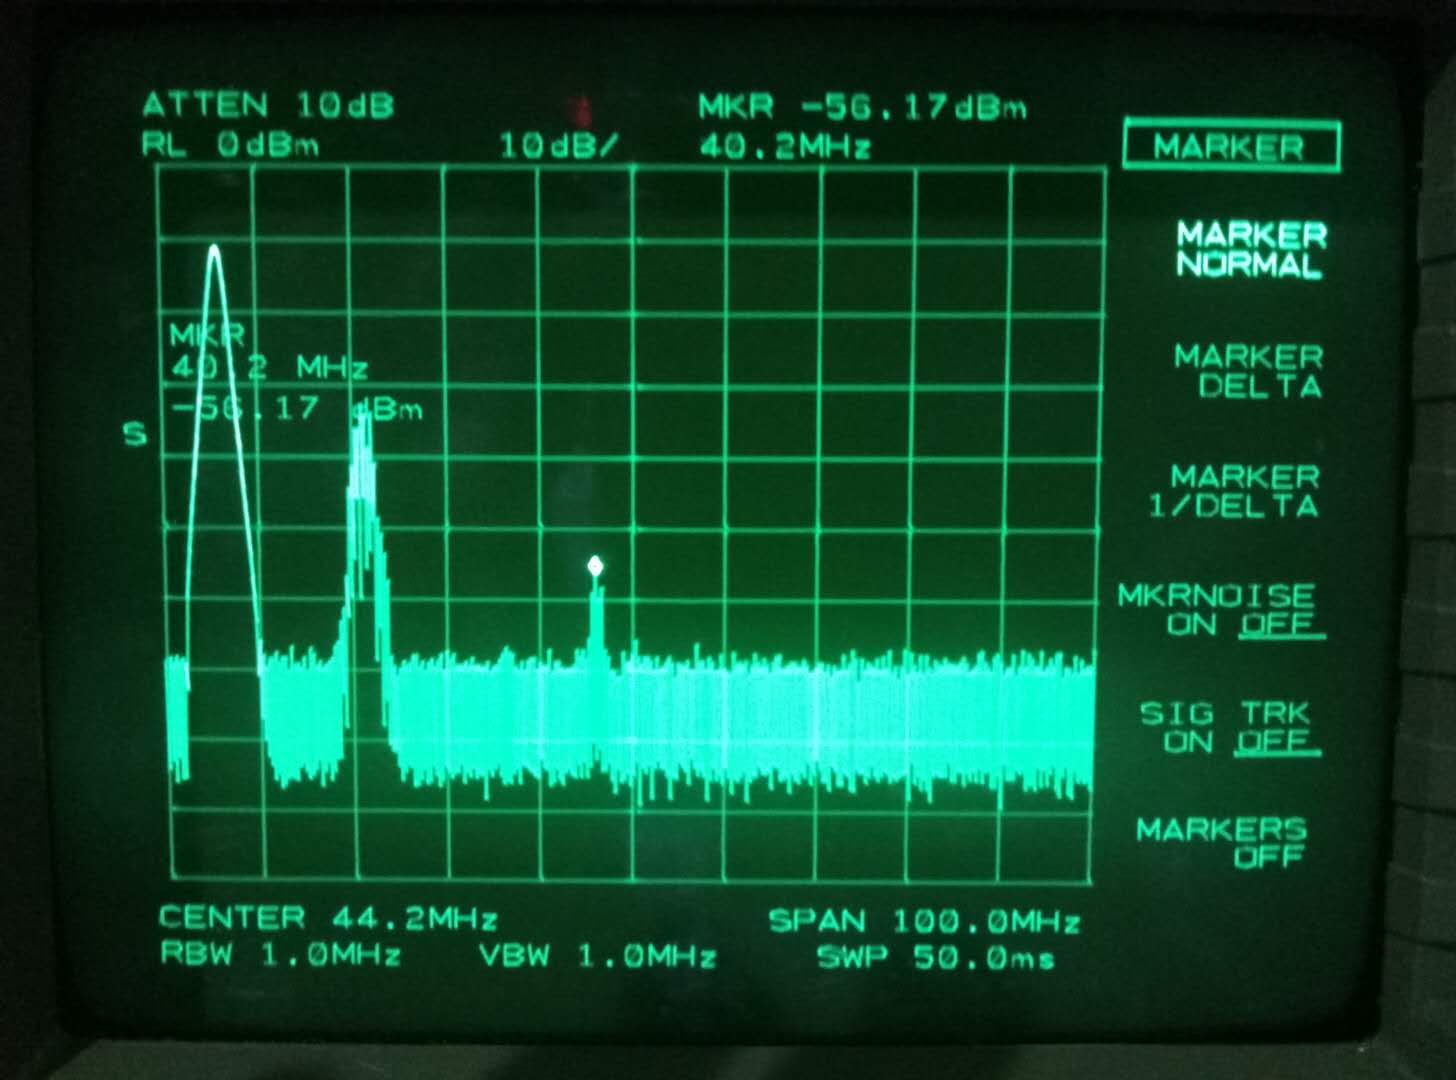
3. Since we found that we cannot see the modulation produced by OPO EOM, we decided to test this EOM. This EOM is from TAMA(length = 5.5cm, Diameter = 3mm, power density = 4W/mm2, resonant frequency = 40MHz). Since I have already had a good alignment for IRMC, I didn't want to destory it. I just want to add lenses and then put EOM. Besides, I have a lot of space to put lenses and make the beam smaller than 500um of radius with a range larger than 5.5cm. So I don't want to care a lot about mode matching. Note here, the mode matching affected by additional lenses and EOM. Besides, we can compare the 15MHz sideband's power to know how different interference affect the sideband power. Because we know the power of 15MHz sideband before puting the additional lenses as a reference. The set-up of this test is attached as Fig.1. (Note here the beam power is 10mW, even for the concentrated beam, power density is 1.8W/mm2)
For the test of EOM of collimated beam inside, the 15 MHz sideband power is around -26dBm. The 40MHz is around -49dBm. (see attached Fig.2)
For the test of EOM of concentrated beam inside, the 15MHz sideband power is around -32dBm. The 40MHz is around -56dBm. (see attached Fig.3)
Here the 15 and 40MHz sideband disappeared after I blocked the beam.
From these two results, we found although the 40MHz sideband power decreases, it seems come from the worse interference(worse interference verfied by 15MHz reference). (See attached Fig.4 for bad interference)
So the conclusion is: The TAMA EOM works well and the collimation of beam doesn't matter.
-----------------------------------------------------------
15MHz sideband comes from the TAMA EOM, which is just after the main laser and before the first BS on the bench.
A very unfortunate possible explanation of the calibration problem could be a double mistake on the true absorption value bulk reference sample from the company. The Schott glass #12.
So I measured it again with a laser and a power meter.
Incident power = 76.7 mW
Transmitted power = 42.5 mW 55%
Reflected power = 5.5 mW 7.2%
Therefore the absorbed portion is 37.8%
The absorption rate 37.8% / 0.36cm = 105%/cm
This confirms the measurement done 3 years ago by Tatsumi-san elog entry 88
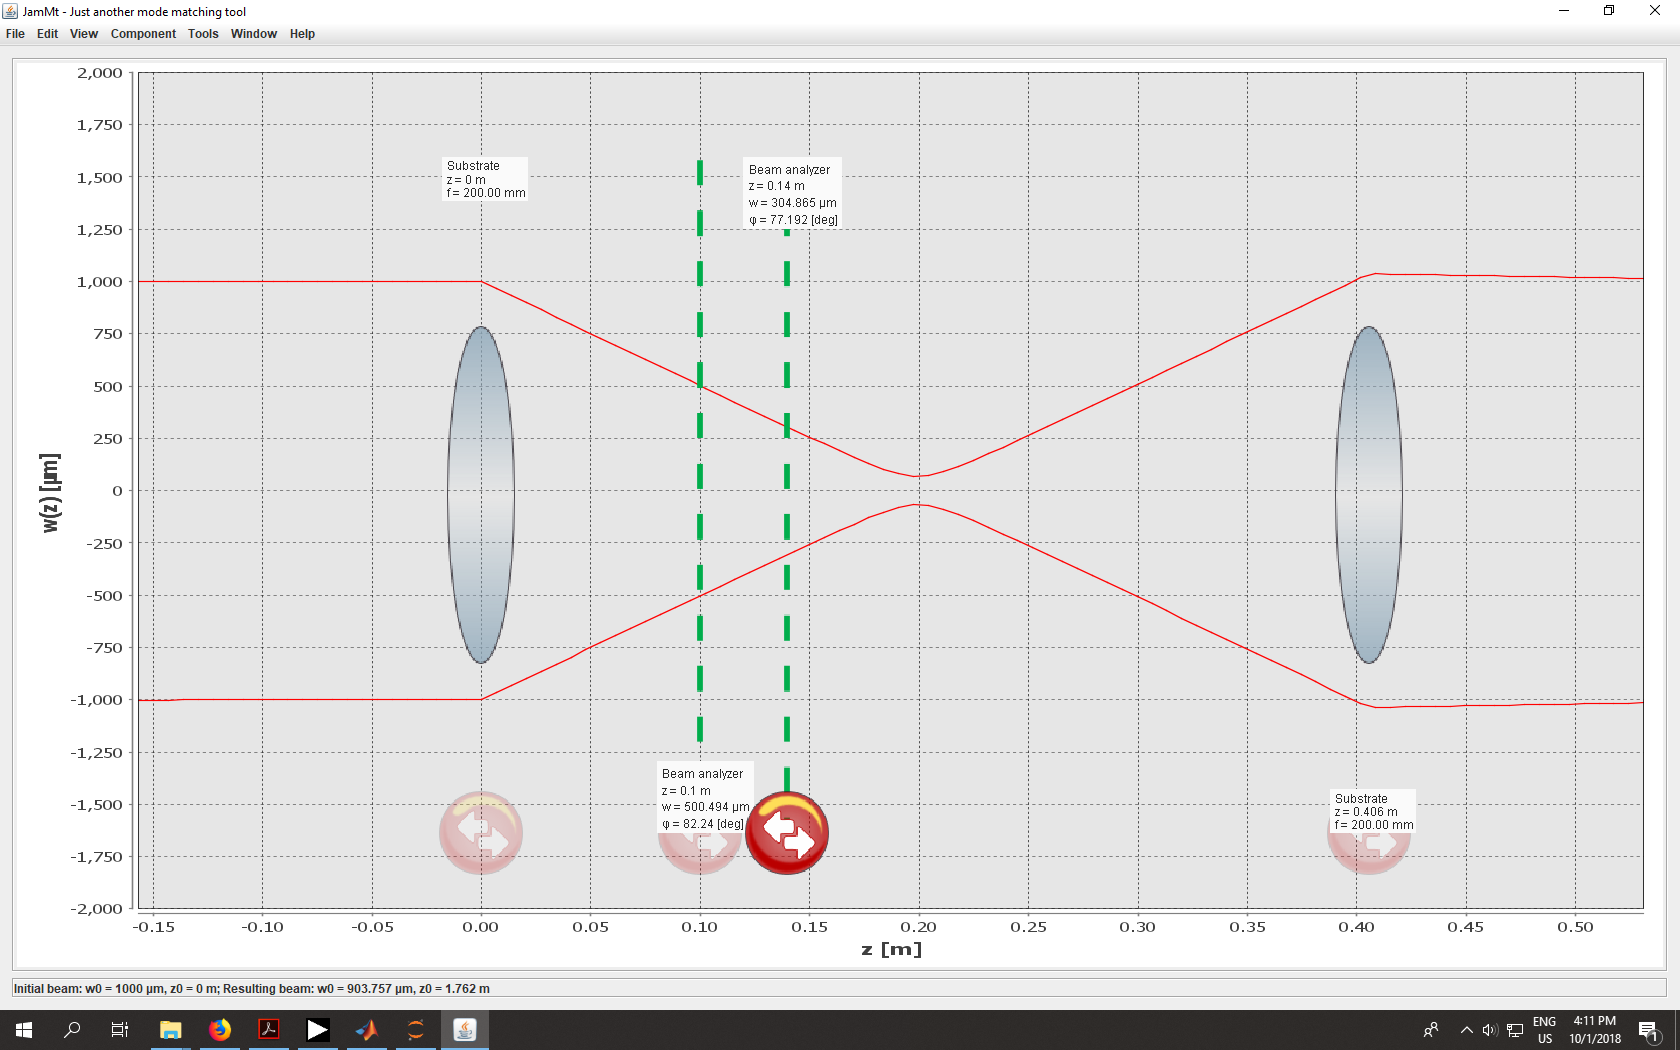
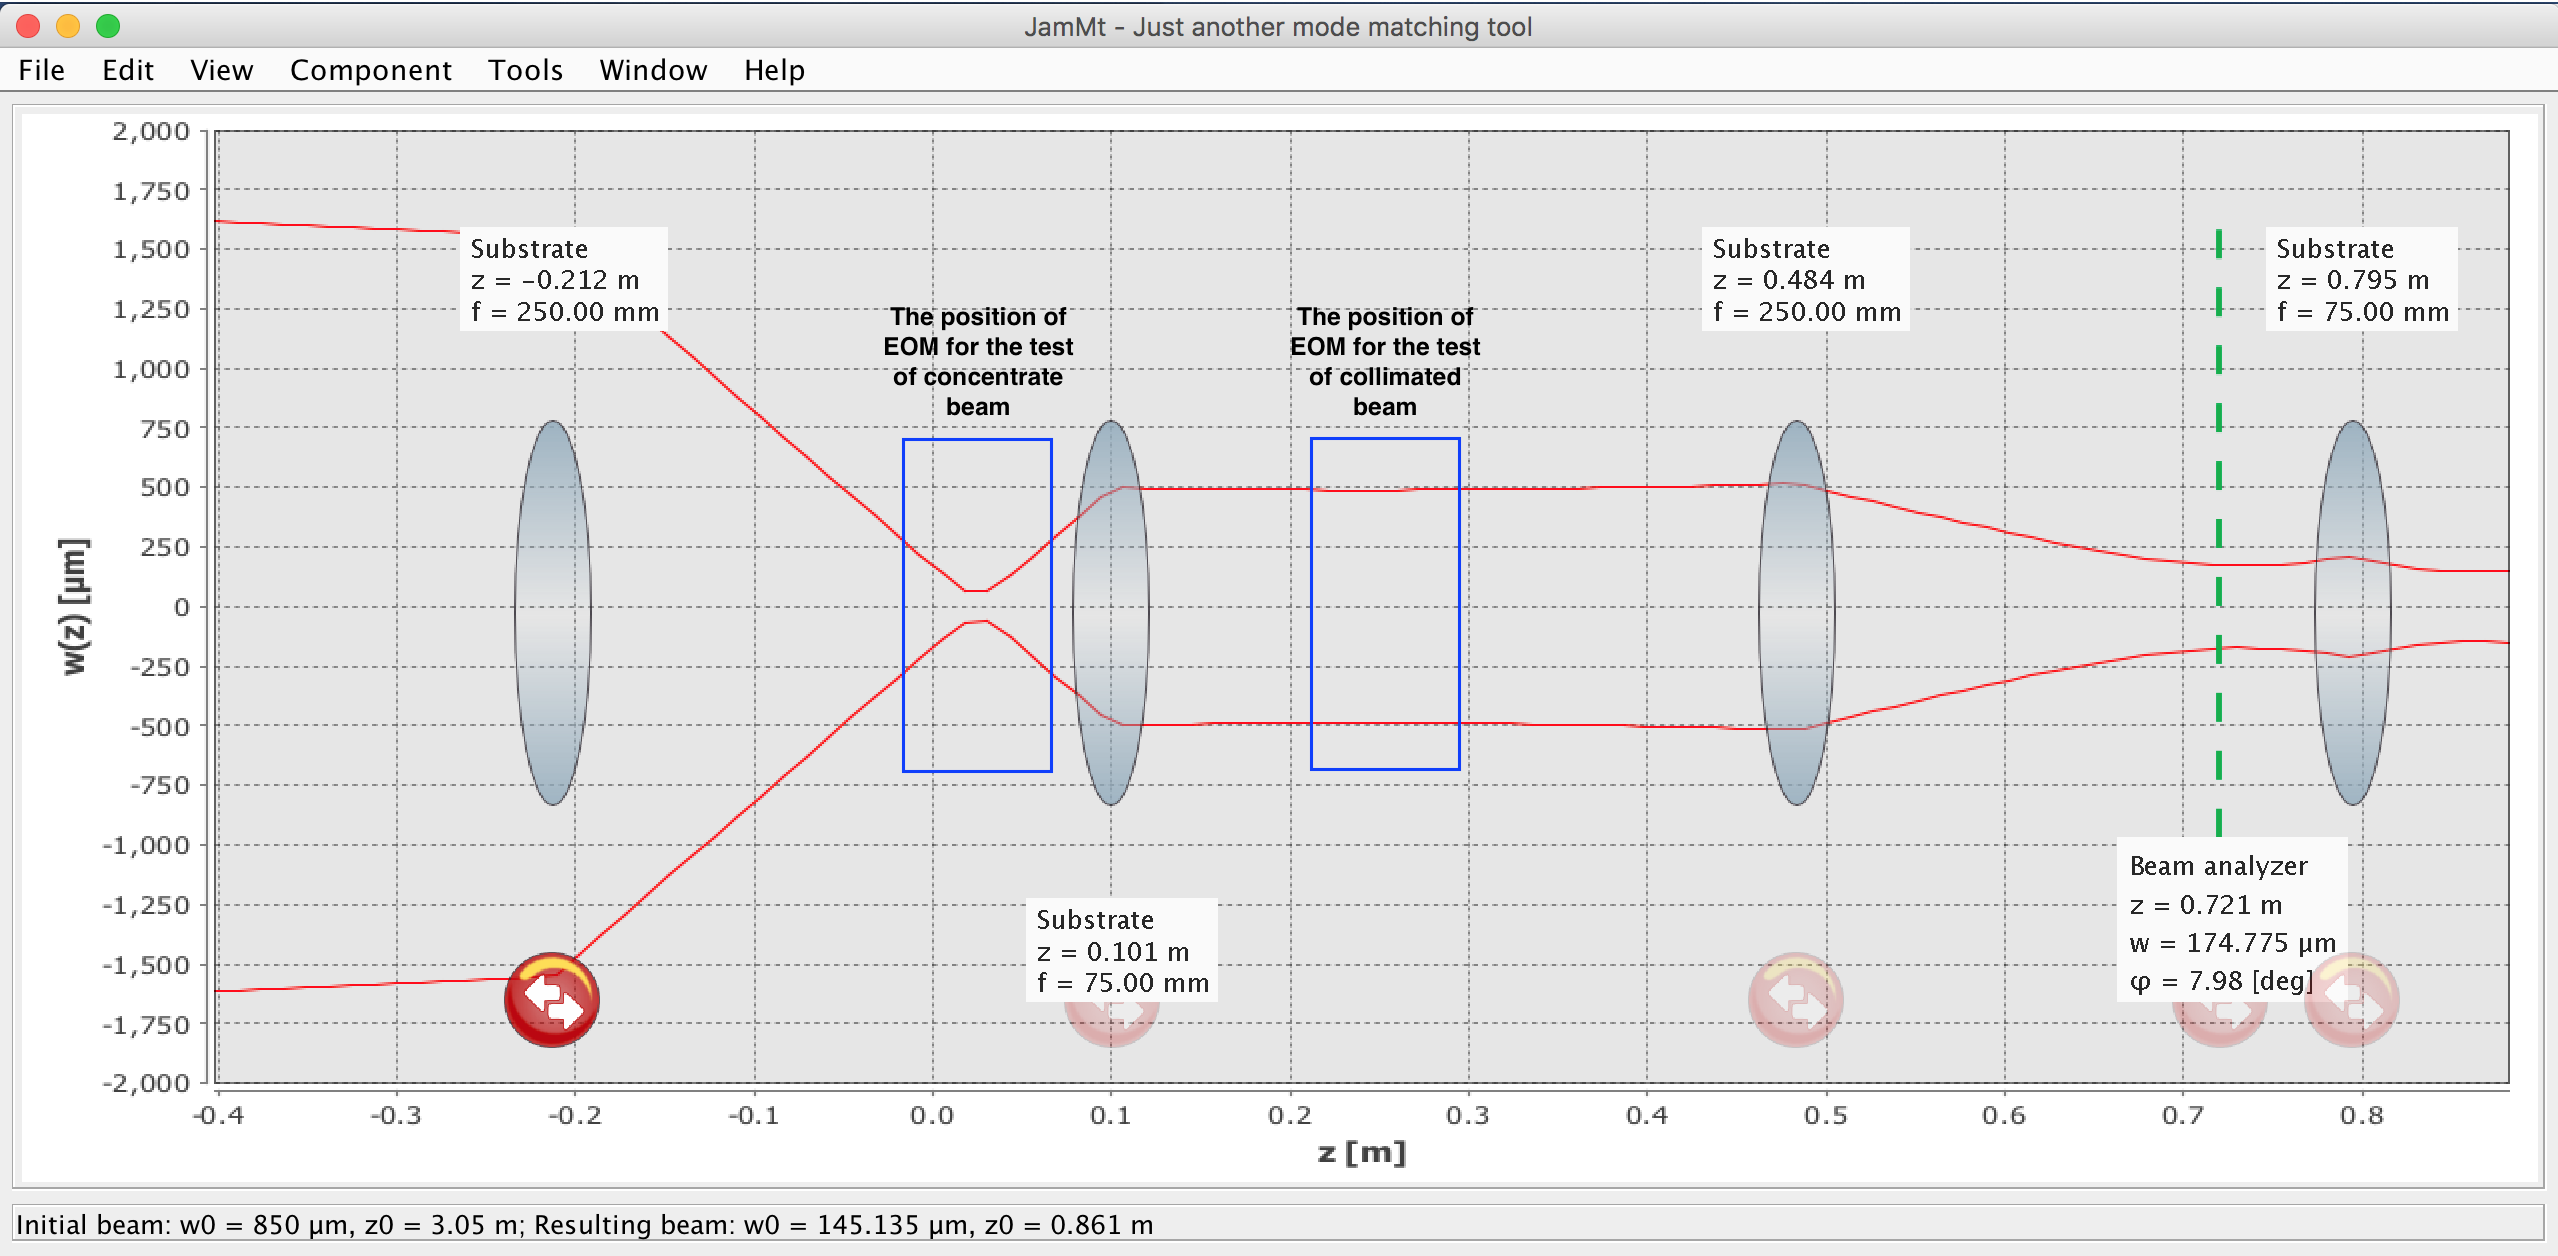
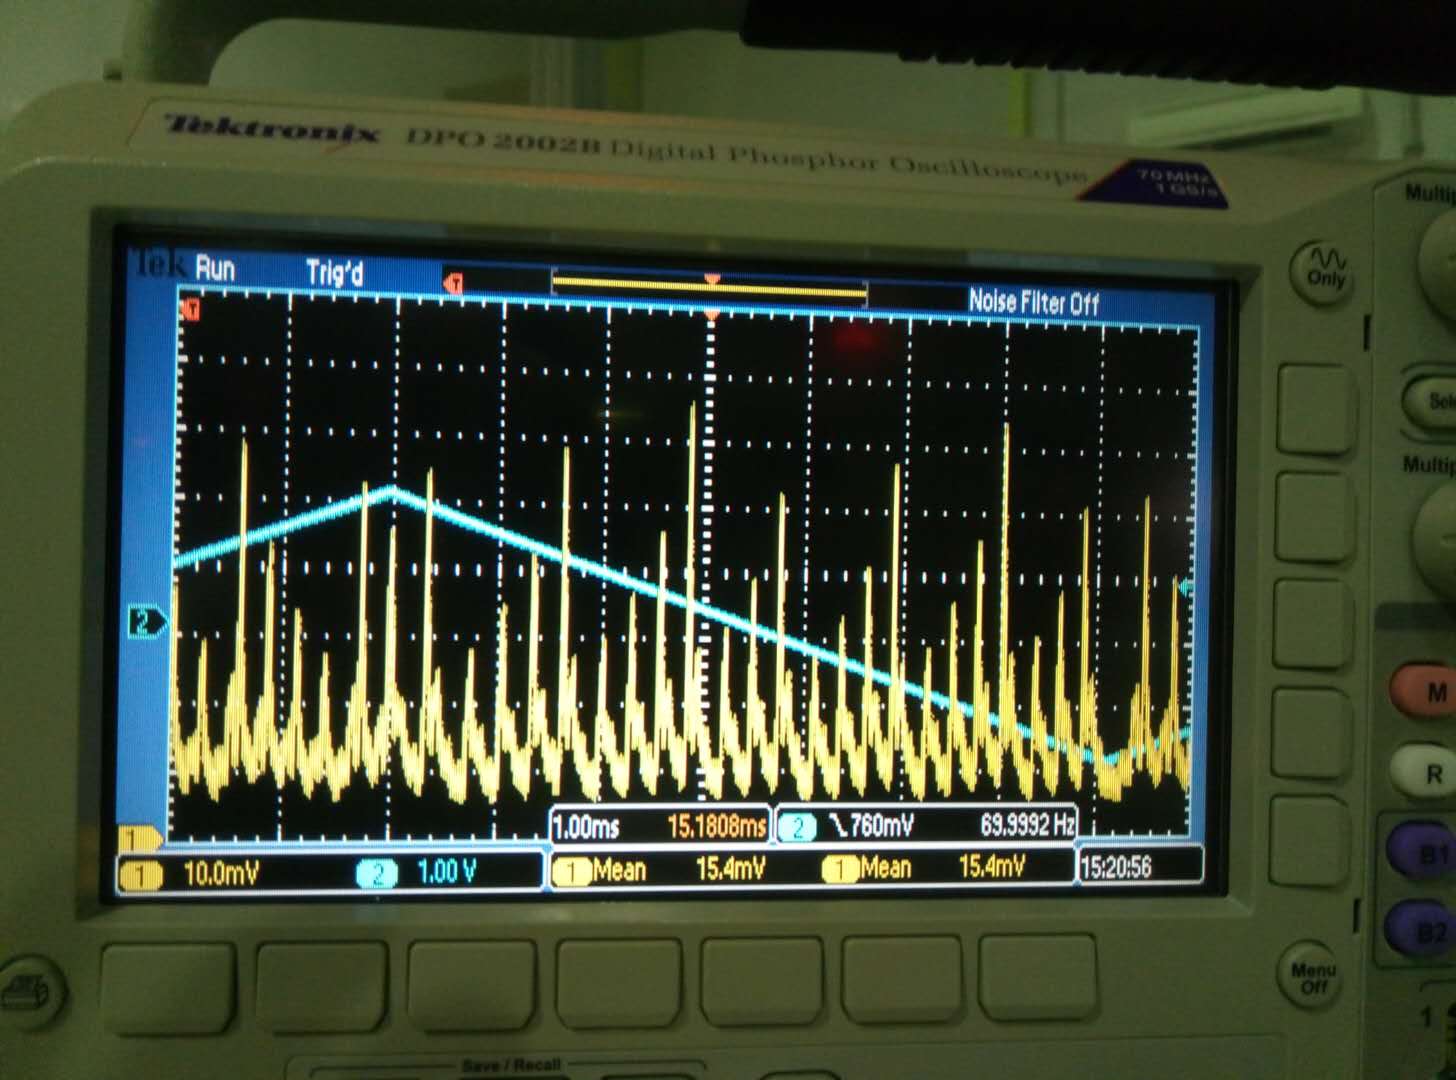
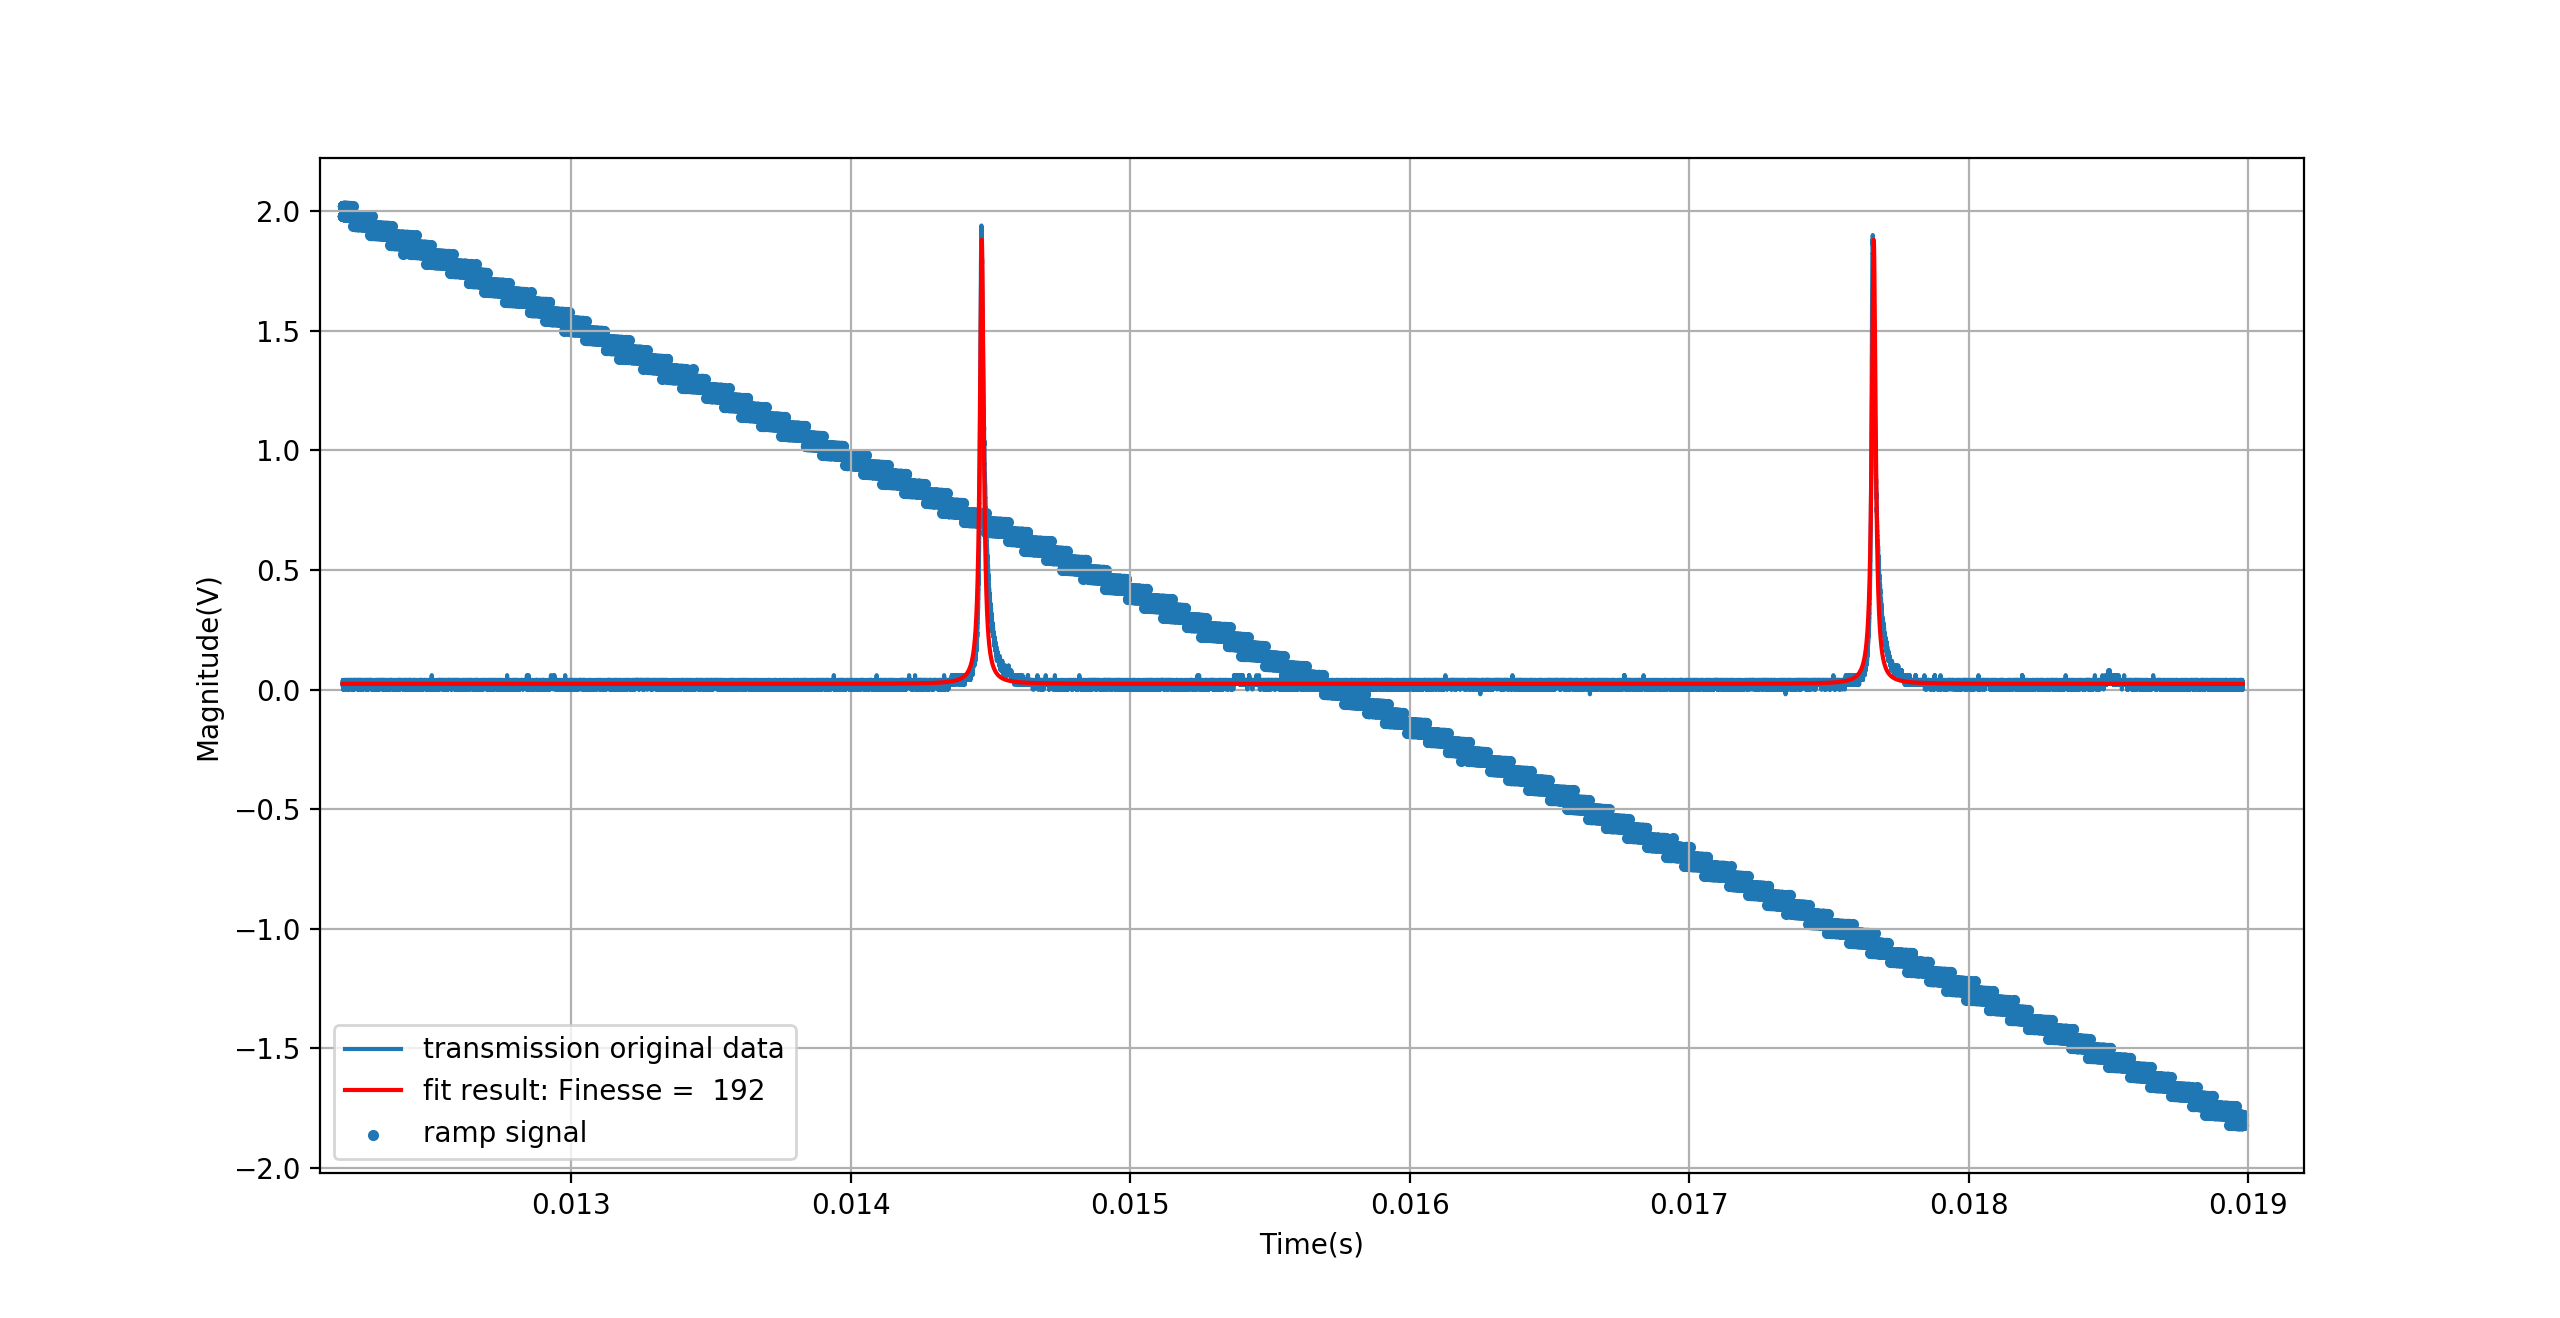
According to the simulation I did, I installed the lens and align the infrared mode cleaner today. After the alignment, I did the scanning of mode cleaner and monitor the mode cleaner transmission by PD. Since I have this scanning on the oscillscope, I used the data to do the fit. The result is Finesse = 192(according to entry 566, expect value should be 300-500). I will do some power budget statics after the lock of it.
Today after I installed the first lens, I check the beam parameter. It is quite far from the simulation. Then I found the reason maybe I didn't use a correct distance before. (Also here I found 200mm lens disappears)
Then I measured the beam again and used the lens we have to design the telescope. However I cannot get any result.
So I decide to remove the first along the west edge. Then I peformed the measurement. Before do that I aligned the beams to make them flat and go through the center of the lens and mirror as well as possible. Then I measured the beam agian. The result is w0 = 850um, z0 = 3.05m(relative to the 0th hole of west edge of the bench).
Then I use the result and mode matching tool in Jammt(by using the lens we have, I just update the lens situation today). The target beam parameter is calculated last time. It is w0 = 390um, z0 = 0.8875(relative to the 0th hole of the west edge of the bench).
The simulation result is f = 250mm @ z = 0.484m, f = 75mm @ z = 0.795m. I also check this result with the optical layout we have. It doesn't overlap with the mirror we have in the optical layout.
[Eleonora, Yuhang]
Last week, after removing the qubig EOM, we took the chance to test two resonant EOMs from TAMA, in order to see if we could see a error signal at least with them. Unfortunately even with these EOMs we could not get any PDH error signal from OPO.
Some details:
1) The EOMs from TAMA are Newport 4003(damage threshold 4W/mm2, aperture D = 3mm, length = 5.5cm) resonant at 40 MHz and 76.18 MHz resplactively.
2) We did small modifications on the p-pol path to get a reasonable matching into the OPO. (We mainly moved the lens after EOM). The reflected beam from OPO looks quite astigmatic but it was supposed to be just a quick test so we didn't spent much time to optimize matching and alignment.
3) On the newport EOM manual we read that the beam into the EOM ideally should be collimated. This in not the case for us, as we have it focused into the EOM, but it shouldn't prevent to see some modulation effect.
As a general remark, we are puzzled by the fact that even if the setup is not optimized, we cannot see any trace of error signal. Of course TAMA EOMs are ten years old and there is no guarantee they are still working but it makes us to suspect that there could be something else wrong in the set up.
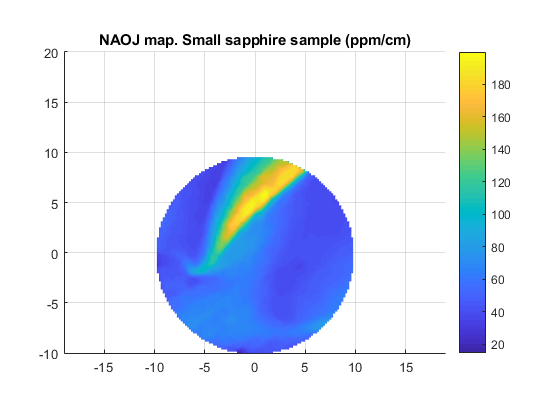
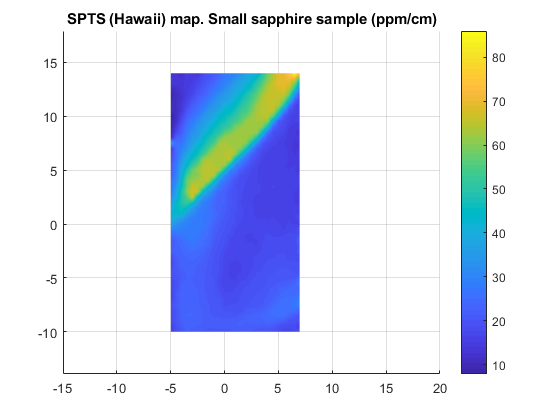
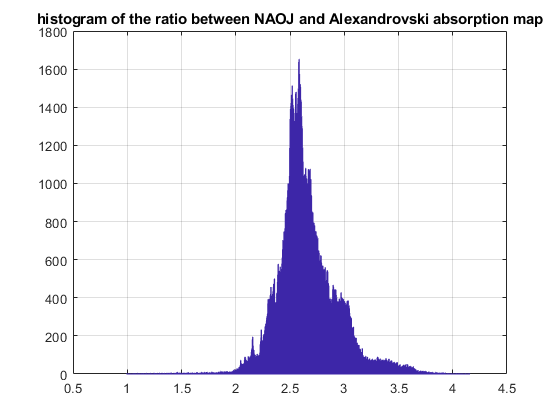
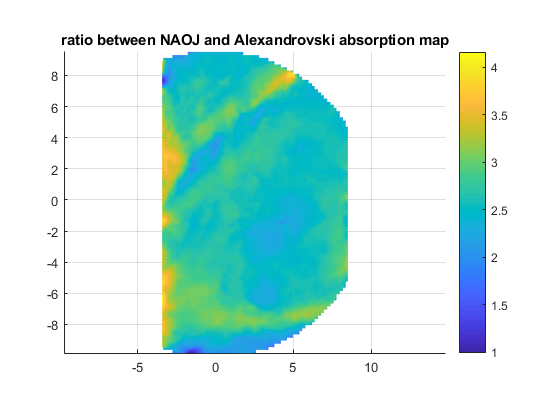
Small sapphire sample.
As I did for the LMA measurement reported in elog entry 745,
I calculated the ratio overlapping the map taken with my setup in February with the map taken by Alexandrovski.
I shifted the maps to find the minimum of the standard deviation of the ratio on the map.
The ratio is 2.55+/-0.3
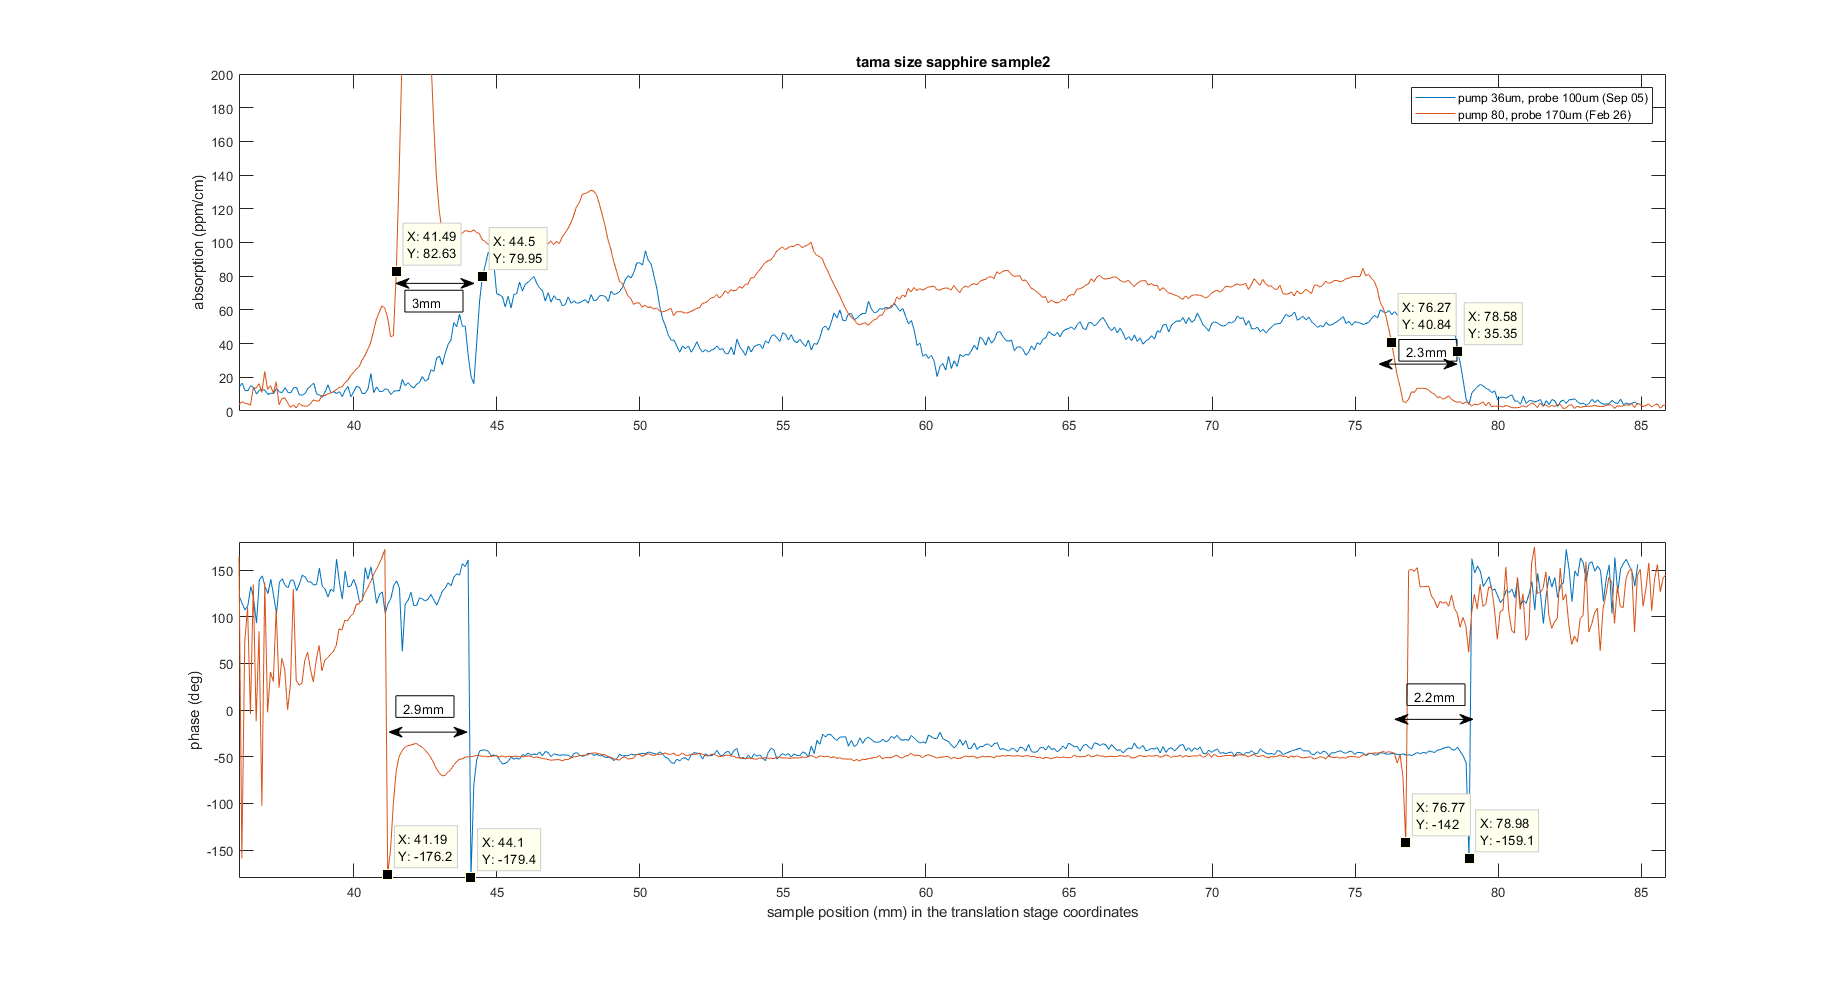
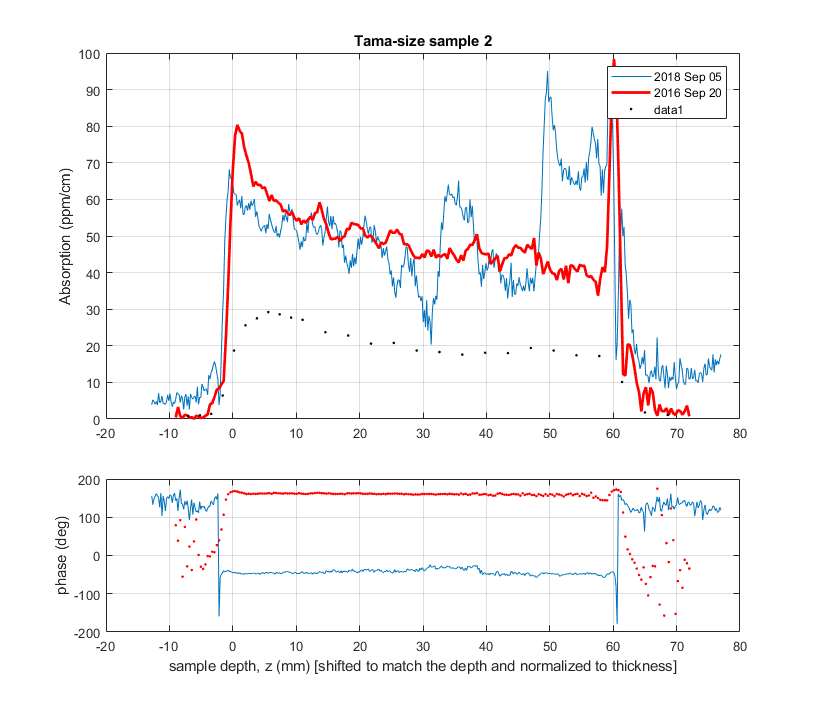
Tama -size Sapphire Sample2. I plot together the data taken:
- with the original setup 2 years ago (red line);
- with the current setup, which should have all the same parameters as the original setup, according to the company instructions (blue line)
- at LMA (black dots)
It looks like we are back to the factor of ~2 we had at the beginning.
(note: the phase is not calibrated, so it is different in the 2 plots mainly because of the different position of the chopper)
[Yuhang, Eleonora]
In the past days we observed that the SHG lock was quite unstable and difficult to acquire. Yesterday we find out that the demodulation phase was very badly tuned thus the error signal was extrimely small. We have optimized it and now the lock seems more robust.
[Yuhang, Eleonora]
We have continued the investigating about the cause of the missing PDH signal for the OPO.
1) We tested the OPO photodiode on the SHG and we were able to see a clear PDH error signal (with a IR beam with a power of about 80 uW). See pic 1.
2) We checked again (with a large bandwidth oscilloscope) the amplitude of the RF signal sent to the EOM. It seems to be about 18 dBm (5V pp) which corresponds to a modualtion depth of 0.5 rad, that, for sure, is not too small.
3) FInally we removed the EOM from the bench and we ispected it. Indeed the crystal looks damaged. see pic 2. We sent the picture to Qubig and they also confirmed that the crystal is not healty and need to be changed. They suggest us to ship the EOM back to proceed with the reparation. We are now organizing the shipping.
[Yuhang, Eleonora, Matteo]
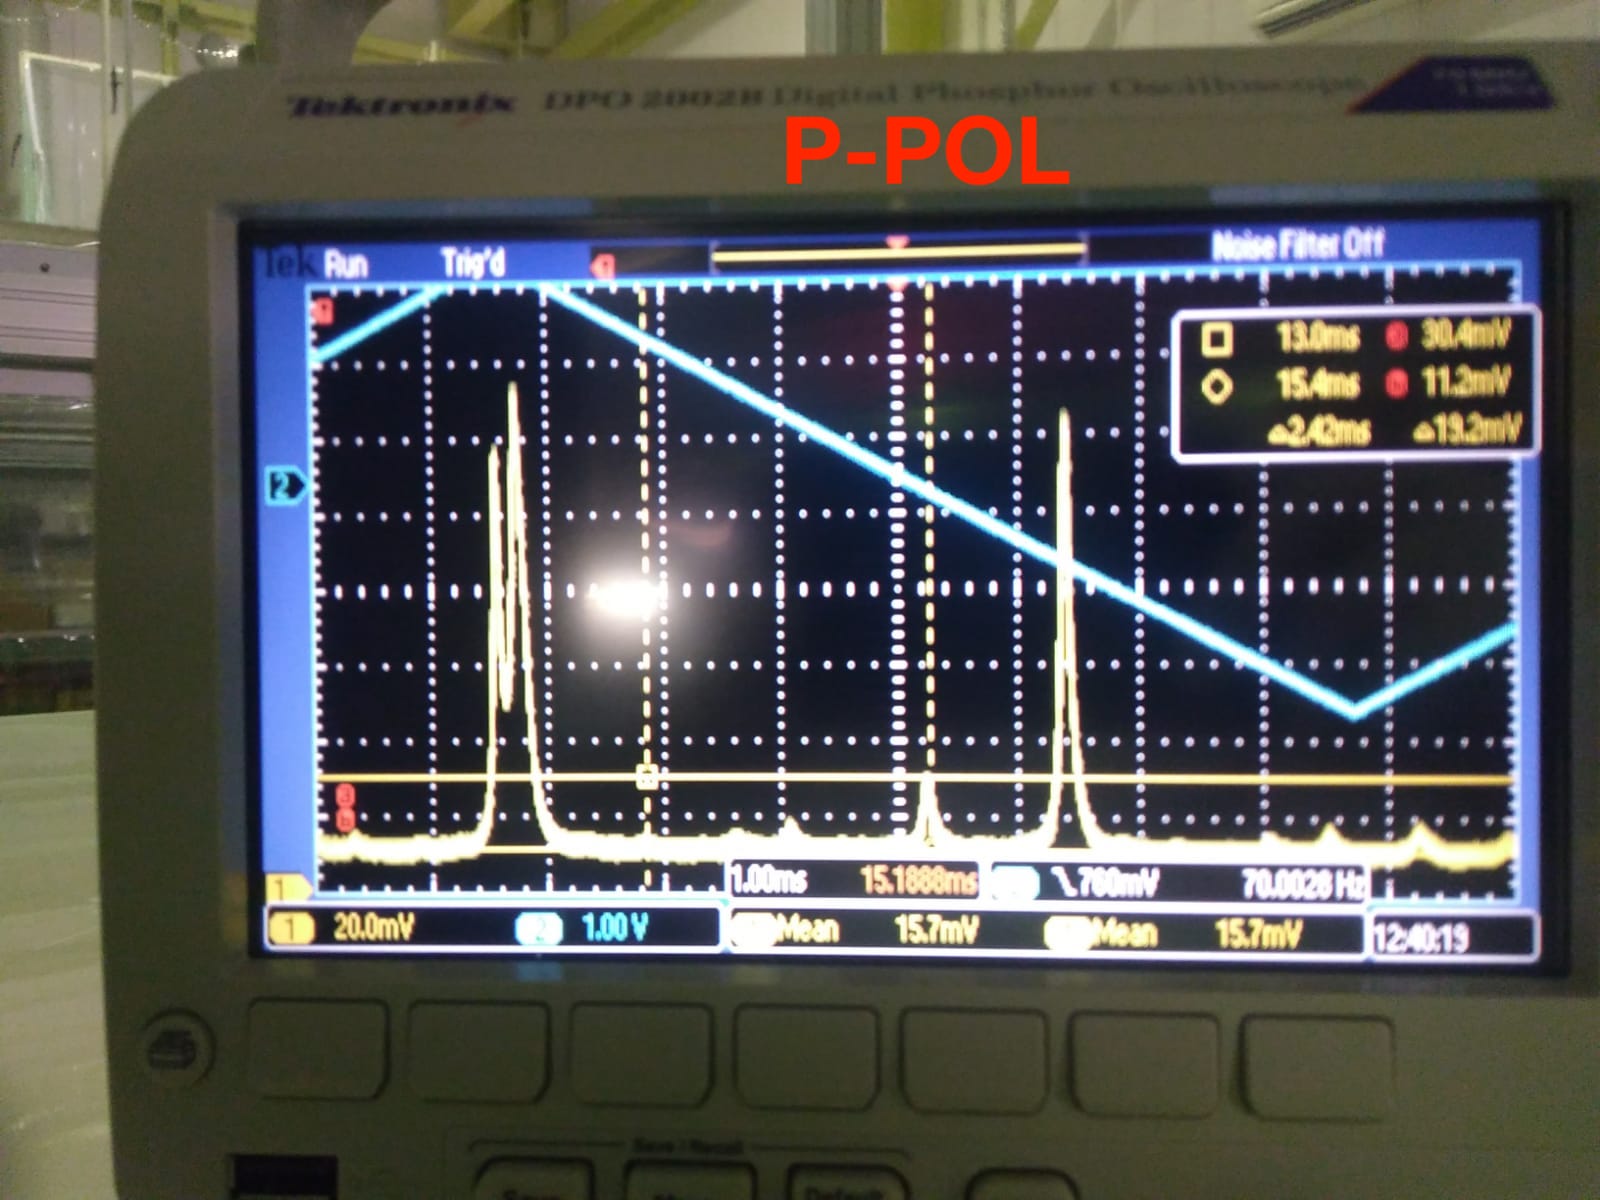
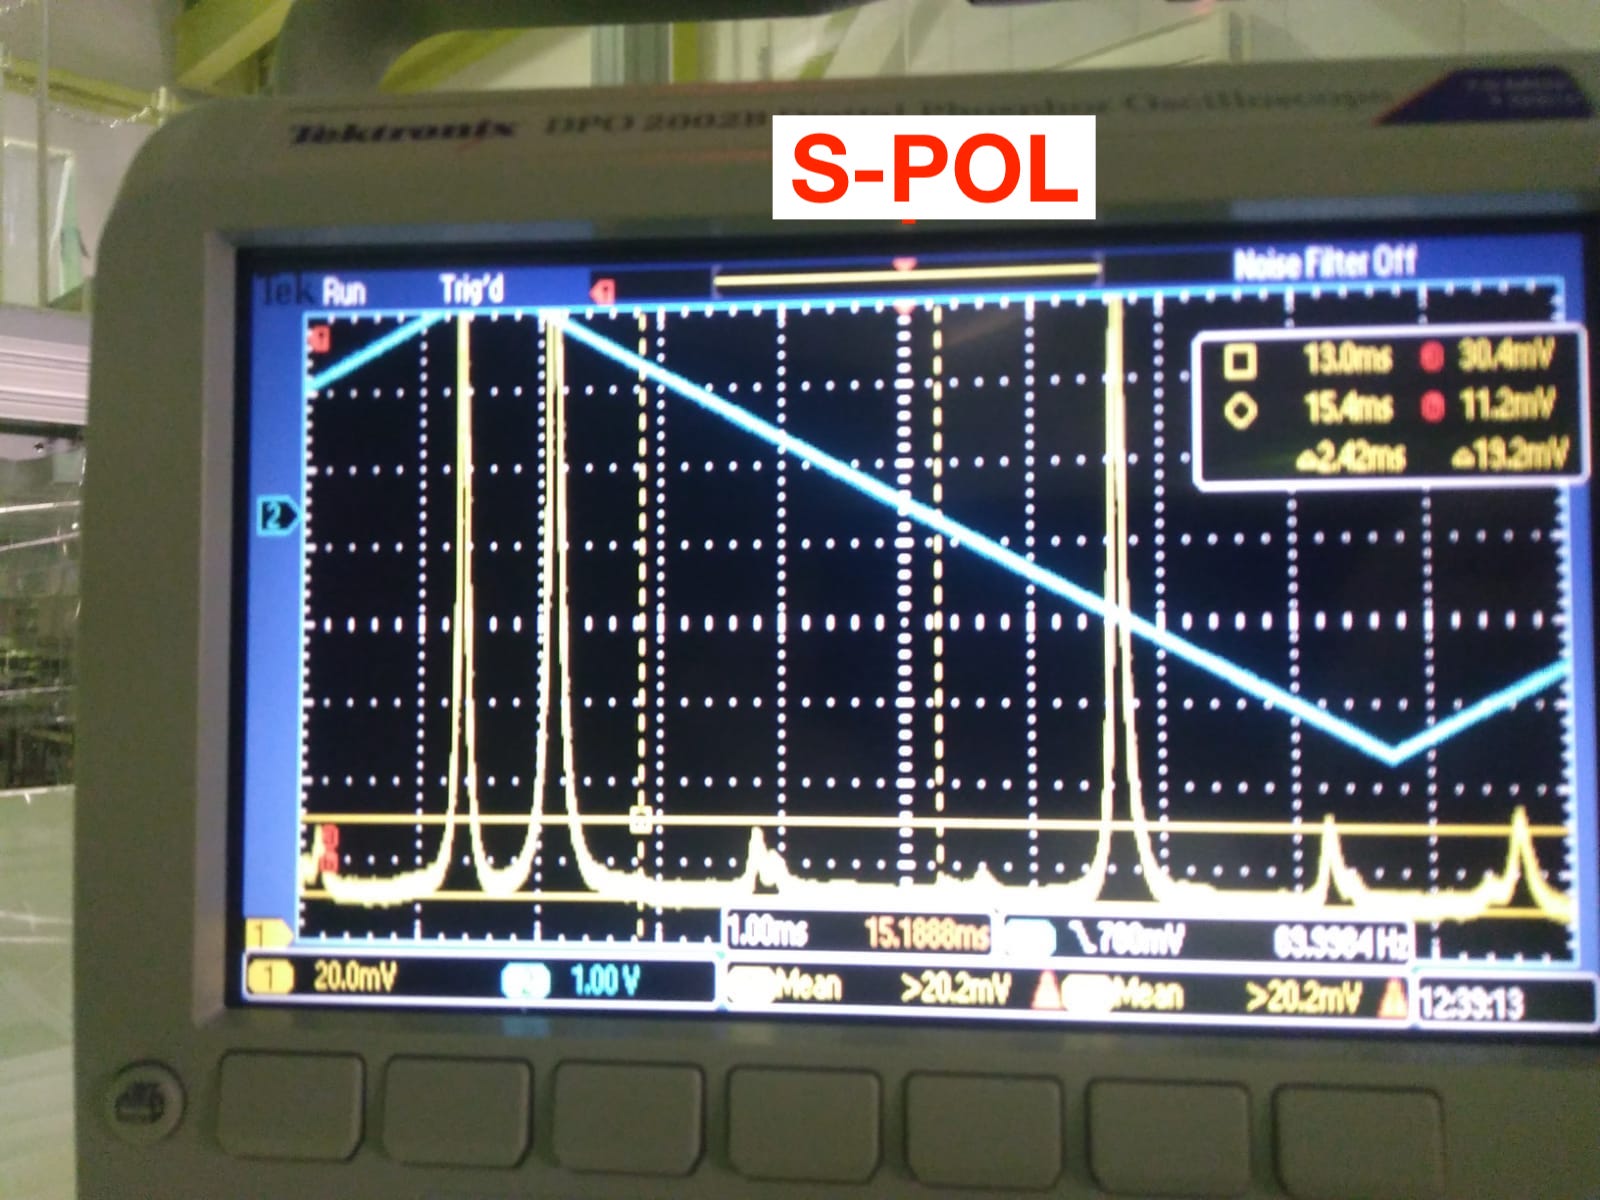
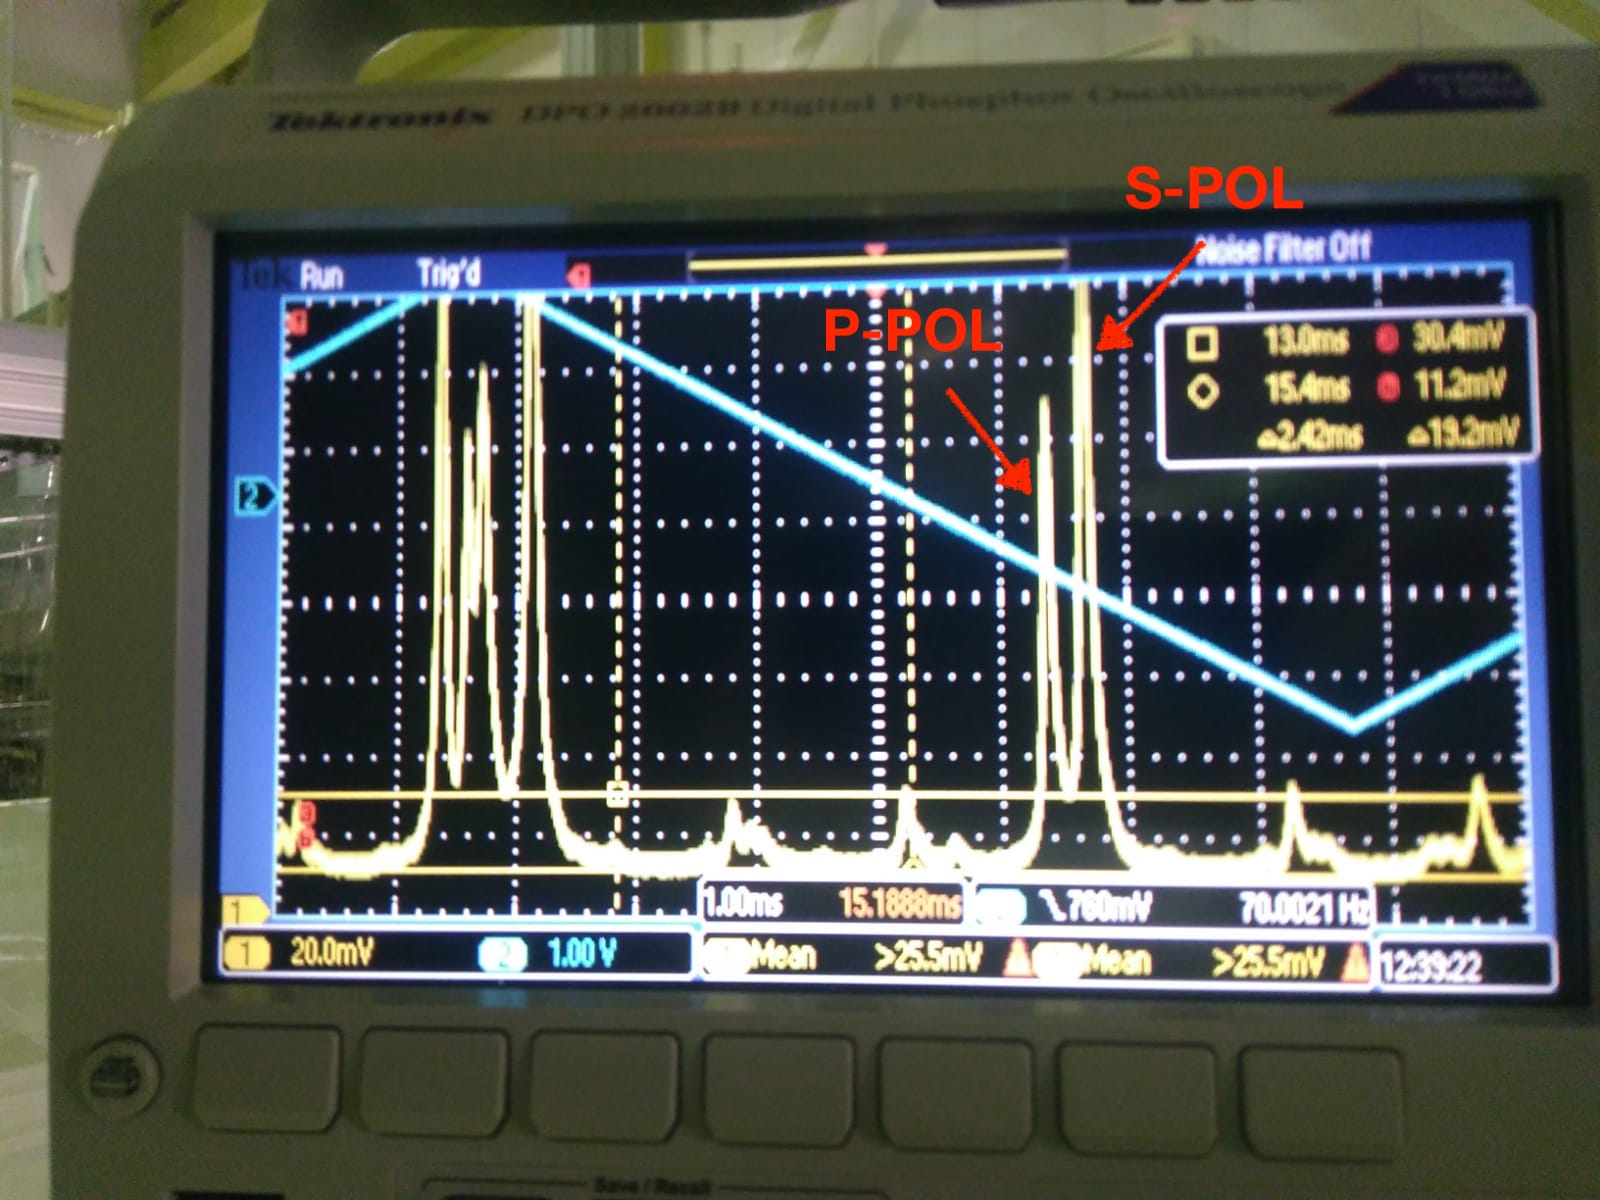
The goal is to lock the OPO using P-pol beam
Preliminar information: The p-pol beam is modulated at 88 MHz (with resonant Qubig EOM). Because of the lack of space, the beam had to be focuesed inside the EOM and thus the power sent to it has to be reduced. Currently we have 5.5 mW reach the OPO and this power cannot be increased without changing the EOM telescope configuration.
After some difficulties due to a wrog setting of the gain of the photodiode in trasmission, we managed to align also the p-pol beam. (see pic1. left)
S-pol is also reasonably well aligned. (see pic1. right)
The trasmitted power for p-pol is about 10 uW while the input is power is 5.5 mW. The transmissivity for p-pole is about 0.18%. For the s-pol we found 0.25% and the nominal is 1.2%.
[Note that since the cavity has not be locked, we made the measurent by manually driving the piezo in order to bring the cavity on the top of 00 resonance. It may be not very accurate.]
After that we installed the locking set up but we couldn't find any PDH signal from the PD in reflection.
Some tests we did:
1) We ruled out that it is a malfunctioning of the PD, as we checked that it was able to sense PDH signal from the green mode cleaner. (But note that responsivity for IR is more than a factor two smaller)
2) We double check the alignement of the PD.
3) We lowpassed the signal with a SR560 to get rid of some high frequency noise, but it didn't help
4) We check the signal coming from the PD(before demodulation) with a spectrum analyzer but we couldn't find any line at 88 MHz. So we know that the problem doesn't come from the demodulation, but it's present before.
5) We checked that the driving signal was reaching EOM.
6) We checked that the EOM orientation was the one required by the input beam polarization
7) We tried to reduce the modulation depth but we coudn't see any change in the amplitude of the TEM00 peaks in trasmission.
Some hypotesis:
1) The EOM may not work. How to check it?
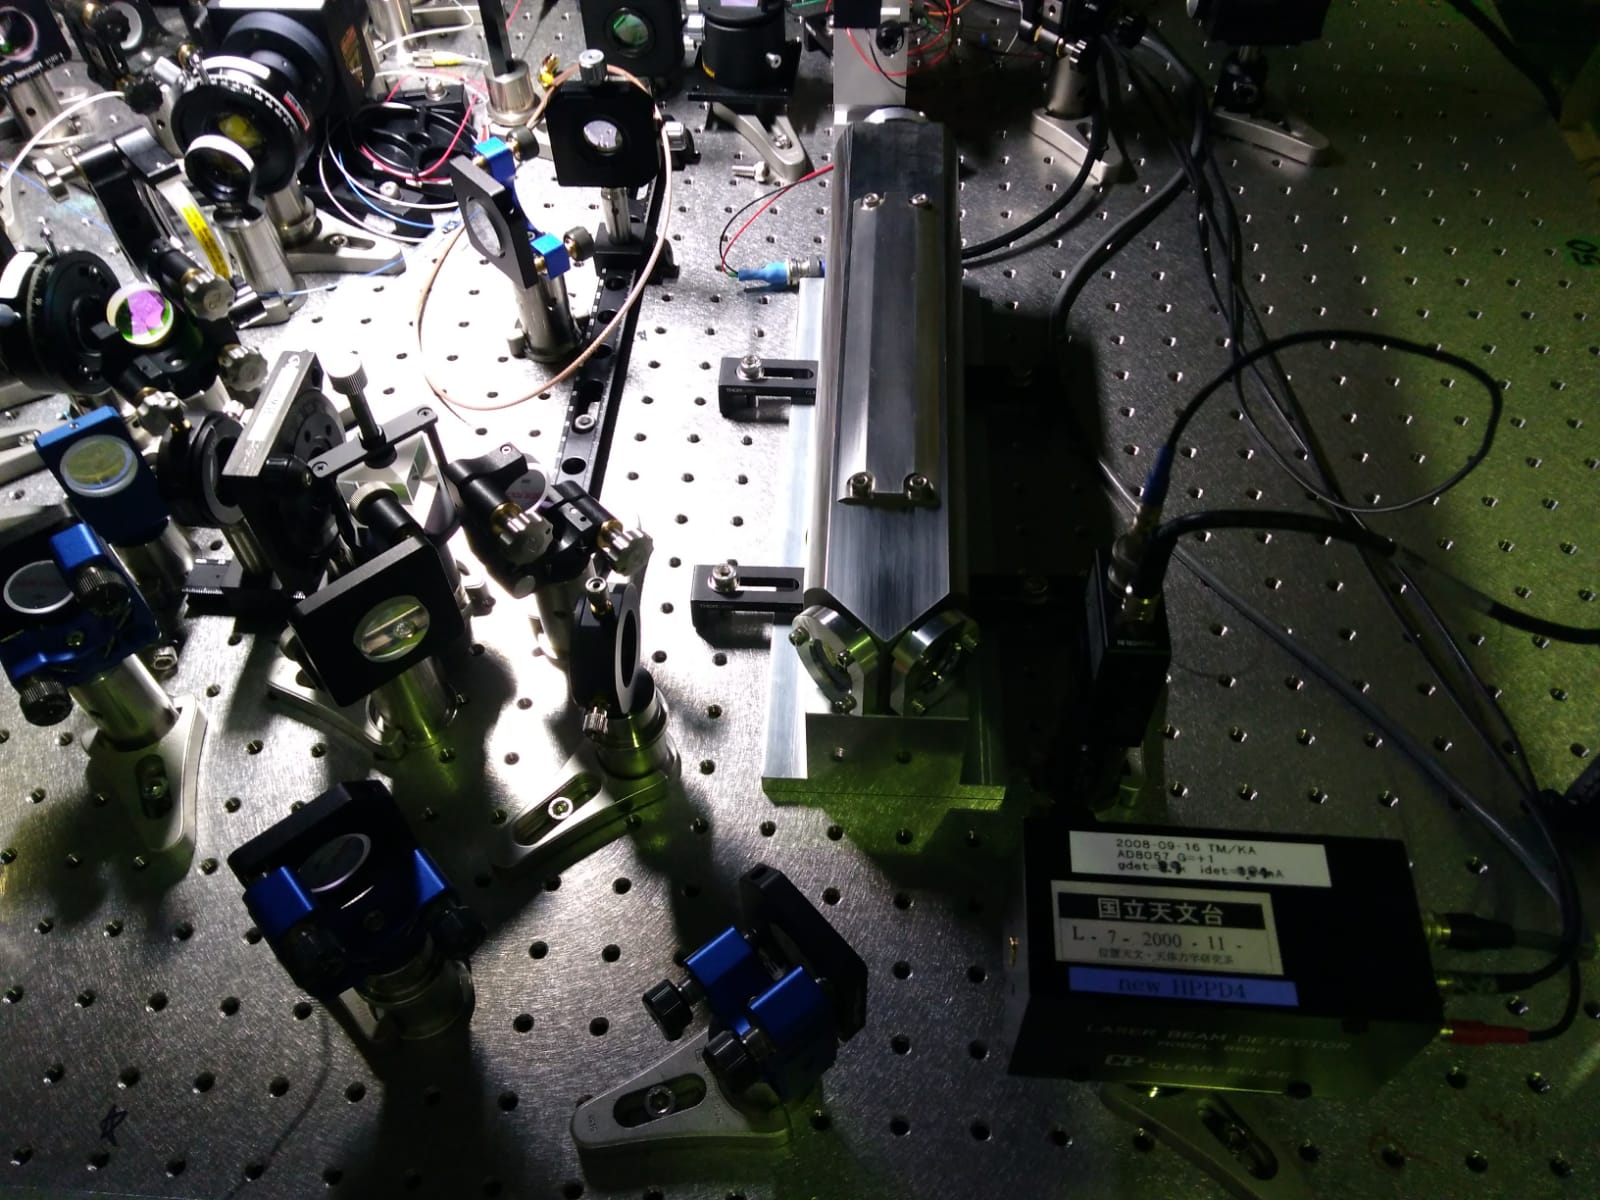
2) The signal on the lock PD may be too weak? We send it 200uW ( which should be fine) but the responsivity at 1064nm is small (see attached PD datasheet)
Note: we uploaded the datsheets from Qubig components on the FC wiki at this link https://gwpo.nao.ac.jp/wiki/FilterCavity/Datasheets
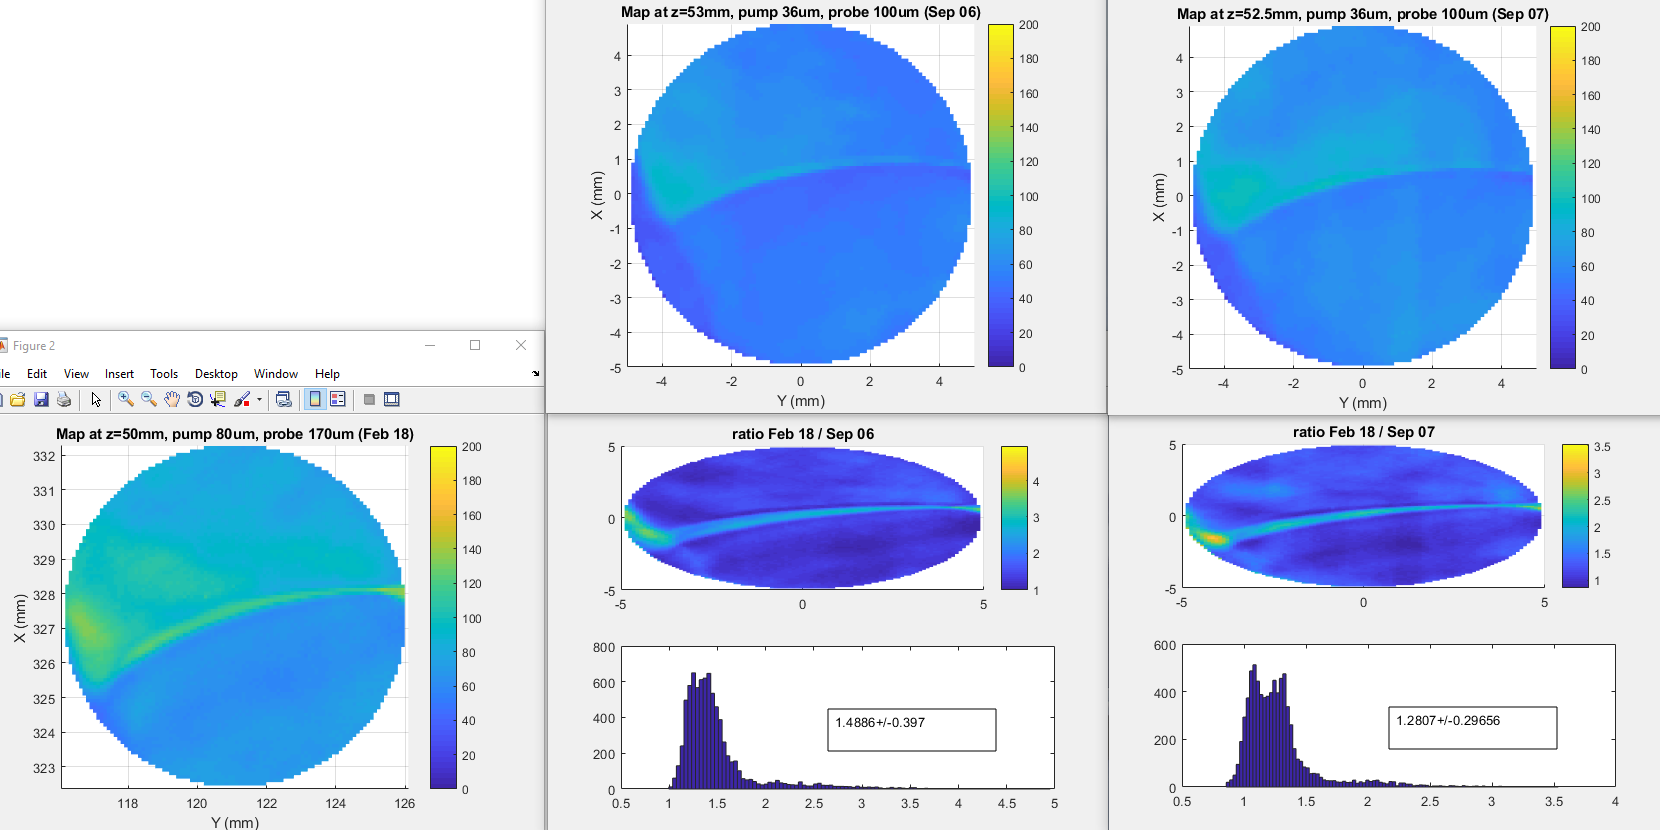
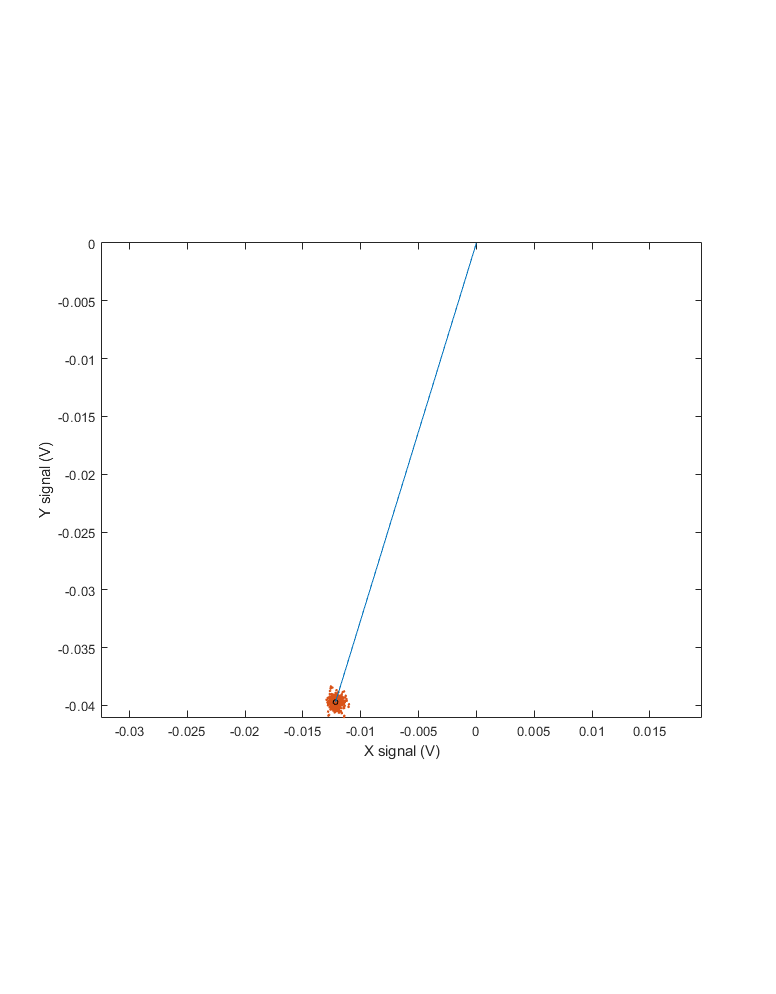
The scans in the comparison reported in elog entry 973 were shifted to make the comparison more clear, but if we plot the original data together (see first plot), we see that the crossing point has shifted after we changed the probe size and pump size.
The shift is between 2.3mm and 3mm, therefore to compare a measurement with the map taken at 50mm (reported in elog entry 678 ) I took a map at 53mm and another one at 52.5mm.
I calculate the ratio between the large beams maps and the small beams maps. See last plot