NAOJ GW Elog Logbook 3.2

We left the Mach-Zehnder and green mode cleaner locked and we found them still locked when we came back after about 2 hours.
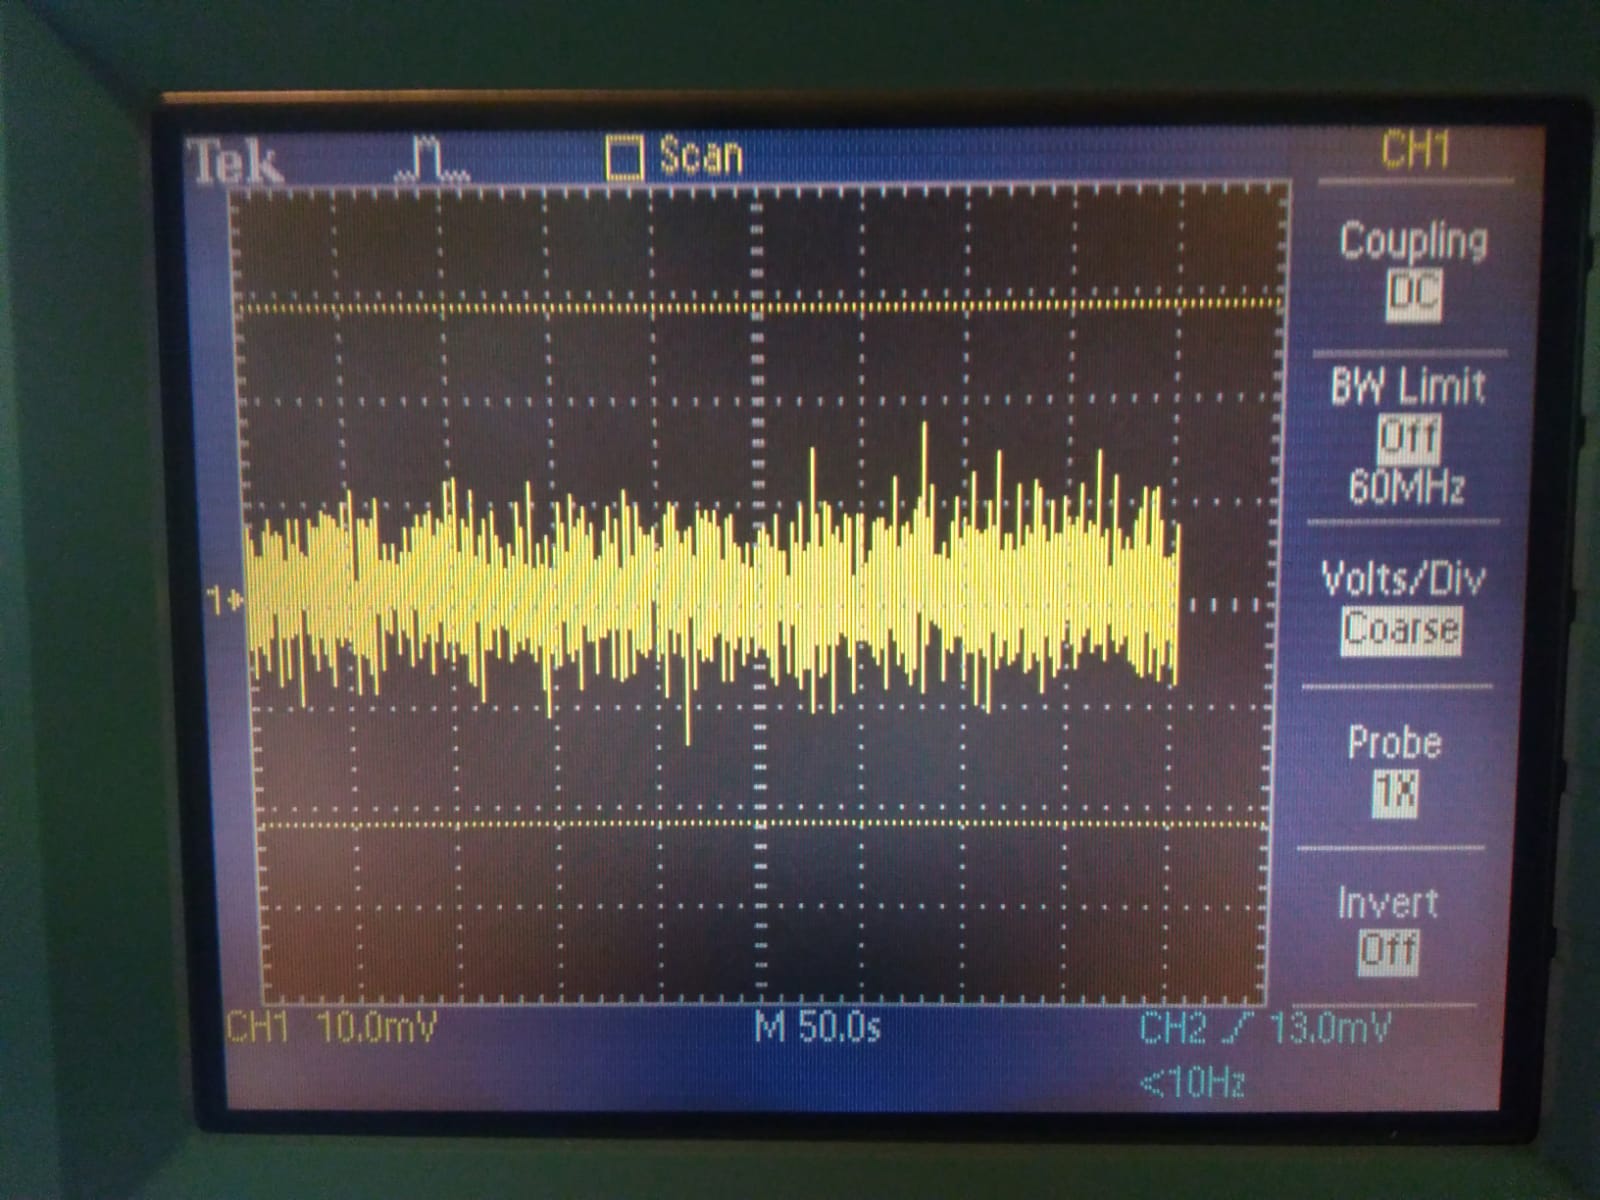
The attached picure shows the transmitted power from the MC over a period of about 8 min (the longest that can be recorded with the oscilloscope) after two hours of lock.
The gain of the potentiometer of MZ was 9.9 and fluctuations seem to be of the order of 1.5%
The laser is polarized. Using a non-polarizing 50:50 cube beam splitter I separated the 1310nm probe in 2 beams. One beam is detected by the DET10N and the other by the PM100D integrating sphere.
Conditions:
laser current = 200mA,
power attenuated by a od2 nd filter,
power on each PD = about 250microW,
load resistance of DET10N = 7.5kOhm.
DC PM100D = 1.52 V
DC DET10N = 2.62 V
I recorded 2 videos of the oscilloscope measuring the two signals simultaneously.
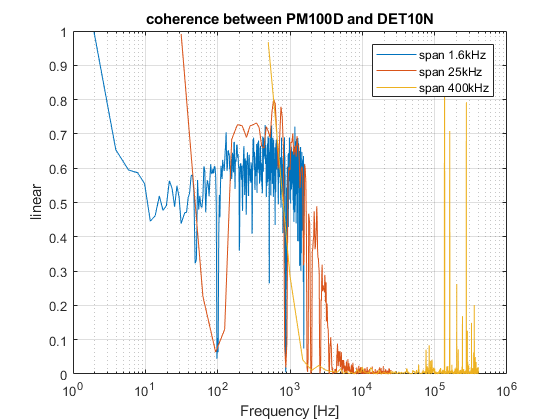
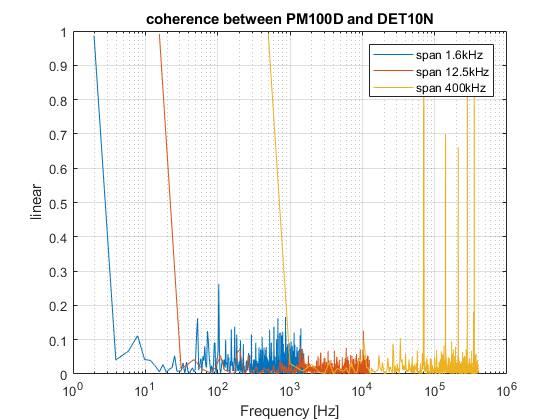
Then I measured the coherence, and this time the signals are more coherent. See plot
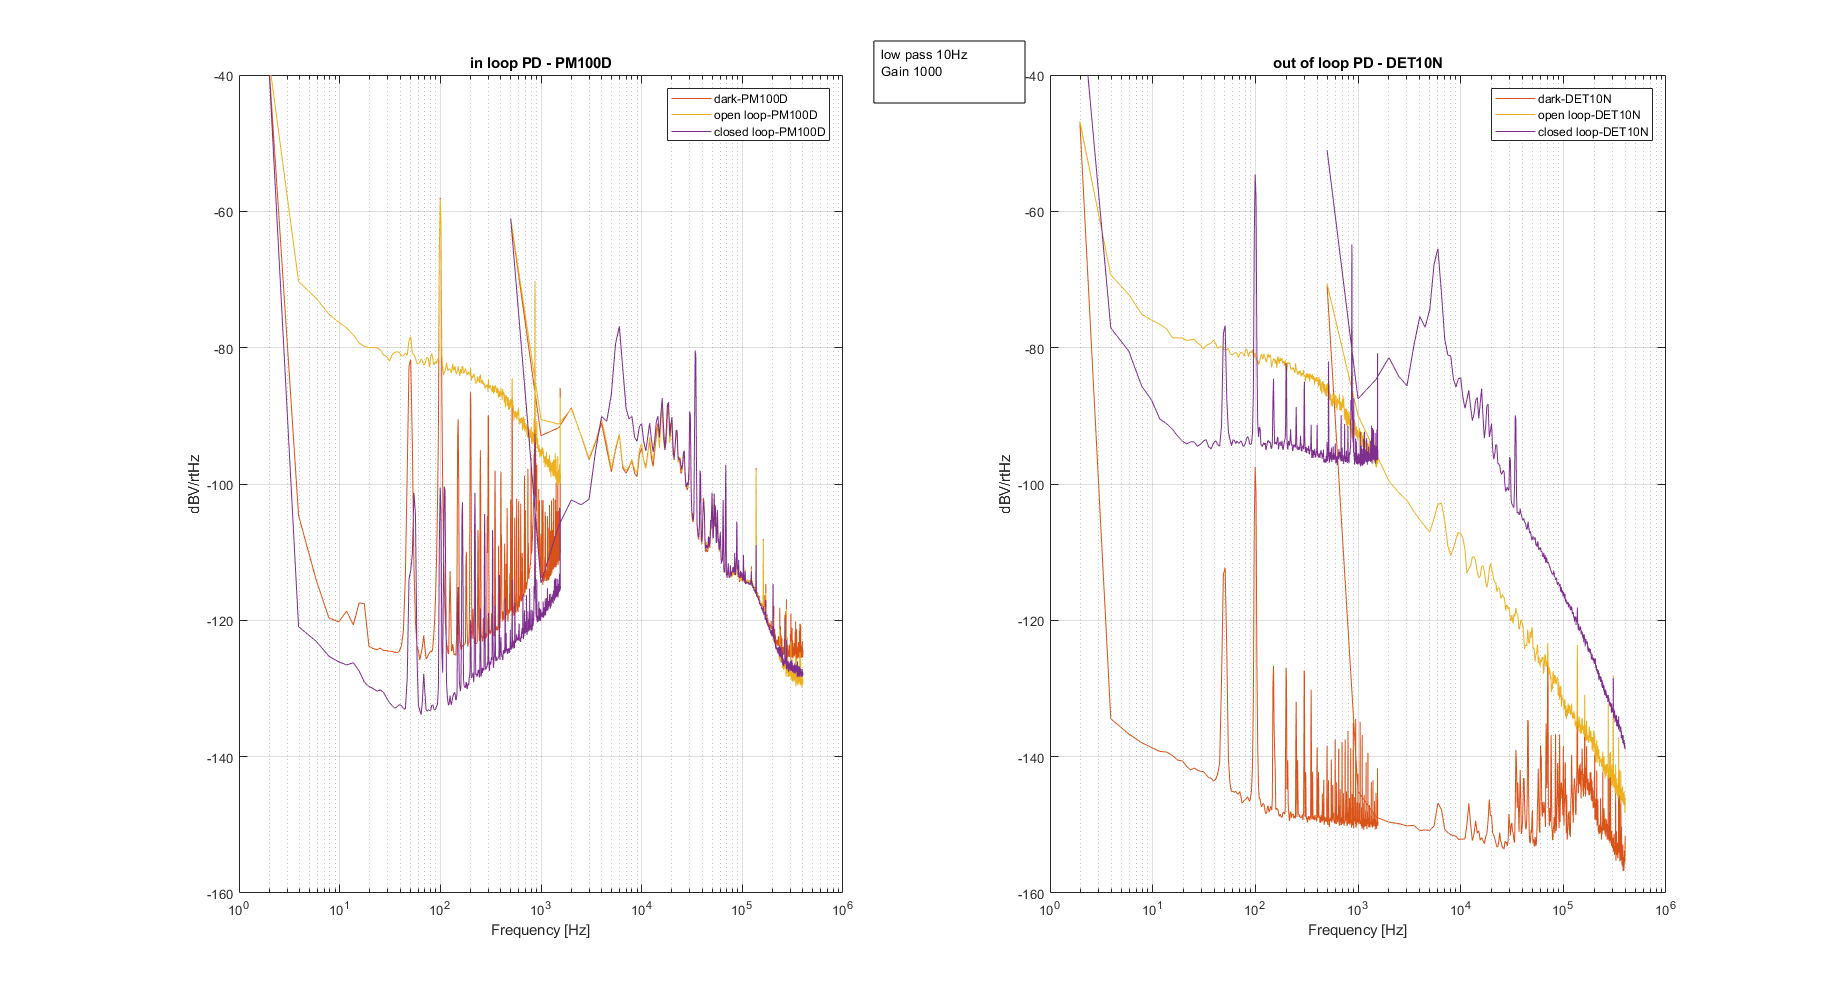
then I closed the loop with the PM100D in-loop and then I closed the loop with the DET10N in-loop. See the plots.
Now the loops work better, but maybe its better to use another DET10N, because it looks less noisy.
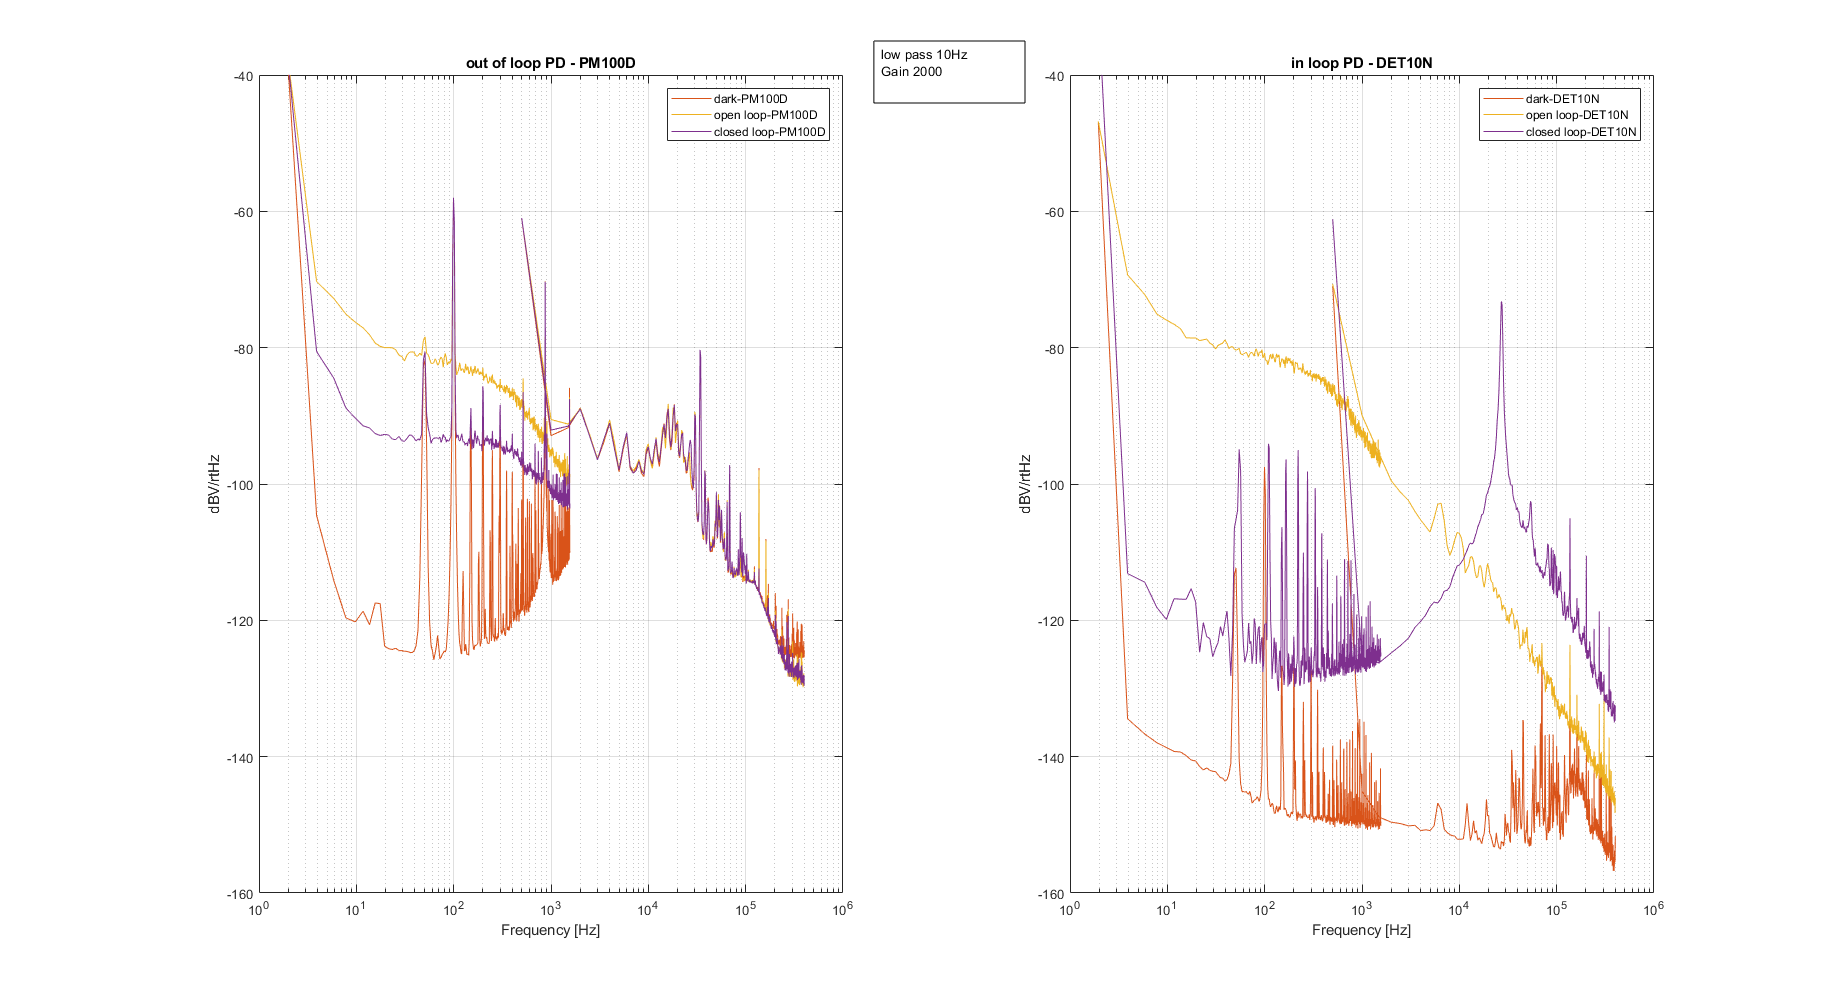

I replaced the PM100D power meter with another DET10N that I borrowed from Tanioka-kun, and I repeated the measurement.
This time the two signals at the oscilloscope look really similar. See the attached videos. (also the coherence on the spectrum analyzer is close to 1, sorry I didn't save the coherence data).
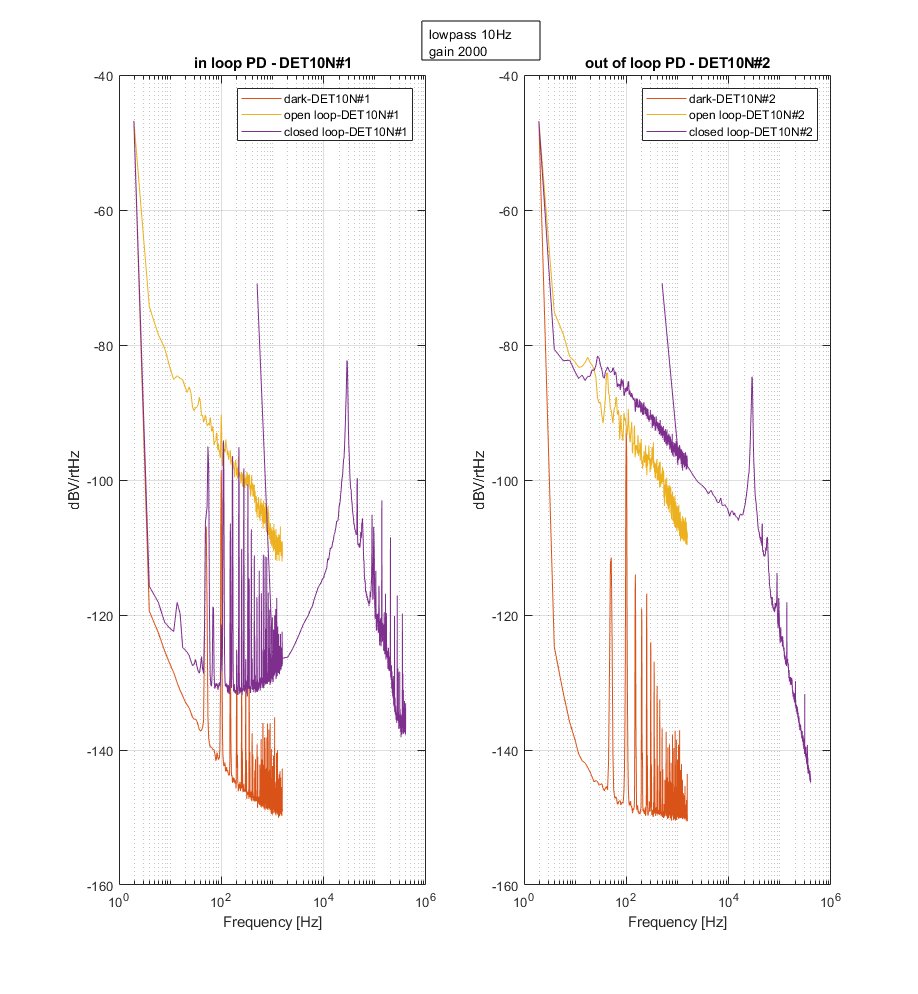
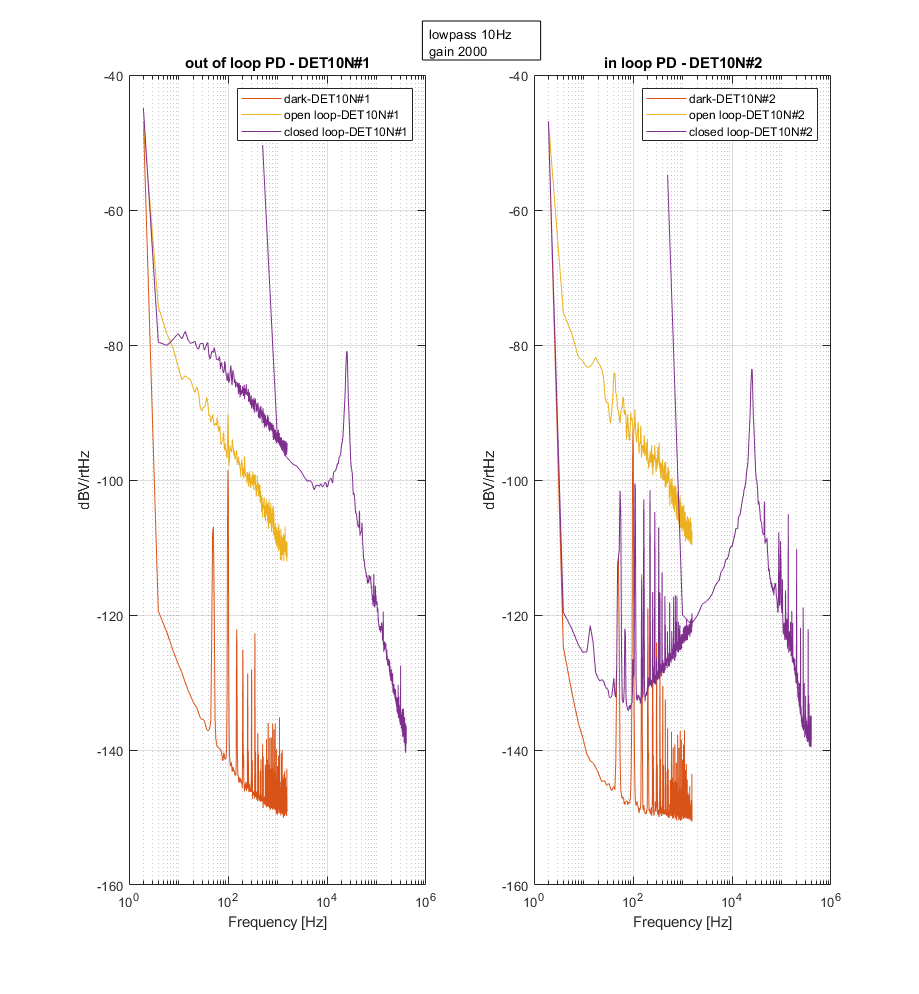
Then I closed the loop using the PD#1 in-loop and the PD#2 out-of-loop.
Then I exchanged them and closed the loop. See the two figures.
The control loop reduces a lot the noise in-loop but it doesn't really work for he out-of-loop PD (same situation when they are exchanged).
One possible reason could be the clipping noise, because I'm not sure how precisely the beam is focused inside the area of the PD.
Another possible reason could be the OD2 filter (that I'm putting after the laser to limit the power and avoid the PDs saturate). If I remove it, 40mW would imping on each PD. I'm not sure how safe it will be for the PD, and In order to avoid saturation, I will have to drastically reduce the load resistance.
Another way to reduce the power would be to enlarge the beams up to much more than the PD size (which is 1mm).
effect in the setup?
- When the loop is closed there is an oscillation at high frequency. Is the loop gain too high?
- Having the beams well focused within the photodiodes is important for this test.
We made a measurement of the power stability after the green mode-cleaner with both mode-cleaner and MZ locked.
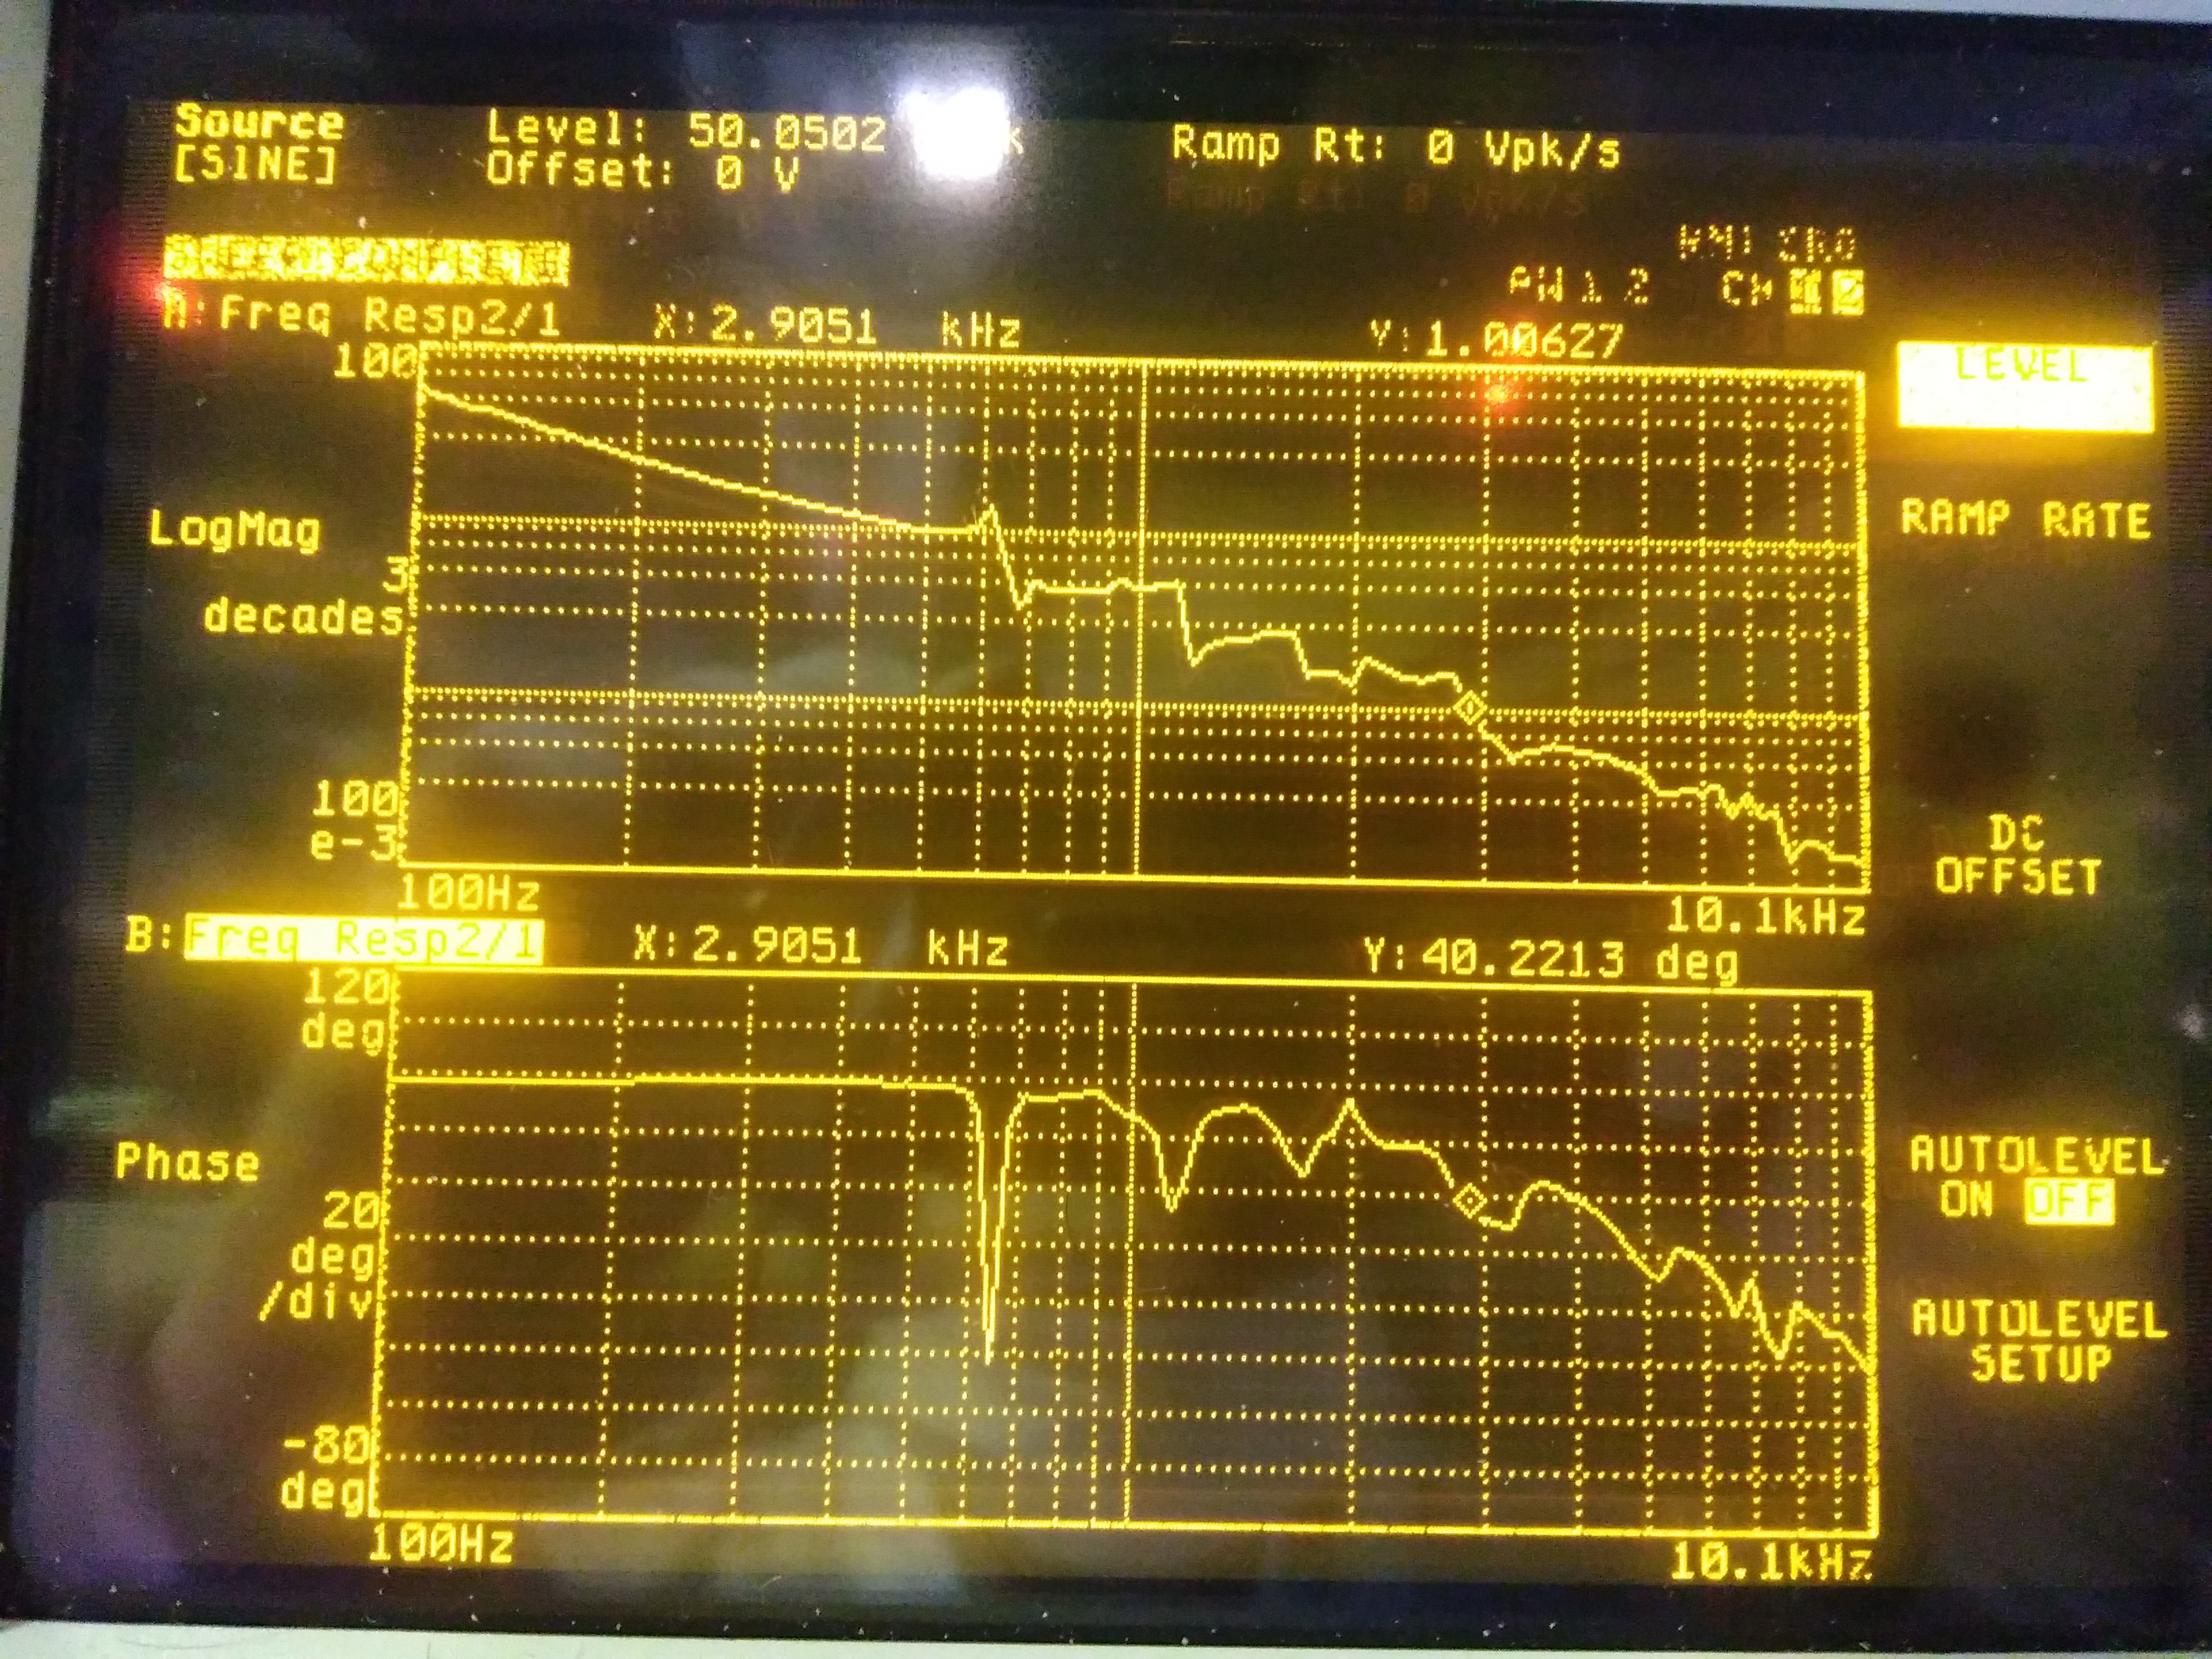
The mode-cleaner was locked with the Stanford preamplifier (first order low pass, cut off frequency 3 Hz, gain = 5). The unity gain frequency should be measured, but the lock was very stable.
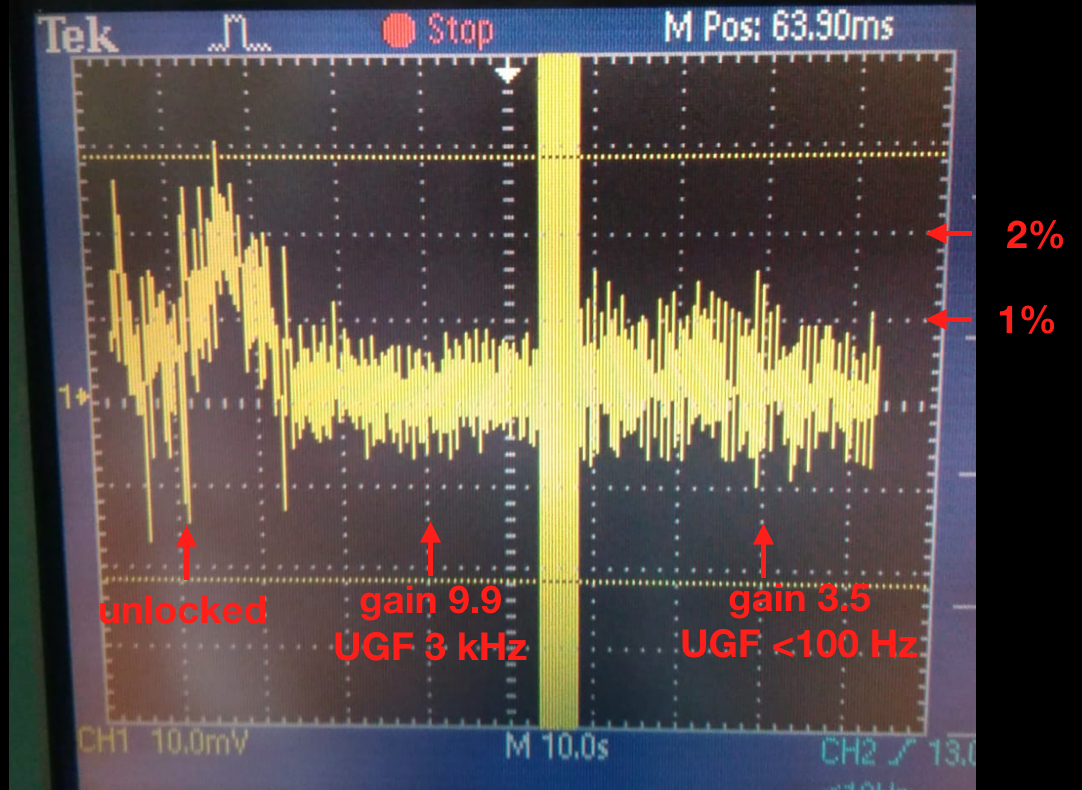
The MZ was locked with the Emil board at a position of the frange intermediate between the half fringe and the bright fringe (bright fringe correspond to 1,3 V and MZ was locked at about 1 V, corresponding to 11.3 mW), using the transmisison signal after the mode-cleaner. The measurement of the unity gain frequency gave a 3 kHz ugf (see picture 2), compatible with the ugf measured by Emil. (gain of the potentimeter 9.9).
Figure 1 shows the power transmitted with no lock, then with the 3 kHz ugf lock and with a gain reduced (from the position 9.9 to the position 3.5, corresponding to a measured ugf less than 100 Hz). We remark that, during the transition between high gain and low gain the loop experiences an instability at about 600 Hz (as altready observed by Emil) and it is coming back to a stable position.
The power transmitted by the mode-cleaner was 11.3 mW (corresponding to about 1 V). The fluctuations of the transmitted power on several tens of seconds timescales have an amplitude less than 10 mV (which corresponds to 1%) with the high gain. With the reduced gain, the fluctuations increase by roughly 1.5 and they remain less than 2%.
We left the Mach-Zehnder and green mode cleaner locked and we found them still locked when we came back after about 2 hours.
The attached picure shows the transmitted power from the MC over a period of about 8 min (the longest that can be recorded with the oscilloscope) after two hours of lock.
The gain of the potentiometer of MZ was 9.9 and fluctuations seem to be of the order of 1.5%
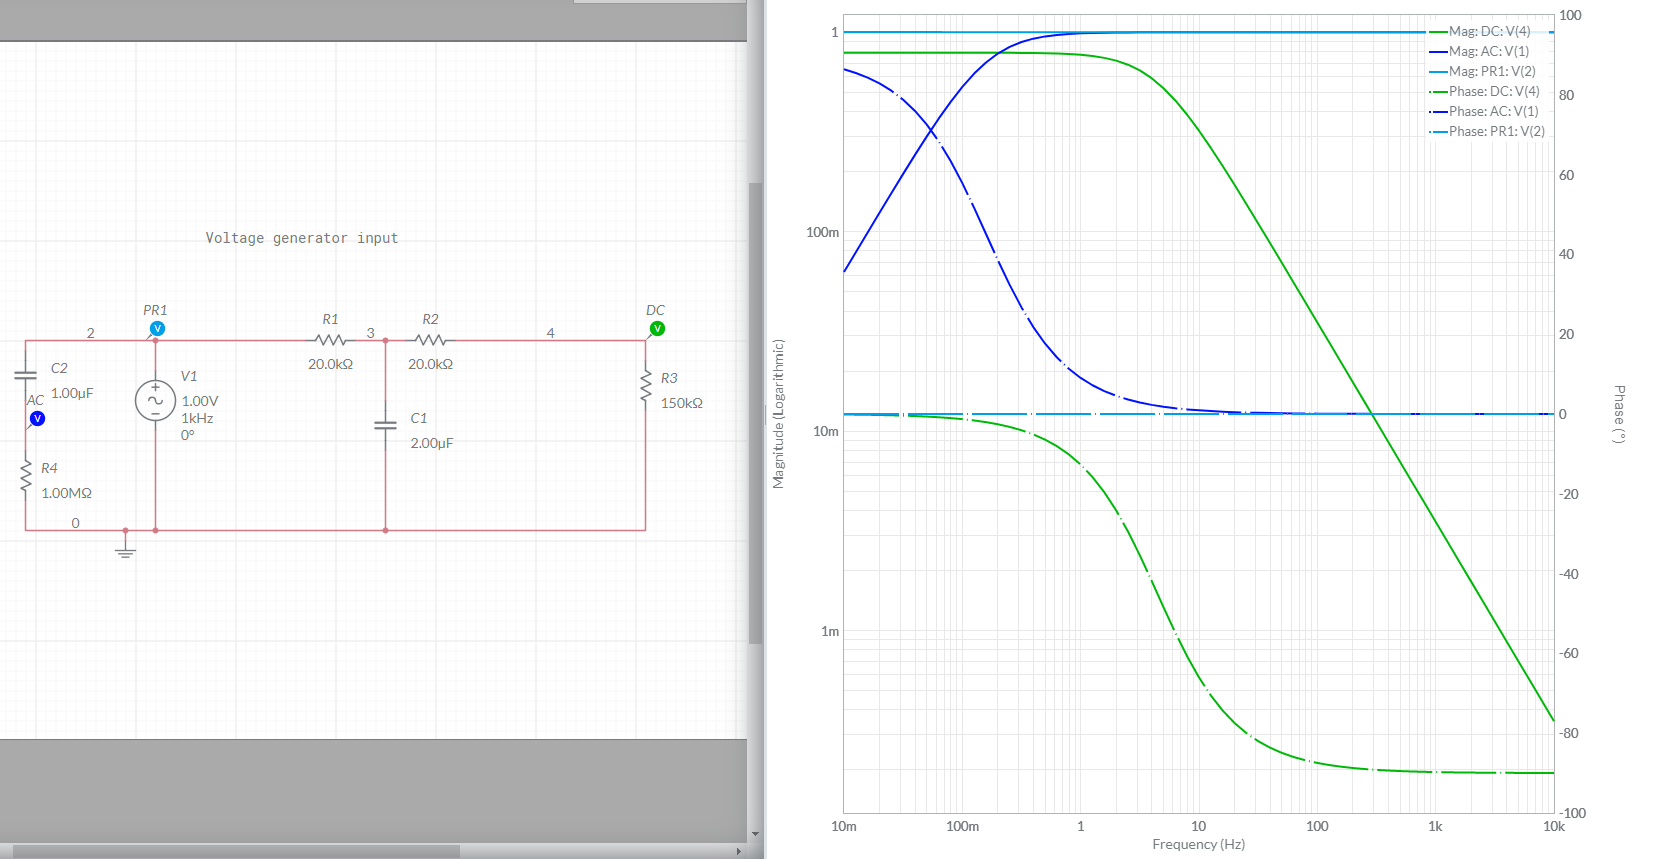
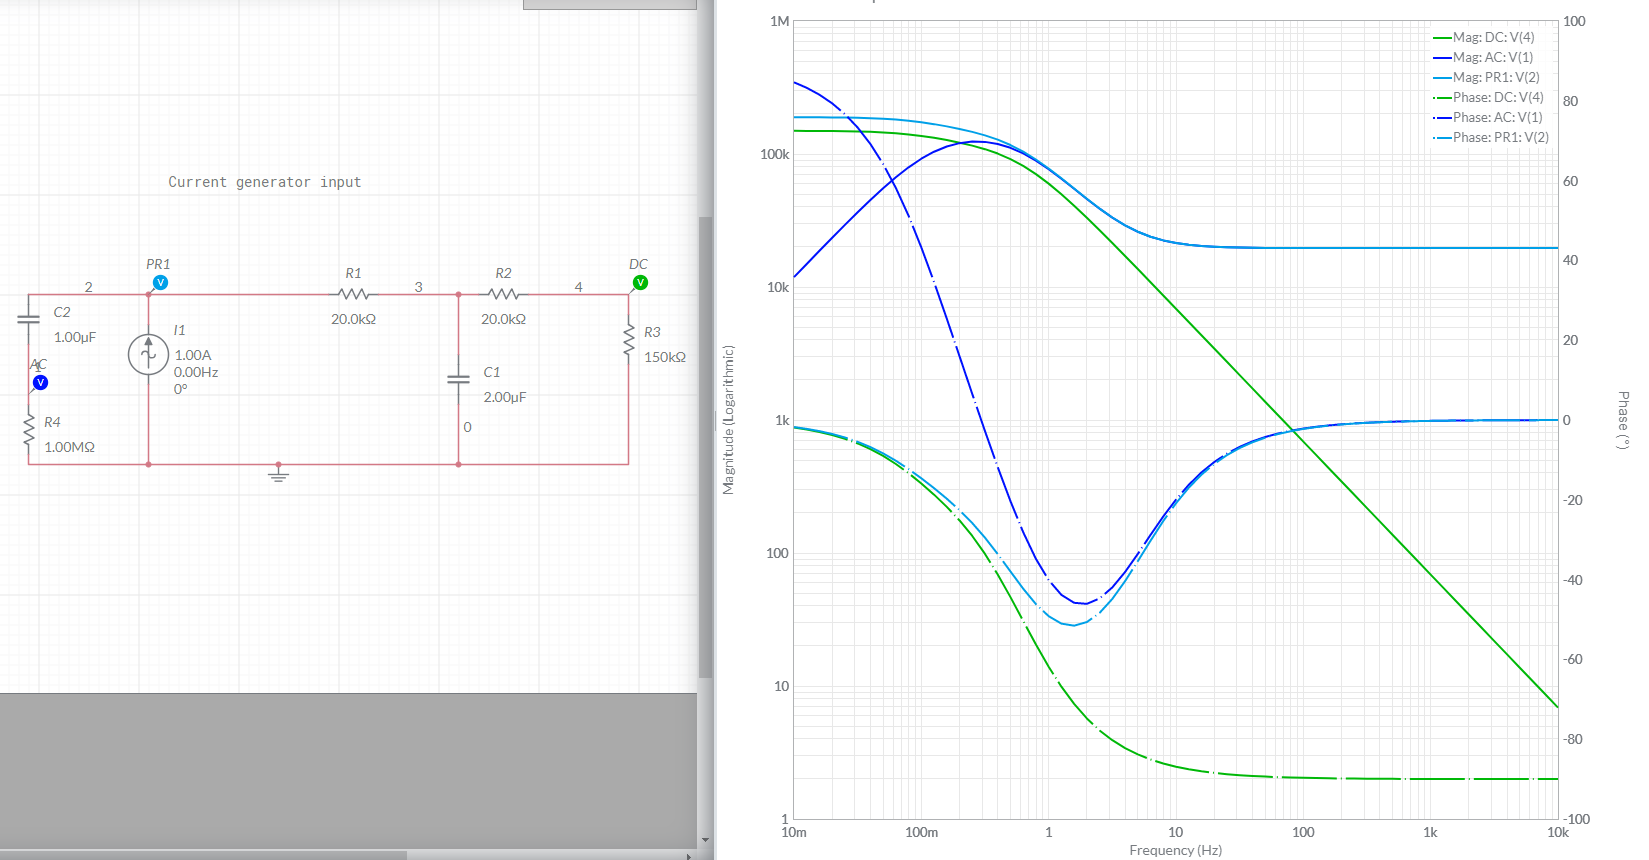
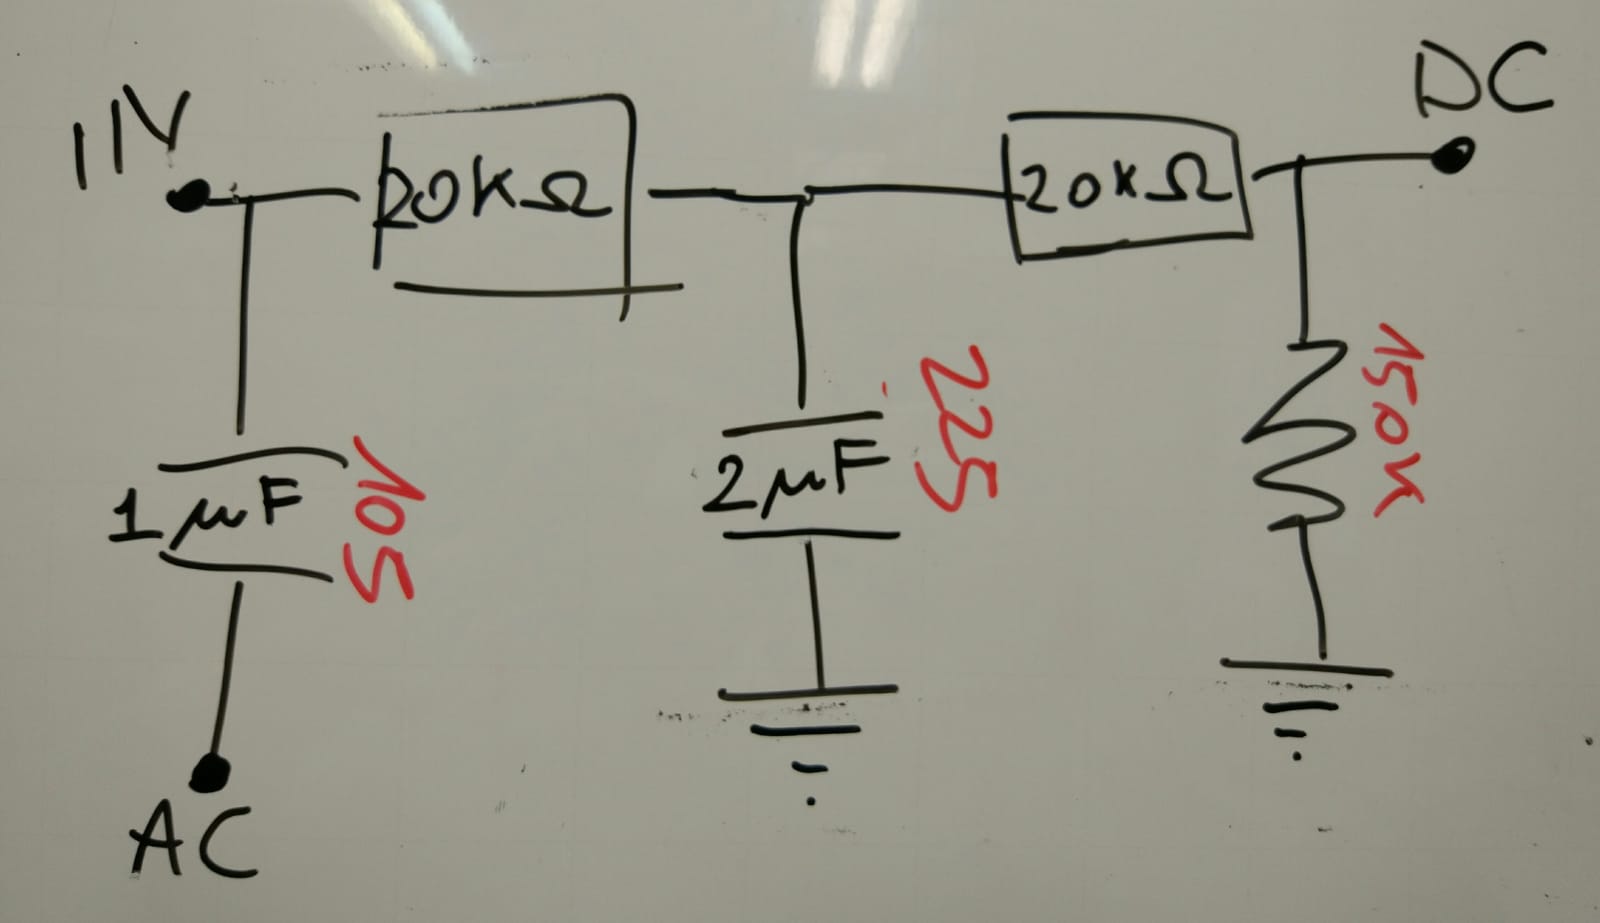
I simulated the box that separates the DC and the AC before input in the lock-in amplifier.
I drew the box with a voltage generator to show that the transfer function is a simple low pass filter and a simple high pass filter.
A more realistic simulation is with a current generator from the PD.
Today we have continued the investigations about the mode-cleaner transmission.
First of all we have tried to carefully align the cavity. To do that we have blocked one of the beams of the MZ and turned the polarization of the incoming beam to have the "p" polarization (lower finesse). In this way the peaks are broader and more visible. In the final alignment, the power in the 01/10 modes was of the order of a few % (see figures 1 and 2).
Note that, since in a 3-mirrors triangluar cavity the 01 and 10 are at different resonance frequency, we can align the vertical and horizonal directions and check immediately the effect on the peaks.
We have also measured the visibility of the cavity using the reflected DC photodiode. Note that when the the two beams of the MZ are present, the photiode saturates and then we put an optical density OD1 in front of the photodiode.
Measurements with the cavity locked
We have made three measurements. All the powers are in mW
1) MZ blocked - "p" polarization
trans = 6, in = 7.6, ref = 1.2, end 0.03
--> transmitted power = 79%, reflected power = 16%, Losses = 5%
2) MZ blocked - "s" polarization
trans = 4.5, in = 7.6, ref = 1.5, end 0.26
--> transmitted power = 59%, reflected power = 20%, Losses = 21%
3) MZ unblocked - "s" polarizaton
trans = 11.7, in = 18, ref = 4.2, end 0.6
--> transmitted power = 65%, reflected power = 23%, Losses = 12%
Measurement with the ramp
In the three cases the cavity visibility (1-R_res/R_nores) ~ 20%, which is in rough agreement with the measurements with the cavity locked.
Conclusions
1) the measurement of the cavity visibility ~ 20% (and the reflected power at resonance) seems to exclude a problem of asymmetry in the in/out mirror reflectivities.
2) a transmission of the order of 80% for "p" polarization and 60% for "s" polarization is possible. The 80% transmission for "p" polarization is compatible with the lower finesse of the "p" polarization.
3) we still have some non understood losses. More investigations are needed.
Figure 1 and 2 shows the alignment conditions with "p" polarization (we see that the high-order modes are a few %).
Figure 3 shows the cavity visibility
Participants: Matteo B., Yuhang, Eleonora
In entry # 876 we reported a computation about the difference between the reflectivity of the input and output MC mirrors needed to explain the low transmission. The results in that is has to be of the order of 0.5%
In order to see if the low transmissivity of the green MC is due to such a difference, we have changed the input and output mirrors, hoping to find a combination with smaller difference.
The mirrors installed belong to a batch of 6 mirrors with nominal reflectivity 99.2%. (see pic in entry 850). Among them 2 have been used in the mode cleaner, other 2 have been used to extract pick off of the MC reflected and transmitted beam. One was still in the box and the last one I don't know.
Here the different combination we tired:
| in | out | tra pickoff | spare | transmissivity | |
| initial | 1 | 2 | 3 | 4 | 44% |
| 12/07 | 3 | 2 | 1 | 4 | 45% |
| 17/07 | 3 | 1 | 2 | 4 | 35% |
| 17/07 | 3 | 4 | 2 | 1 | 56% |
The best results have been found with the last configuration
INPUT POWER : 23 mW
TRASMITTED: 13 mW
REFLECTED: 7 mW
We added a lamba/ 2 to improve the polarization and we observed that we can get rid of the broad mode observed in the spectrum.
The alignment was good but can be further improved.
Note that between the second and third configuration I have reduce the modulation depth sent to the 15.2 MHz EOM of a factor 2 (selecting 1/2 scale in the windows 'channel control' of the DDS software). As expected it improves the transmissivity of few percents. The lock of the SHG doesn't seem affected by this change.
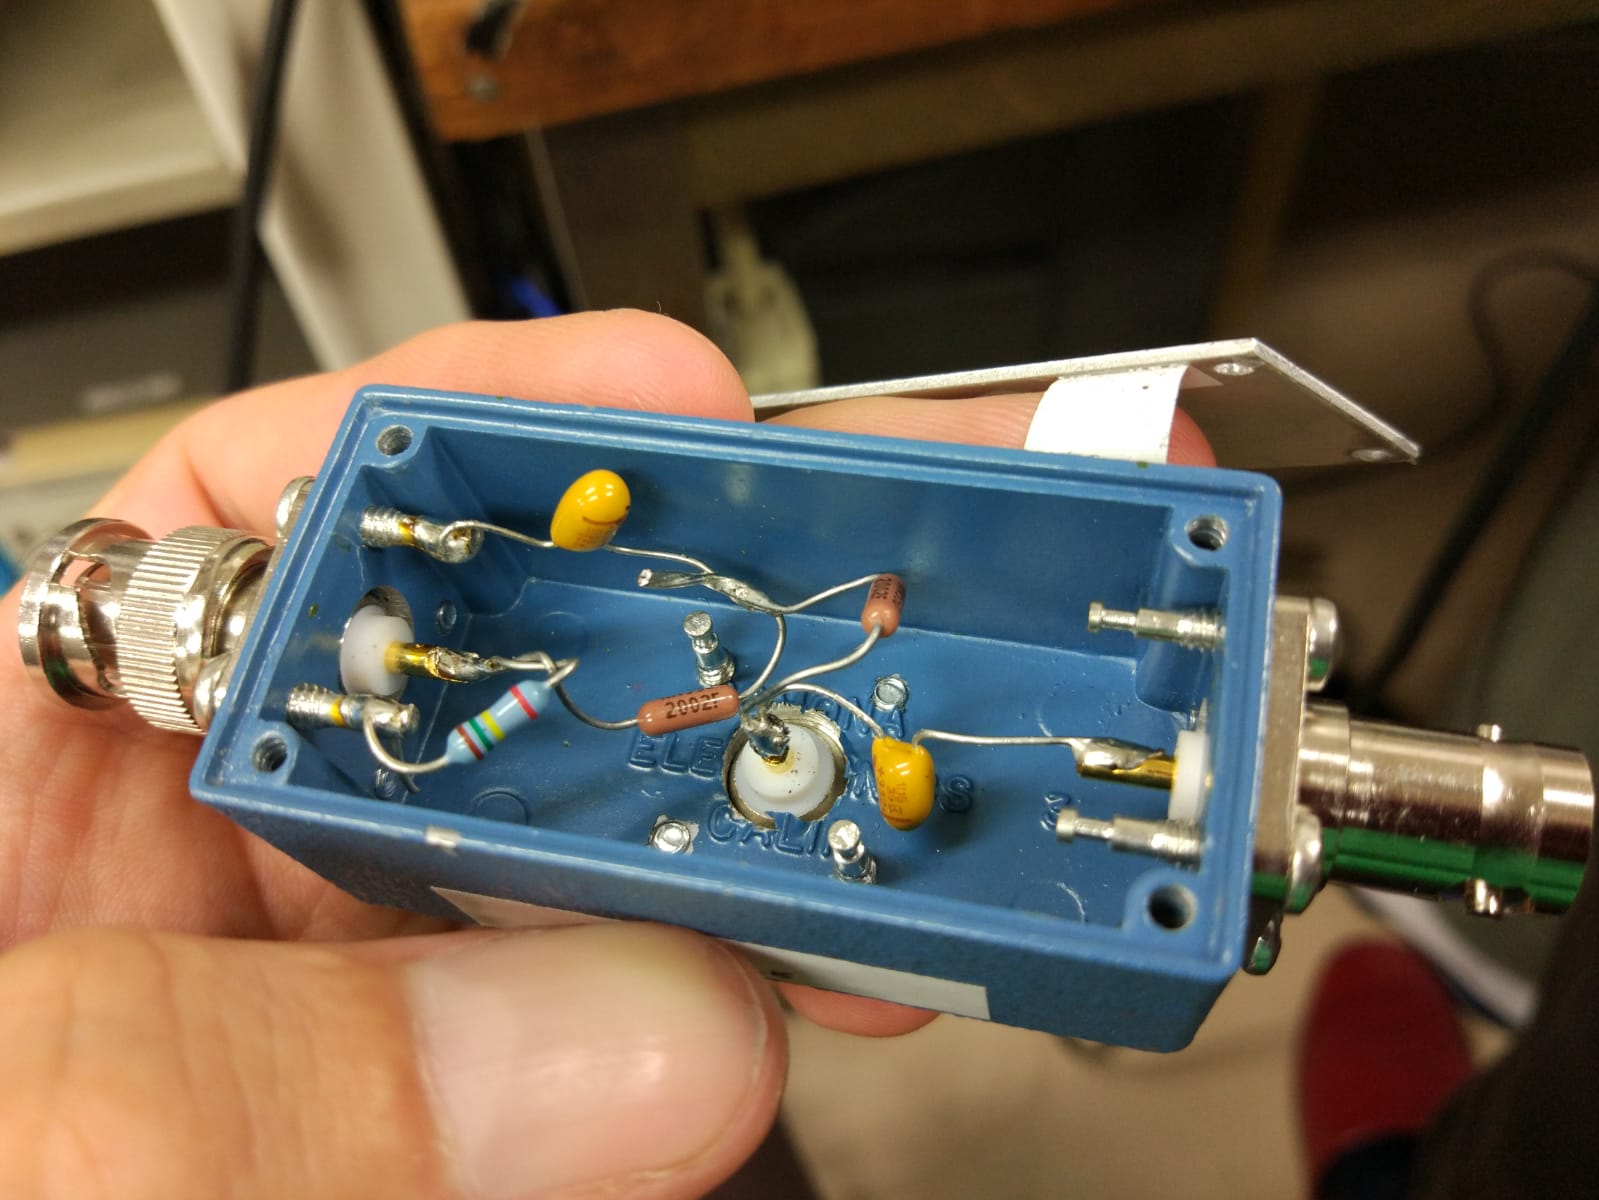
I upload the circuit diagram of the box used in the original setup from the SPTS company. (they made it)
I'm still using it in the current setup, but since the InGaAs PD has a higher Current/Power responsivity, It could be that I should reduce the load resistance and send more power on the PD. If it helps to reduce the noise, I will make a new box for the InGaAs PD.
Using the Yokogawa2400 spectrum analyzer I measured the correlation between the signals coming from the two photodiodes:
- PM100D (incident power 85mW) DC 470mV, analog out
- DET10N (incident power 15microW) DC 104mW (load resistance 6kOhm)
The signals don't look coherent. It could be that they are really not coherent, or that the spikes at high frequencies invalidate the spectrum measurement.
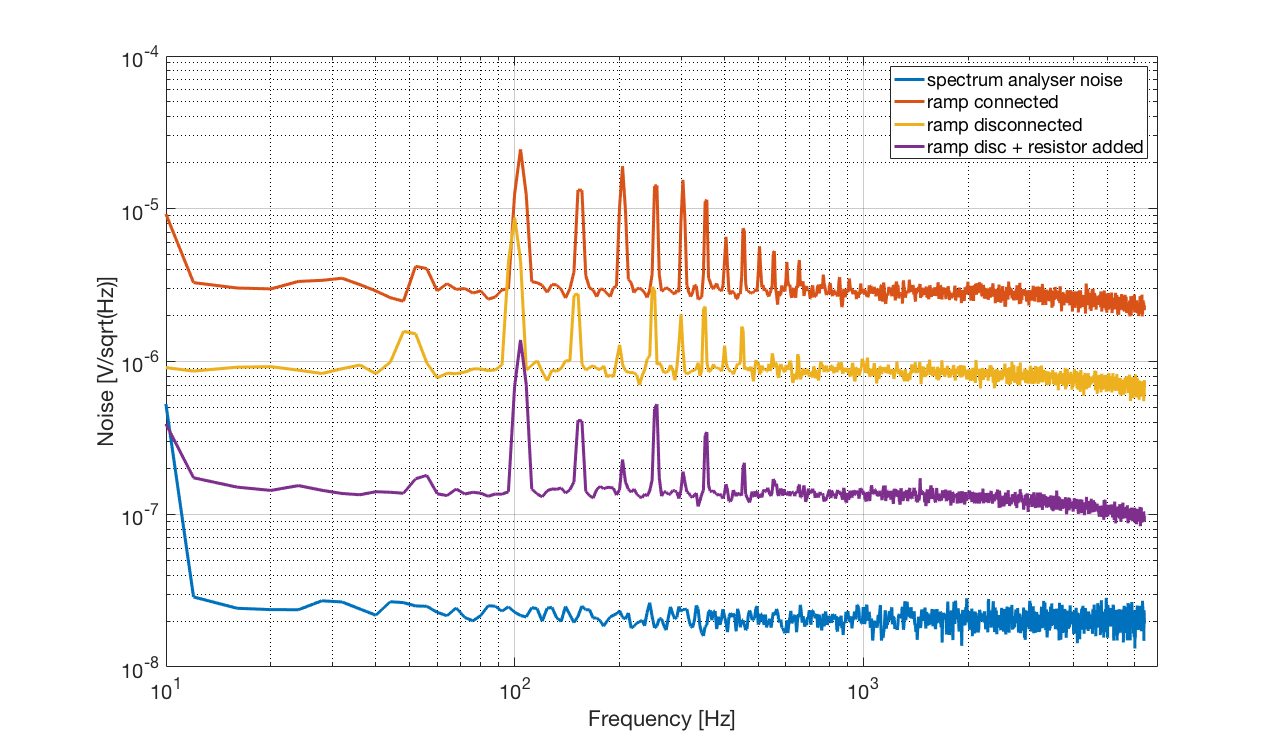
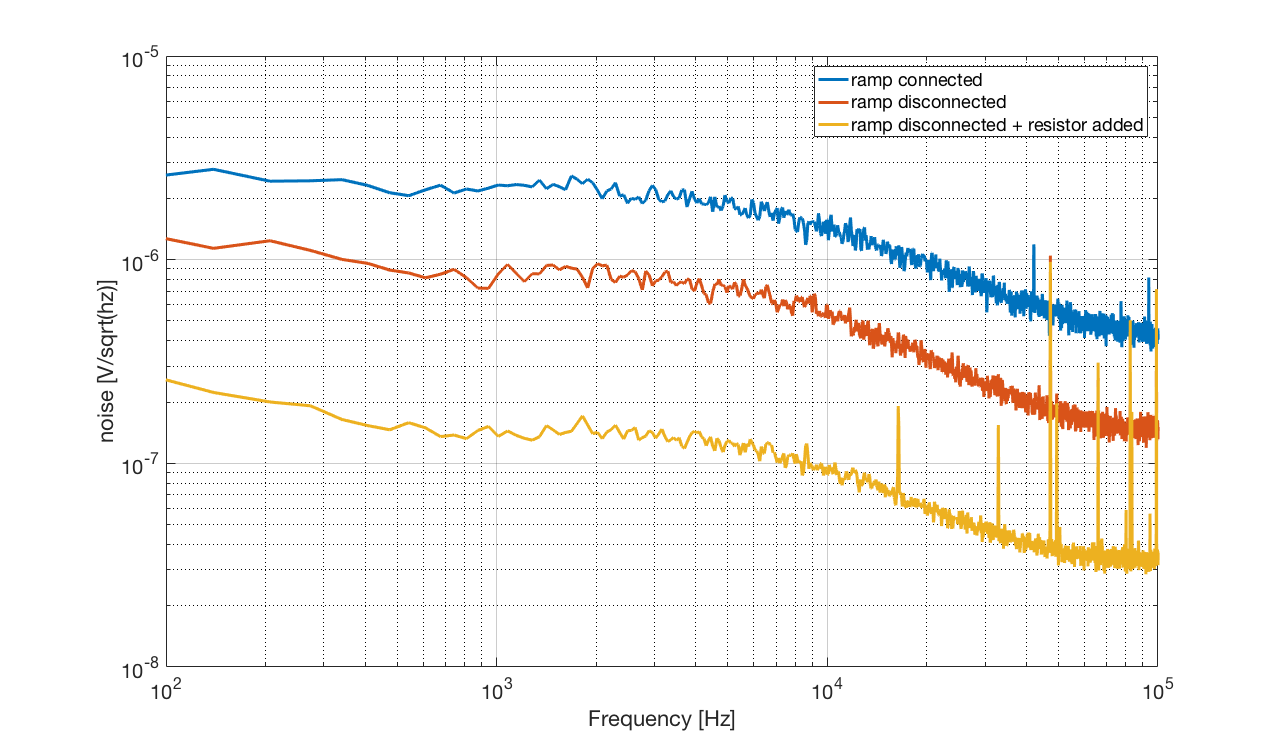
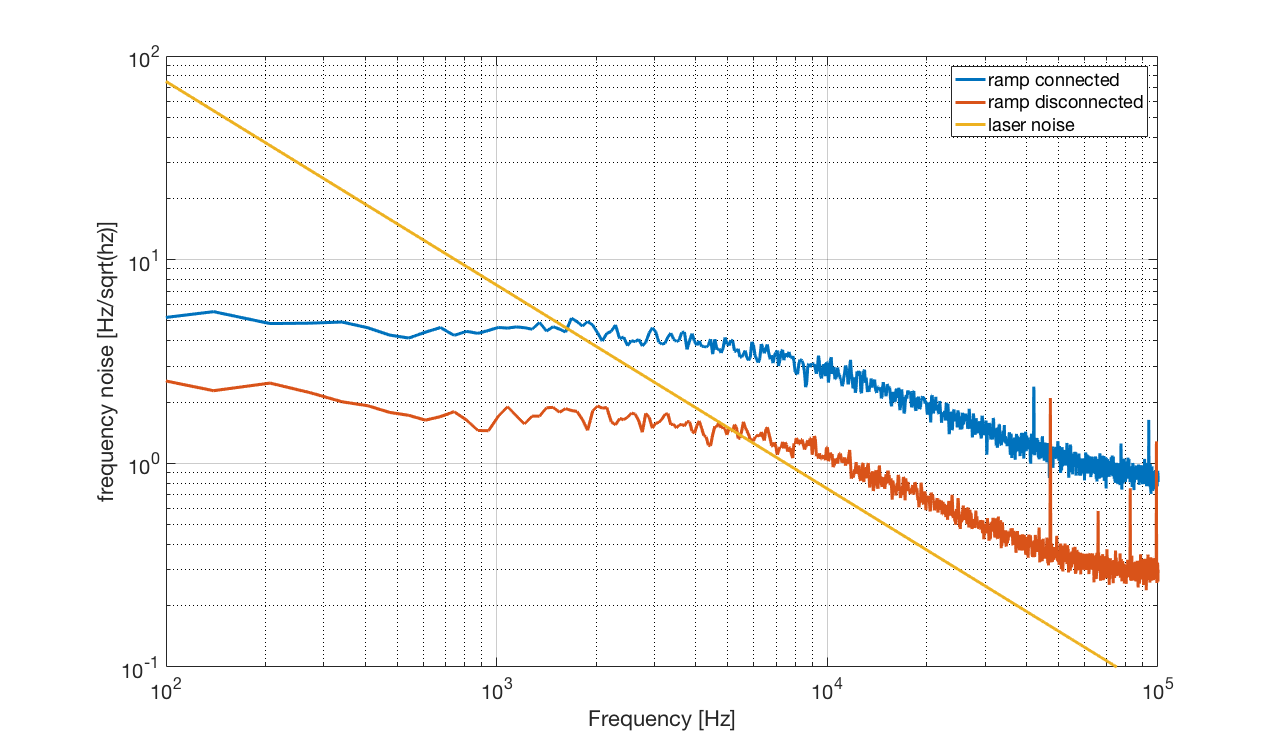
After having disconnected the potentiometer of the ramp in the actuator section of the rampeauto (see previous entry # 875) we have further modified the rampeauto to reduce its noise. Following Pierre's instructions, we have soldered a 2.2K resistor in parallel to the resistor R24, in order to reduce the gain of the PA83 amplifier and then the effect of its input noise. In practice, since the resistor R24 was difficult to access, we have put the resistor in parallel with C23.
- The attached PDF shows the electronic scheme of the rampeauto (actuator part).
- Figure 1 and 2 show the rampeauto noise taken at the PZT output without any input signal. We see that the rampeauto noise is reduced by a factor ~ 20 in the kHz region, as expected.
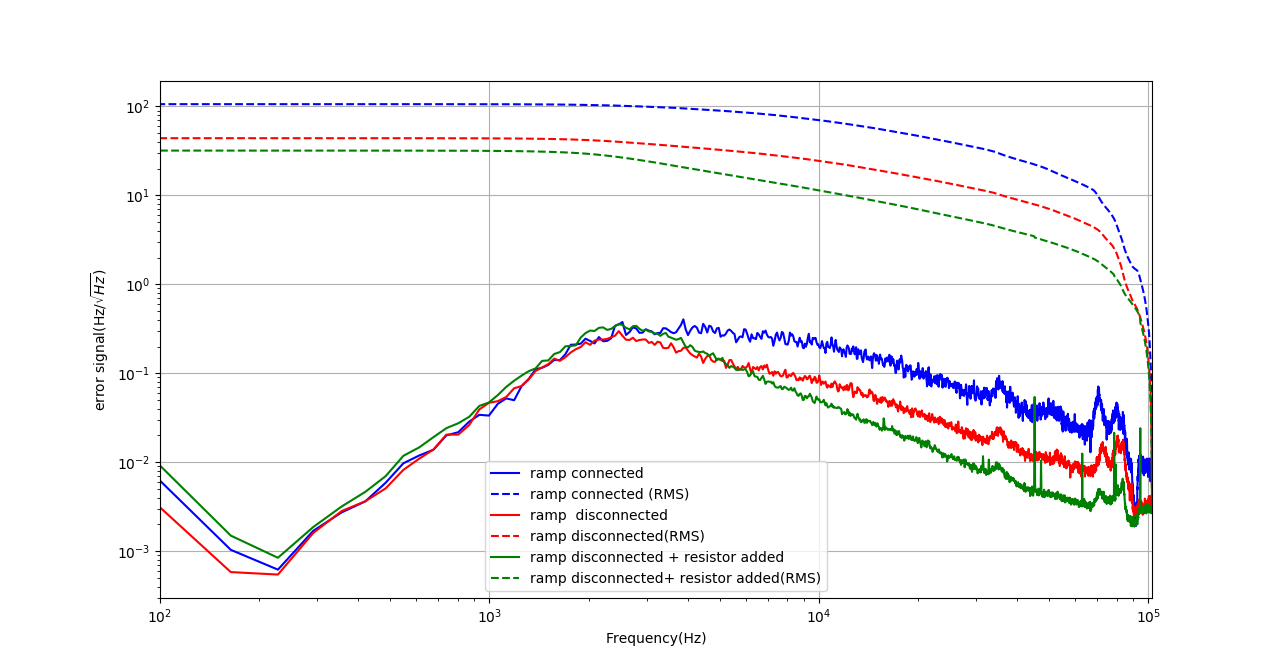
- Figure 3 shows the error signal of the filter cavity (green) with this new configuration, compared with the old ones. Note that, since now the gain of the P83 is reduced, we should increase the gain of the loop increasing the signal at the input of the P83 with the potentiometer "PZT gain". With respect to before, the error signal at high frequency is reduced by a factor ~ 8.
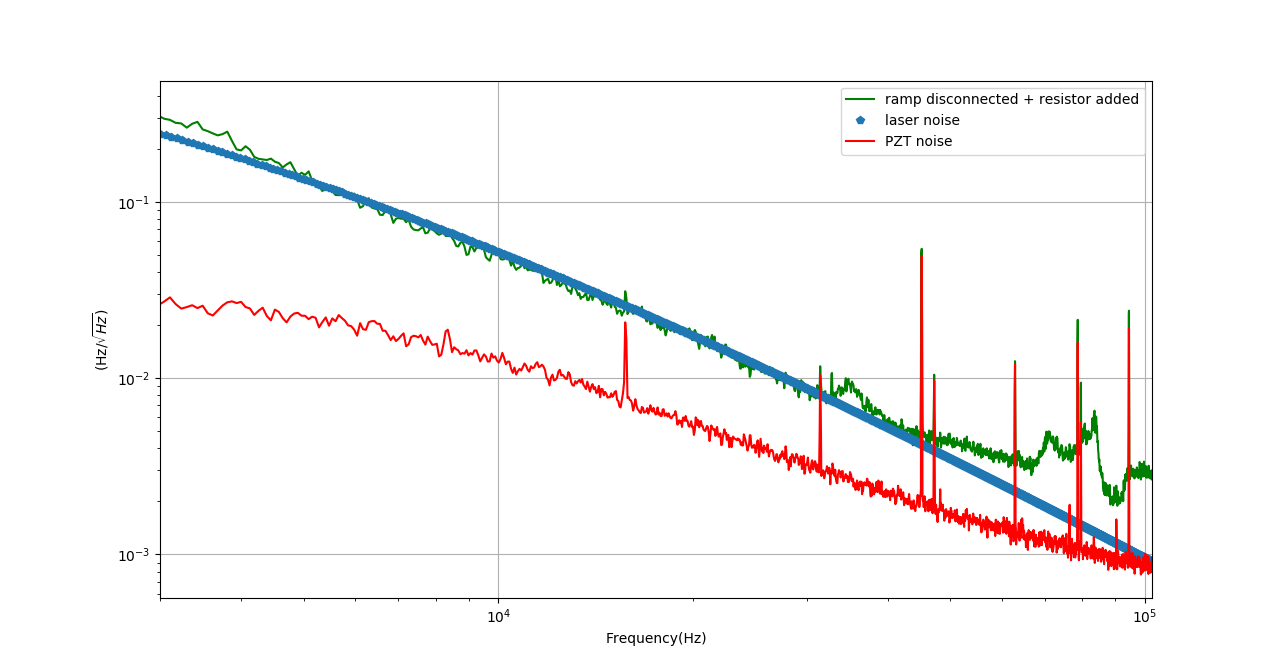
- Figure 4 shows the error signal of the filter cavity (green) compared with the noise projection of the laser frequency noise (7.5 kHz/f [Hz/sqrt(Hz]) and rampeauto noise. Both the laser frequency noise and the rampeauto noise have been filtered by the pole of the cavity (2.4 kHz) and multiplied by the open loop transfer function of the loop, which assumes a 1/f behaviour at f> 3 kHz and a unity gain frequency of 10 kHz. We see that with this new configuration the error signal of the filter cavity (green) is explained very well by the laser frequency noise.
Note that after the modification of the rampeauto it was not possible to obtain a ugf larger than 10 kHz. This should be understood better.

I repeated the same measurements with another spectrum analyzer, the Agilent35670a
This instrument spectra are much cleaner, I did only 32 averages instead of 256 with the Yokogawa sa2400
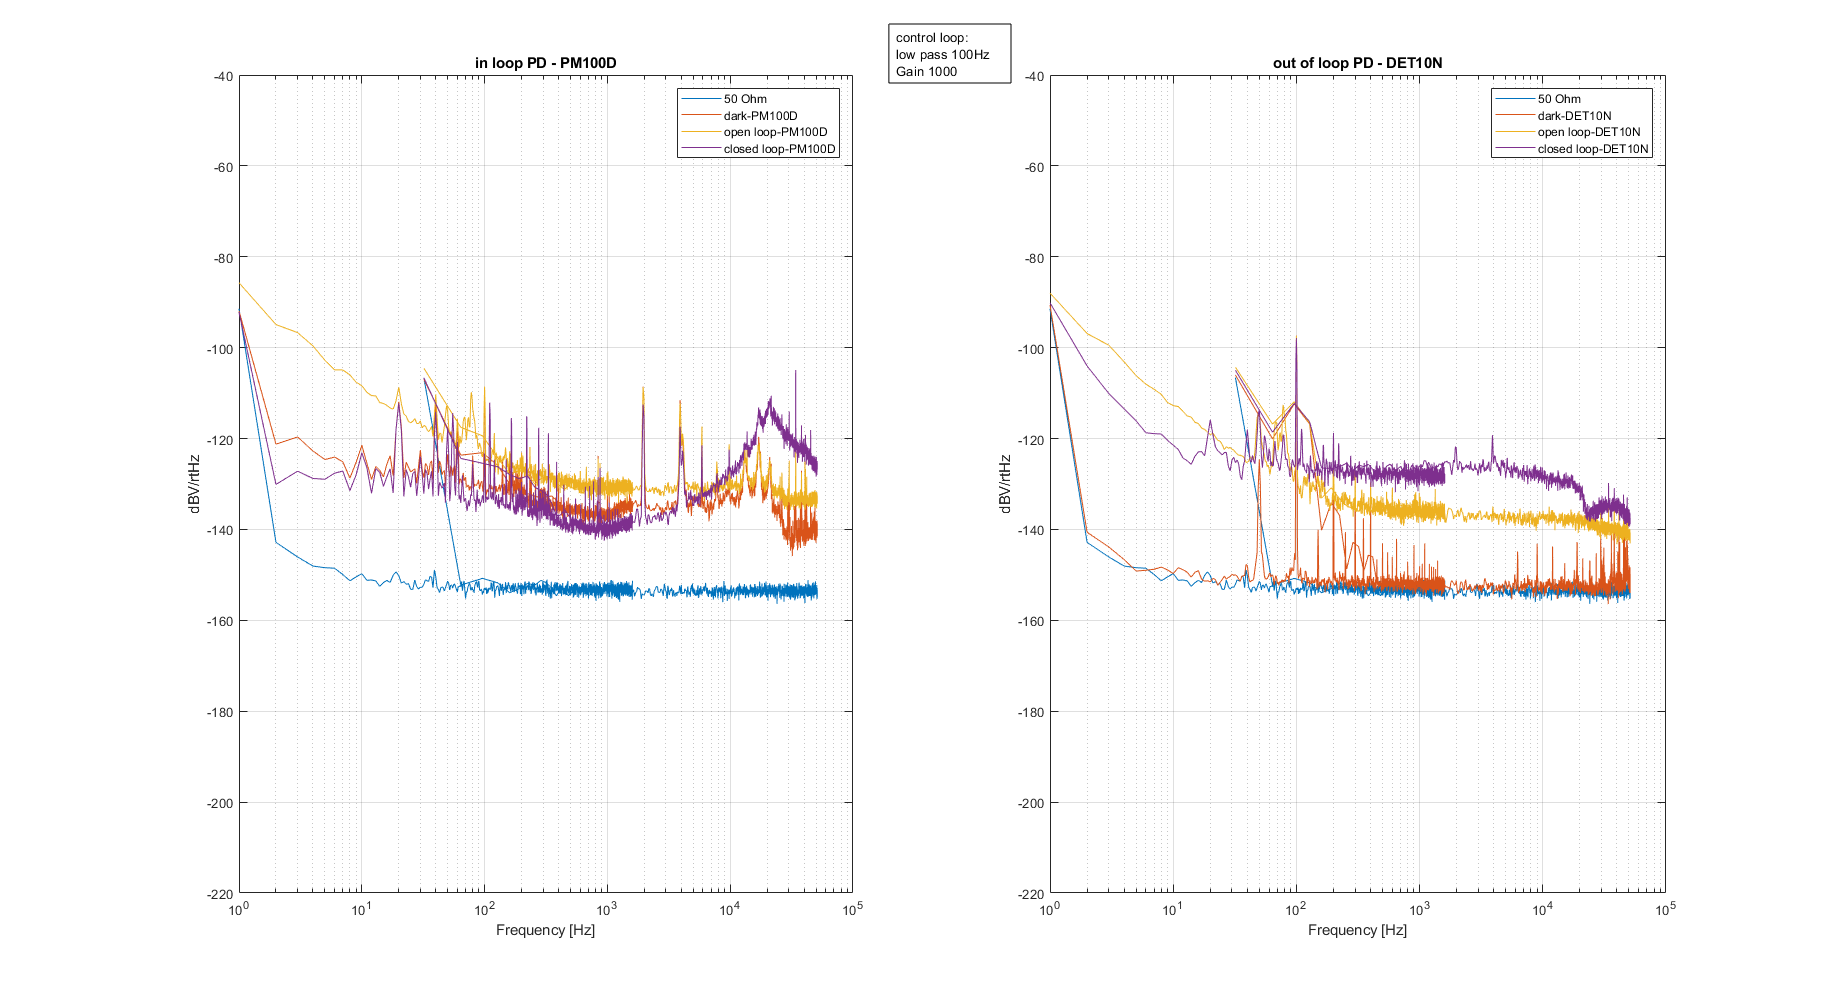
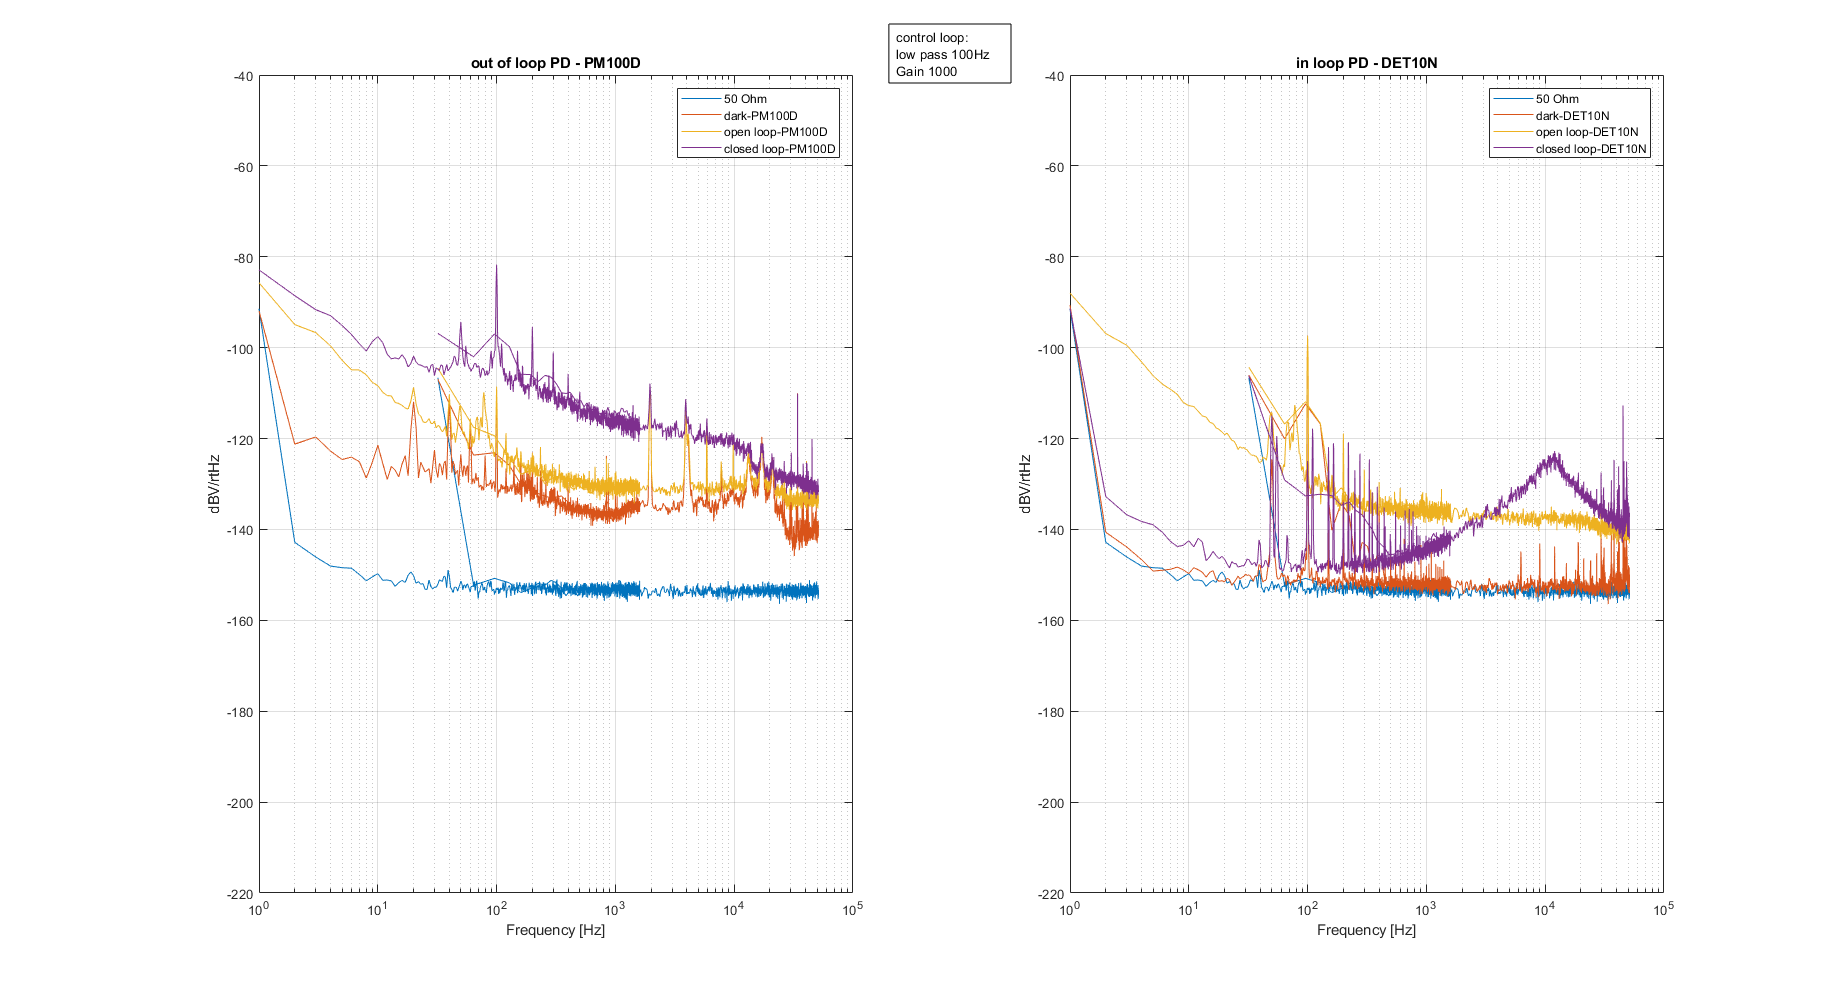
First plot: gain 1000 in-loop pd: PM100D
Second plot: gain 1000 in-loop pd: DET10N
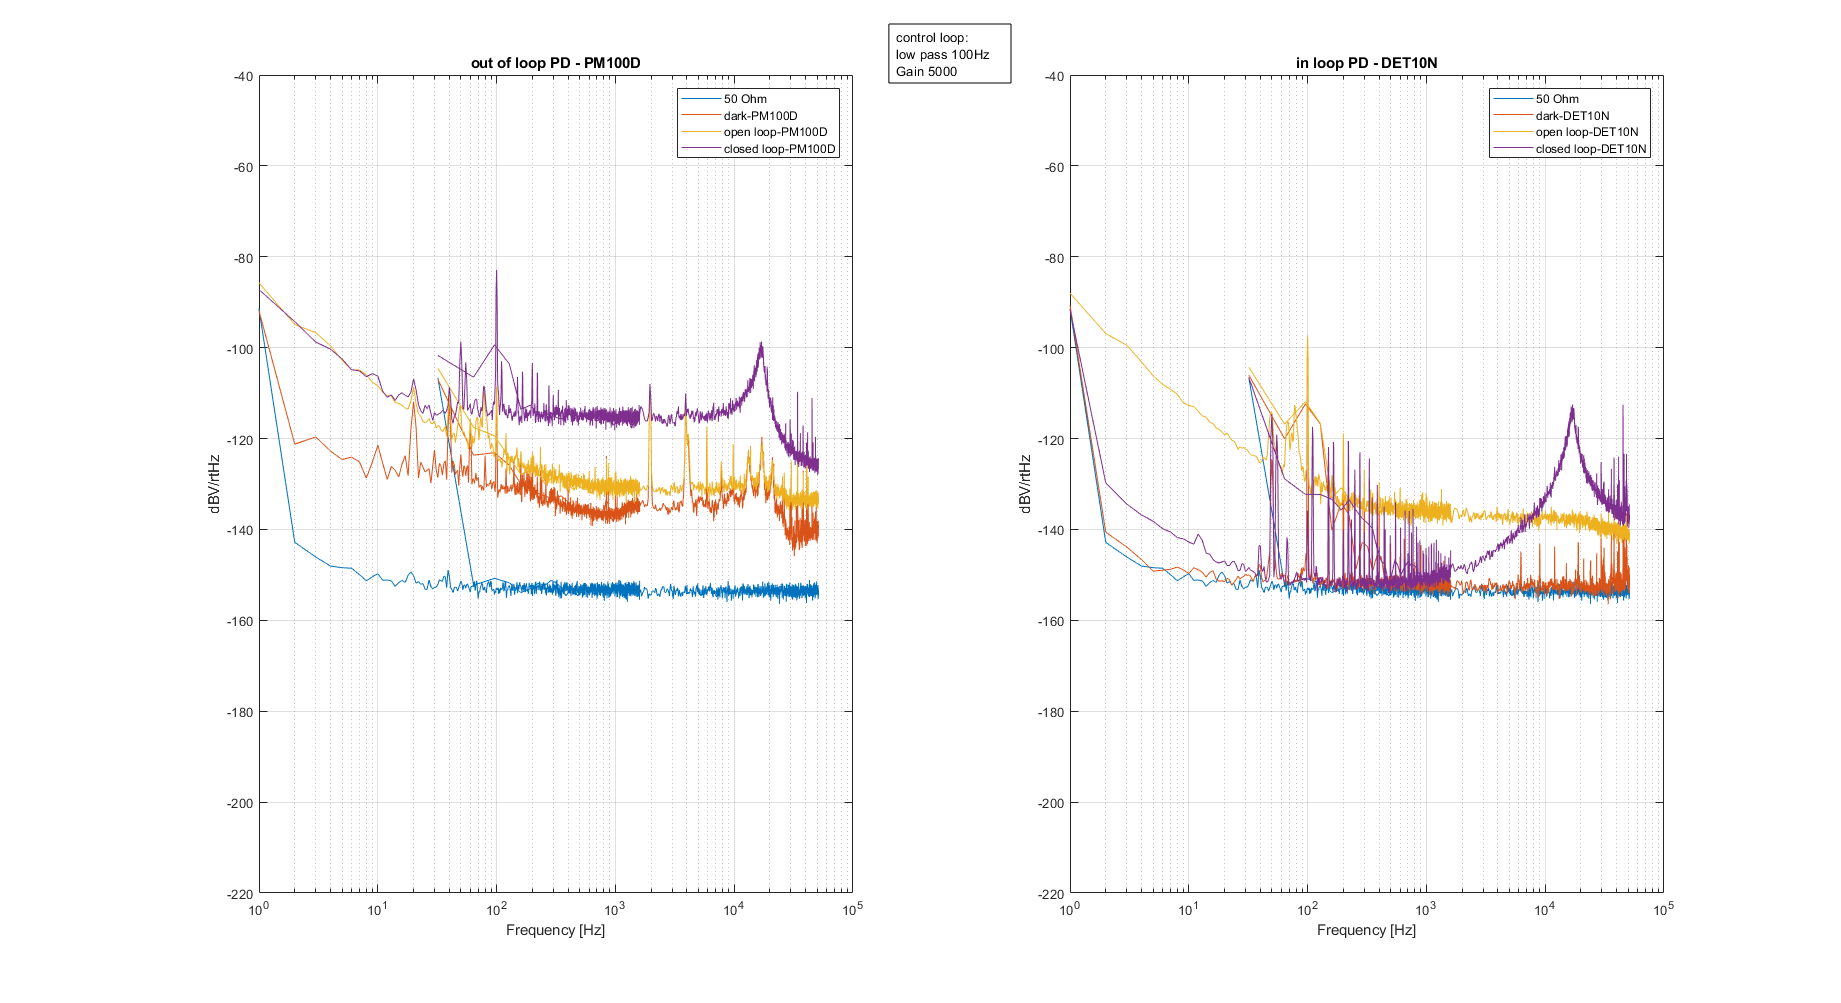
Third plot: gain 5000 in-loop pd: DET10N
Participiant: Matteo.B, Yuefan and Yuhang.
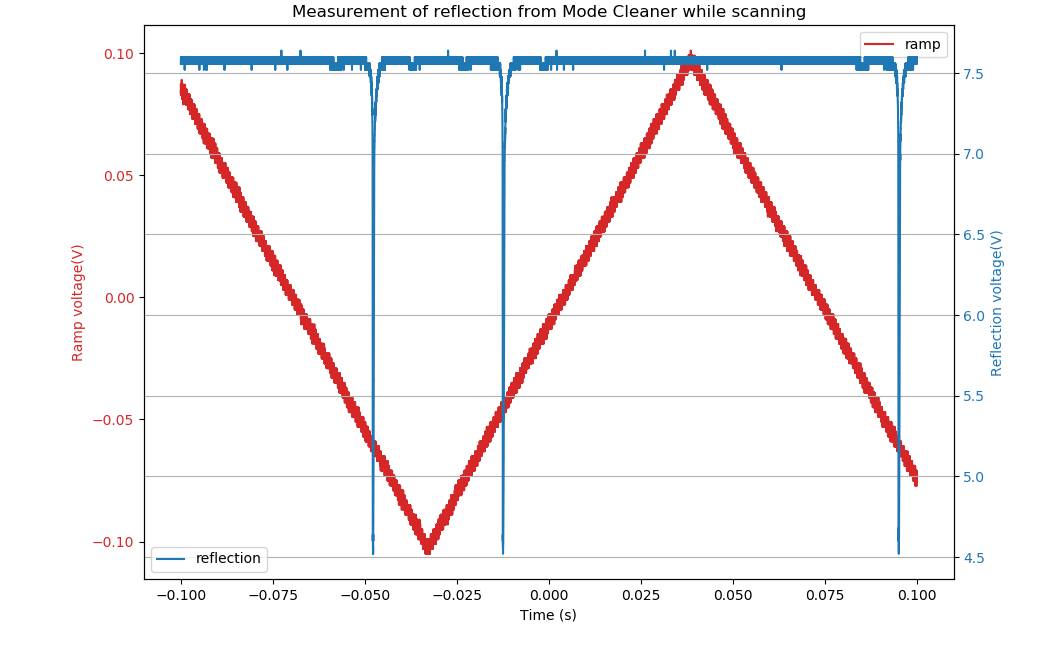
Yesterday, we installed a photo dector(PD) to monitor the reflection of green mode cleaner. This PD was put in the path which is the pick off of green reflection. And the monitor point has almost all the reflected power.
Then we scan the mode cleaner by sending a ramp signal to the mode cleaner. Actually here I made a mistake which was mentioned by Matteo.L before, but I didn't pay attention. It is I use a very large ramp amplitude, which is 700mV p-p. In that case, the scan is very fast. So I cannot see the reflection peak. See attached Figure one.
Then we decrease the ramp amplitude to 100mV. And we can see the reflection peak.
We can see from the figure 2, when we are in the resonance, the reflection is around 55%.
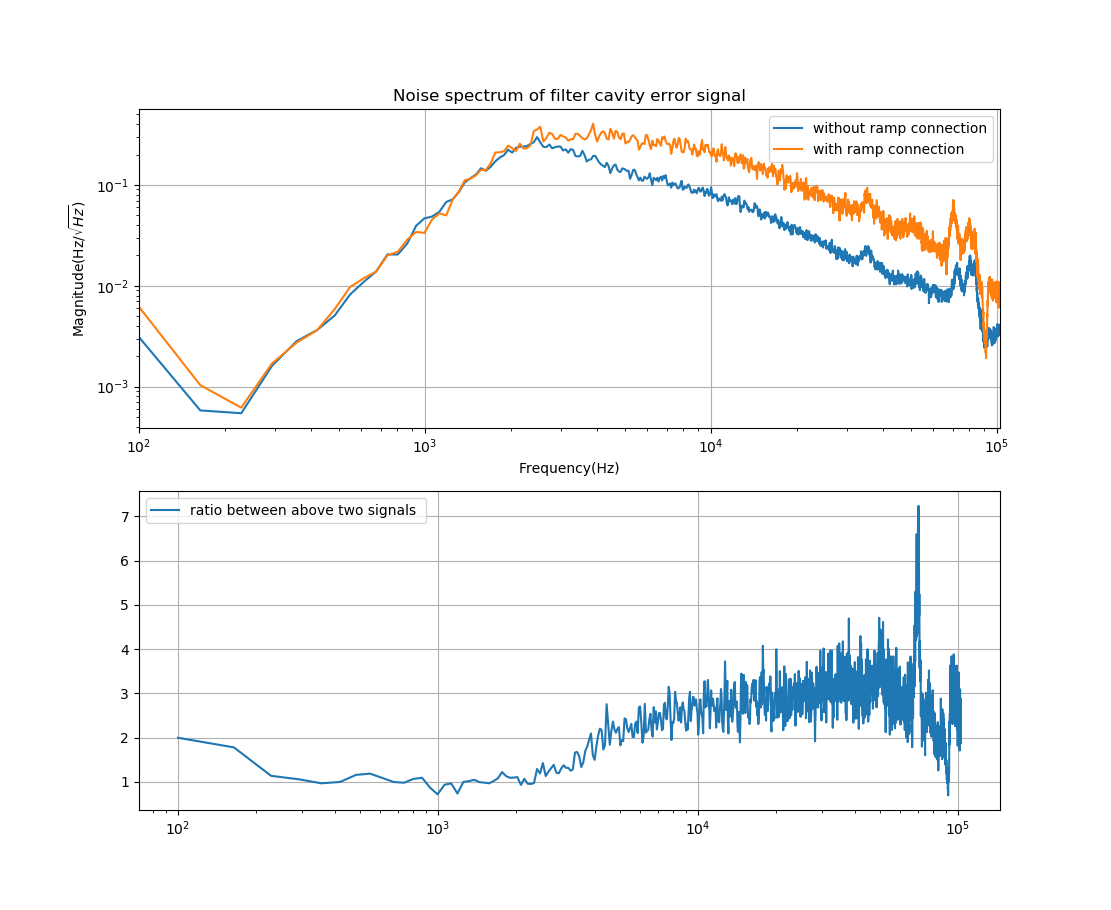
We compare the green error signal spectrum before and after the disconnection of Ramp injection point in the circuit. We can see the noise level is reduced by a factor up to 3 from 2kHz.
I mwasured the power loss due to detection point is not exactly the point of reflection and transmission.
For reflection, we lose 1%(0.12mW) of power. For transmission we lose 0.8%(0.097mW) of power.
So the loss of 2.56mW cannot be explained by this.
Manuel, Matteo B, Eleonora.
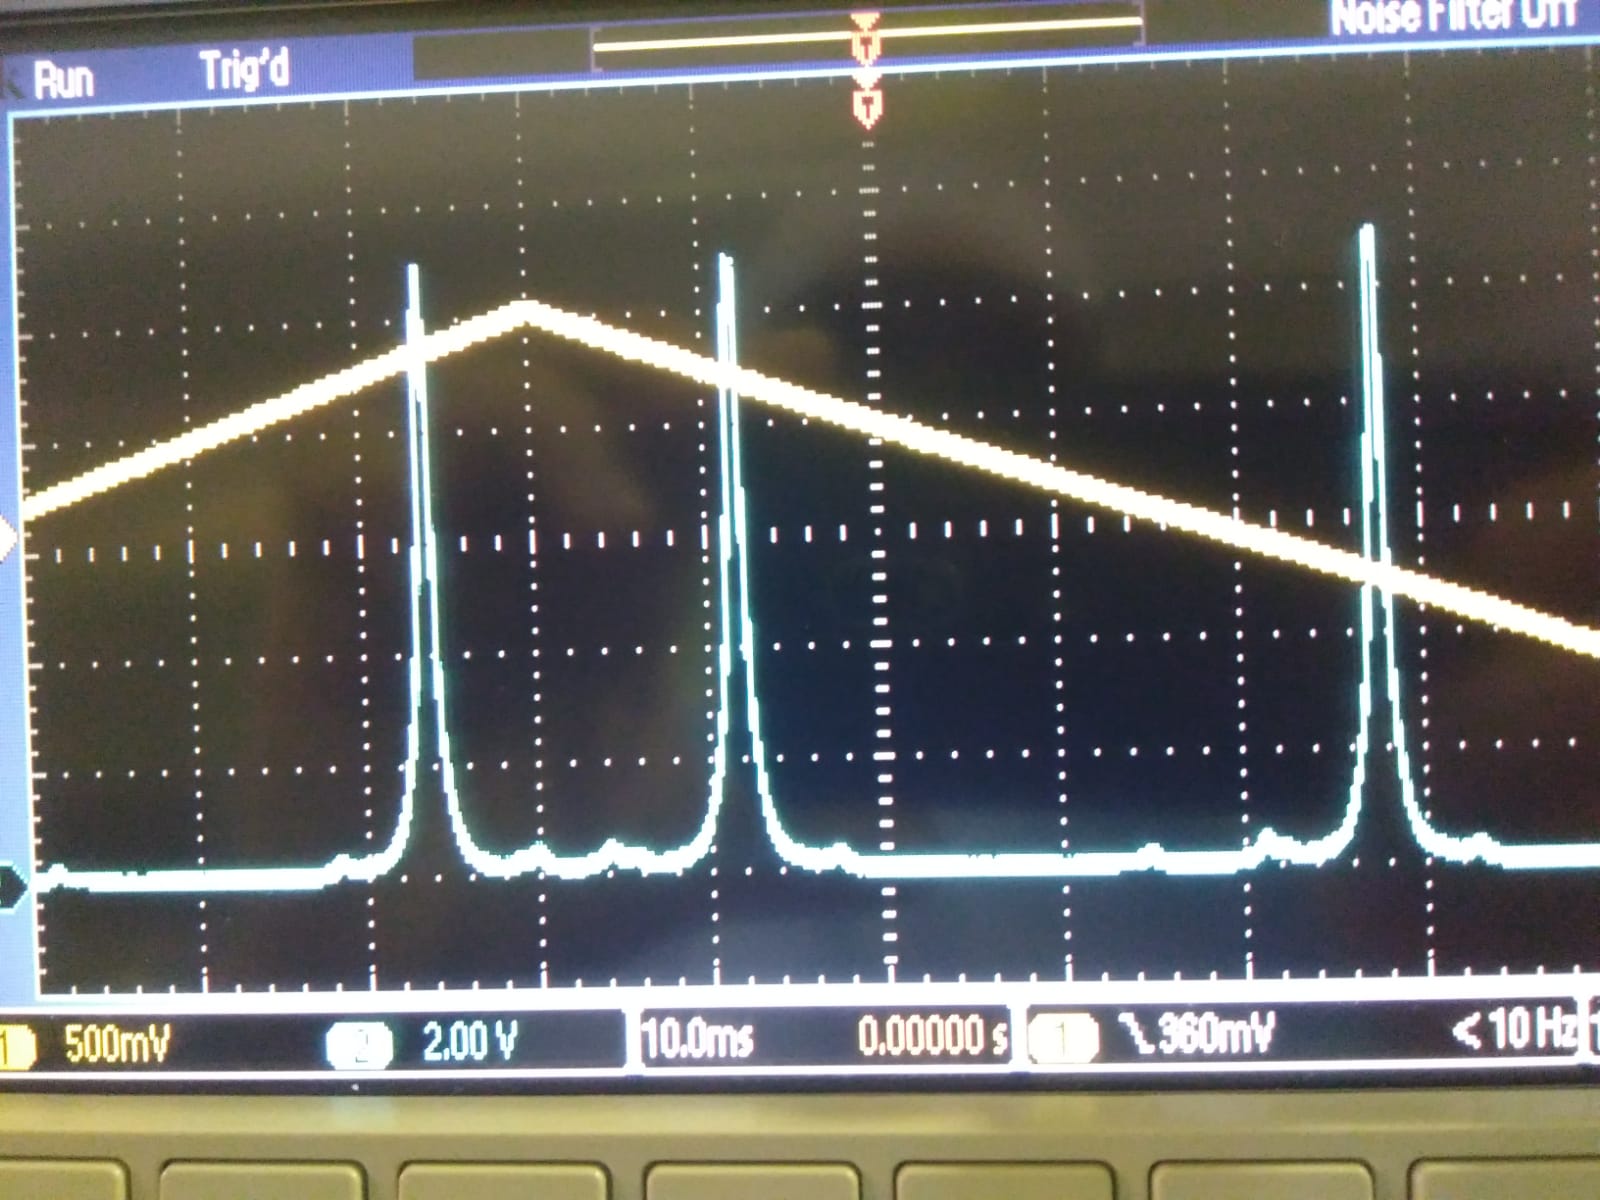
I recorded a first video of the signal of the photodiodes on the oscilloscope without control loop .
Channel1 (yellow) is the out-of-loop PD (DET10N) with a load of 6kOhm that gives 104mV of DC.
Channel2 (blue) is the in-loop PD (PM100D) analog output. DC = 470mV
The noise is mostly at high frequencies. The PM100D shows some spikes, while the DET10N doesn't.
The loop consists of a subtraction of an offset from a waveform generator, then a low pass (order one) at 100Hz and a Gain of 1000 (using the sr560)
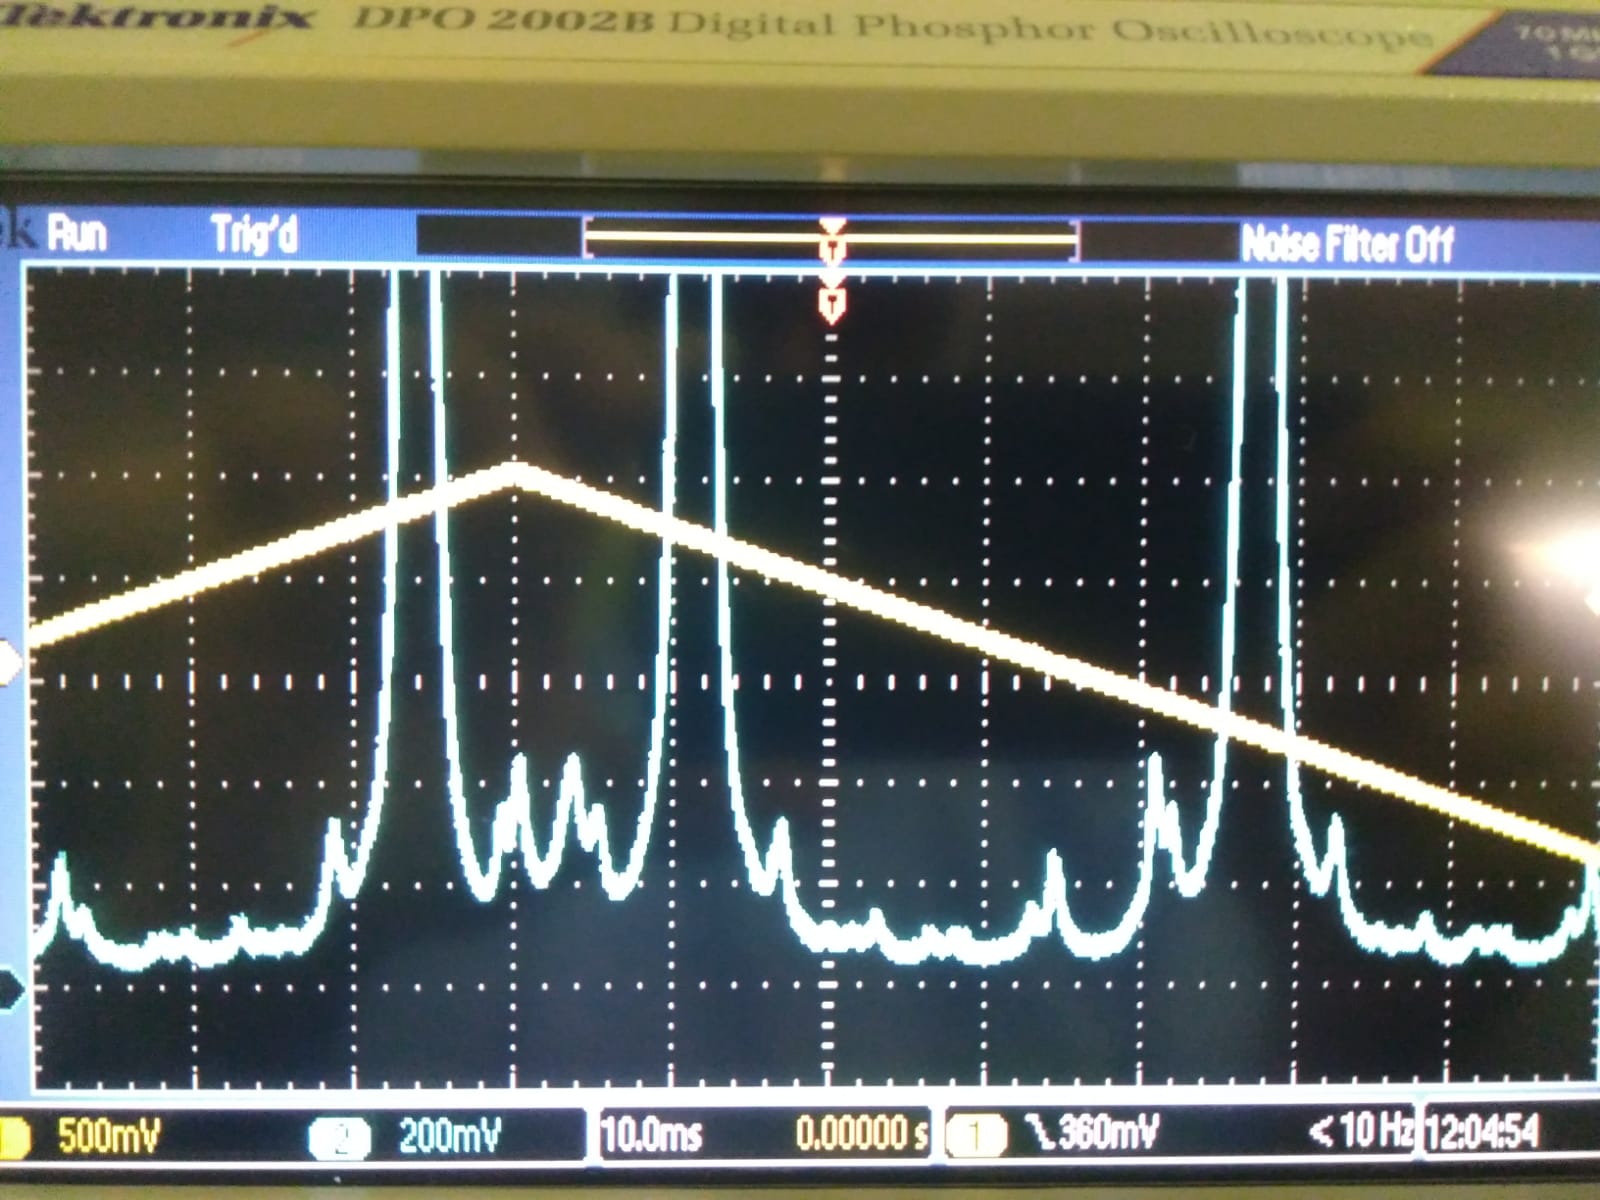
I recorded a second video around the moment of closing the loop. On the oscilloscope there are the signal of the in-loop photodiode (blue channel), and the correction signal (yellow channel).
It shows that the in loop PD increases the noise when closing the loop. This is because the noise is mostly at high frequencies and the noise reduction at low frequencies doesn't show clearly in the time domain.
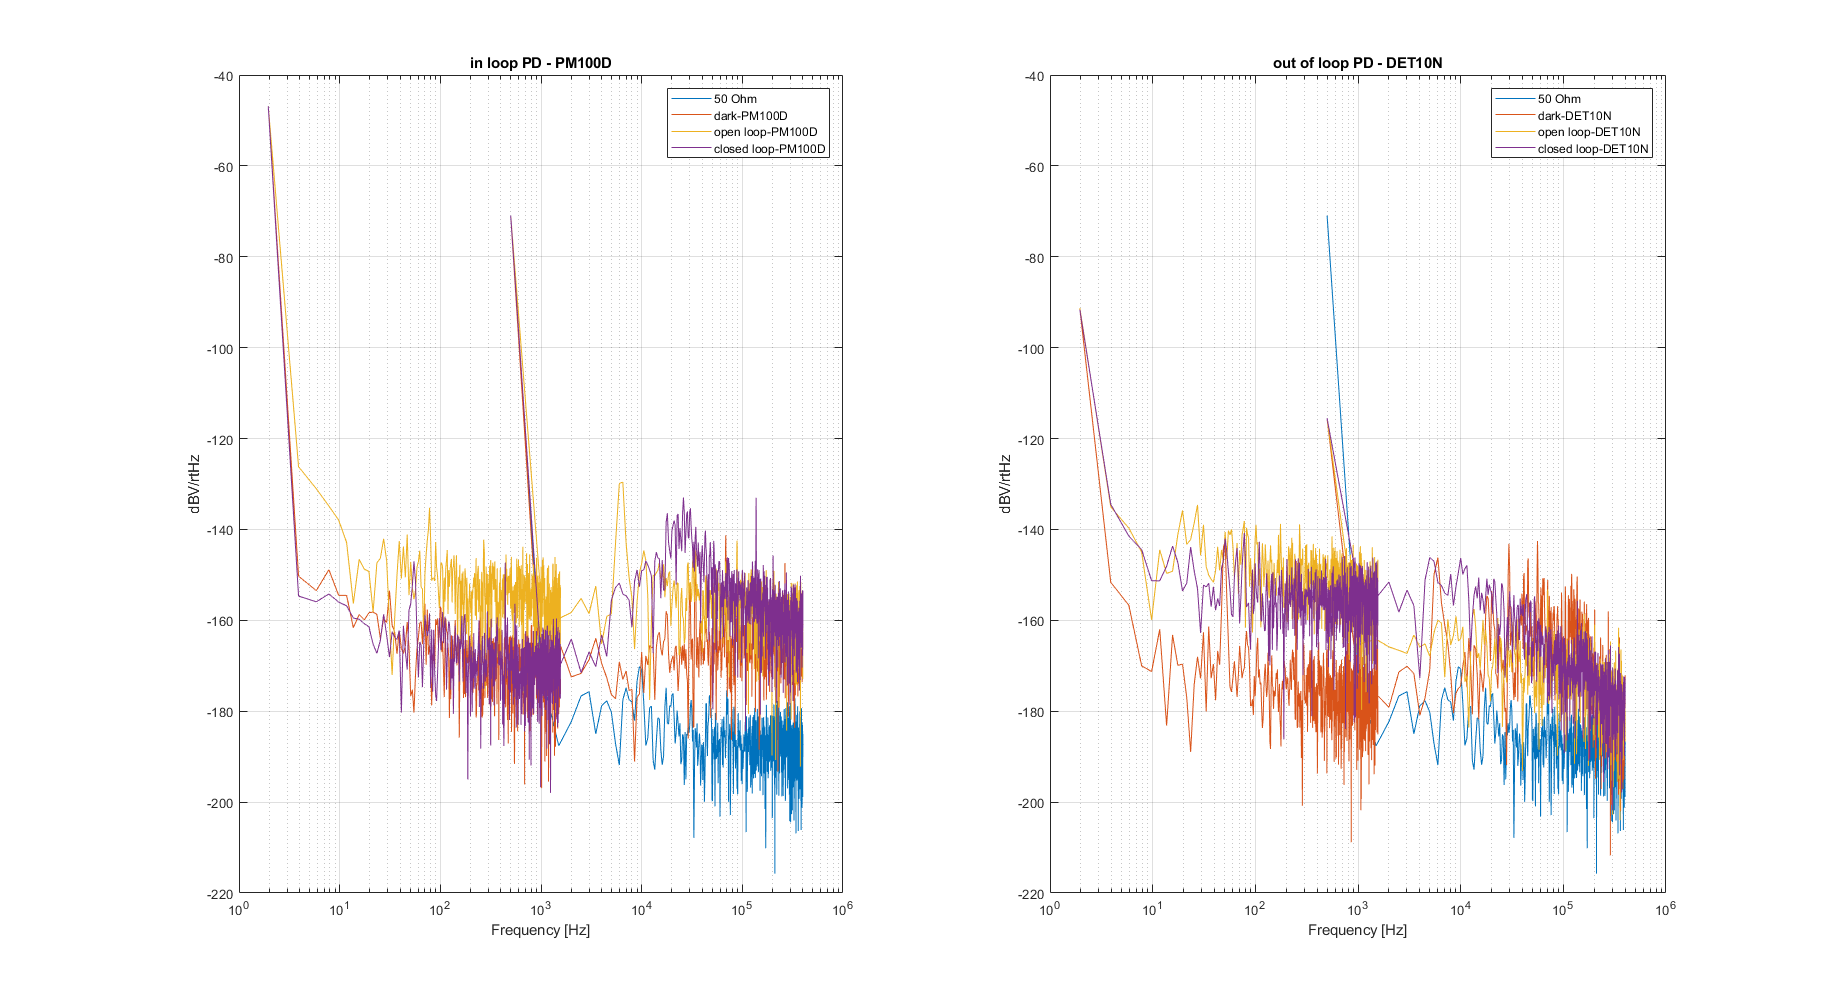
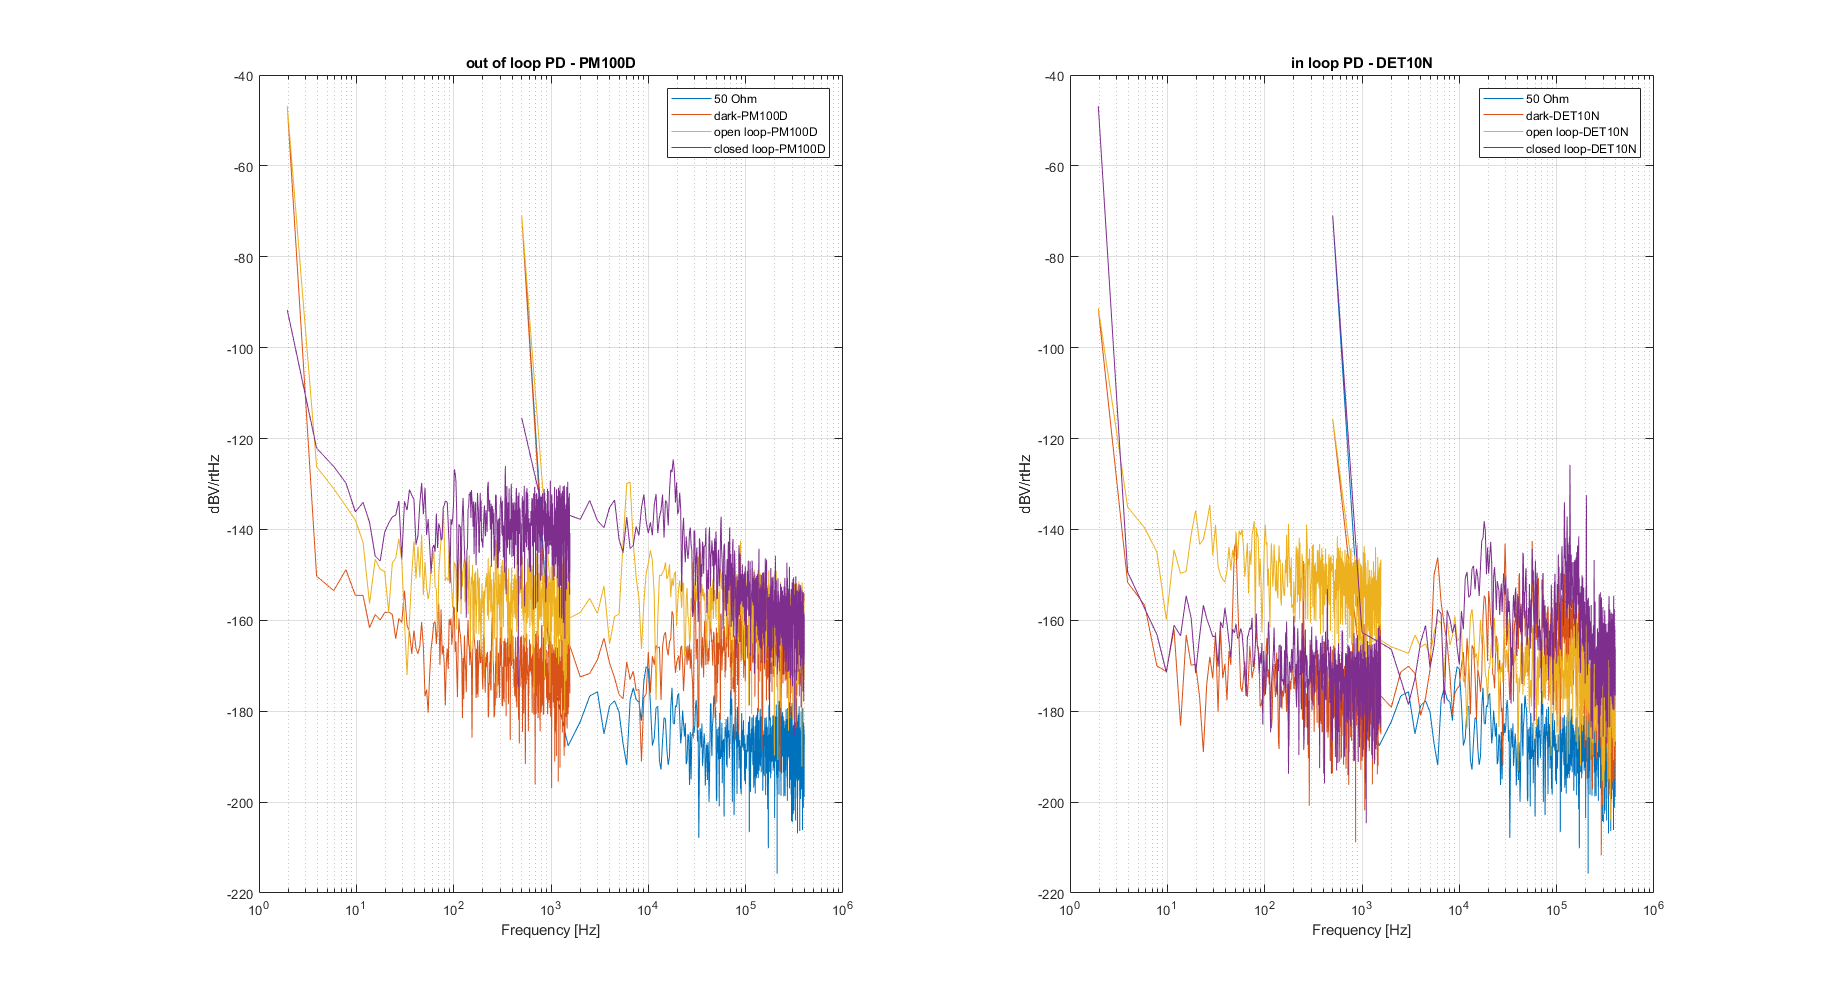
Plot1: I made the spectrum of the 2 PDs in 3 conditions: dark, loop open, loop closed
It shows that the loop works for the inloop PD, but it doesn't for the out of loop PD.
Plot2: I exchanged the two PDs, so in this case the out-of-loop PD is the PM100D and the in-loop PD is the DET10N.
I copied the dark and openloop curves from the plot1 and I updated the closed loop curves. In this case I could increase the gain to 5000.
I repeated the same measurements with another spectrum analyzer, the Agilent35670a
This instrument spectra are much cleaner, I did only 32 averages instead of 256 with the Yokogawa sa2400
First plot: gain 1000 in-loop pd: PM100D
Second plot: gain 1000 in-loop pd: DET10N
Third plot: gain 5000 in-loop pd: DET10N
Participiant: Yuefan and Yuhang
Today we locked the MC and Mach-Zehnder(MZ). We found some problems while locking.
1. The lock of MC sometimes has drifting. It brings the locking point to a lower point.
2. The error signal for MZ locking has a fixed frequency oscillation.
3. Sometimes we can see the MC transmission goes away very large.
We tried to make sure the MC transmission has the same level and then make the measurement.
| input(unlock) | 27.51mW | 0.002 |
| reflec(lock) | 11.96mW | 0.002 |
| trans(lock) | 12.17mW | 0.007 |
| end mirror loss | 0.814mW | Nan |
The second cloumn is the averange power. The third cloumn is the standard deviation normalized by the averange power.
Note: the end mirror loss is diffcult to measure, so I take only one measurement.
So reflection is 43.48%, transmission is 44.24%, end mirror tans is 2.96%. We loss 2.56mW (9.32%).
I mwasured the power loss due to detection point is not exactly the point of reflection and transmission.
For reflection, we lose 1%(0.12mW) of power. For transmission we lose 0.8%(0.097mW) of power.
So the loss of 2.56mW cannot be explained by this.
Please refer to wiki page.
https://gwpo.nao.ac.jp/wiki/FilterCavity/OpticalLayout
You can download if you want. Refer the instruction from the attached figure.
Are the values given above now confirmed?
P_in = 22 mW
P_tra = 8.5 mW
P_ref = 10.5 mW
P_tra from end mirror = 0.5 mW
Missing = 2.5 mW
Are the 2.5 mW still missing?
[Eleonora, Matteo B.]
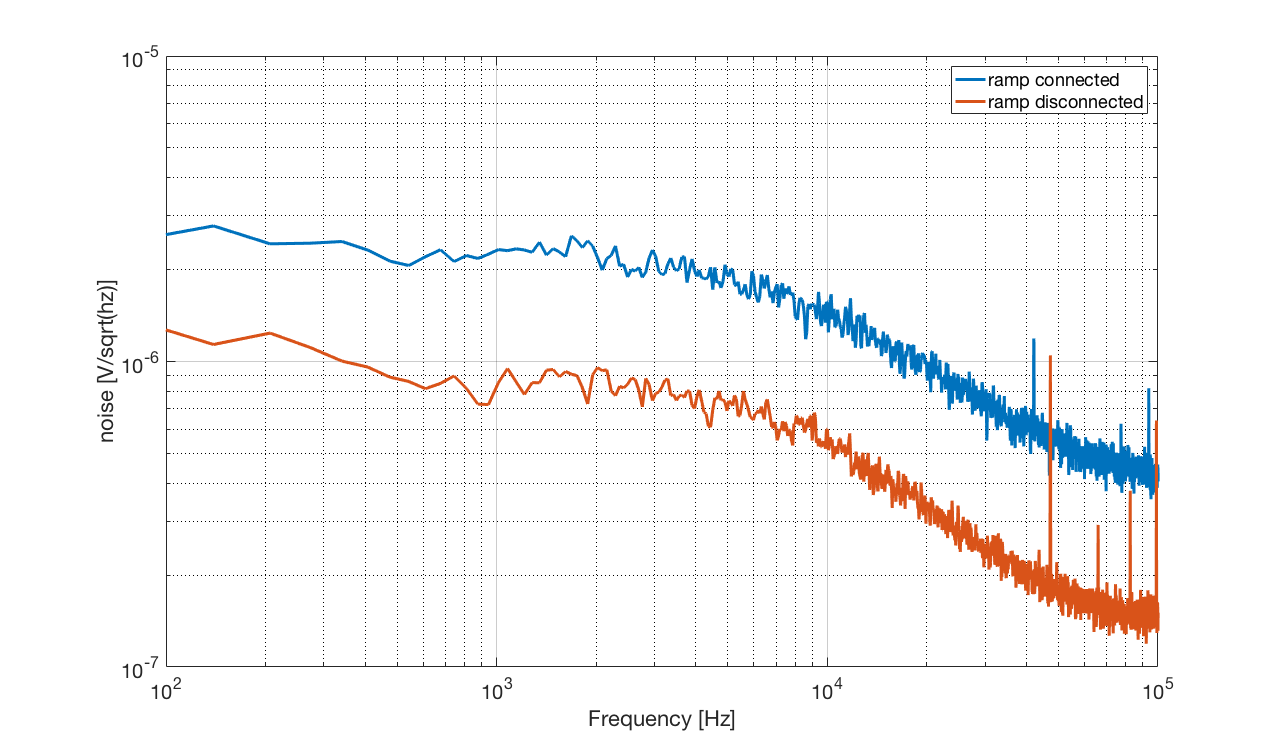
We have measured the rampeuto PZT output noise by connecting the PZT output to the spectrum analyzer. It is about 2 uV/sqrt(Hz) at low frequency and it starts to decrease above 5 kHz, as can be seen from pic 1 (blue curve)
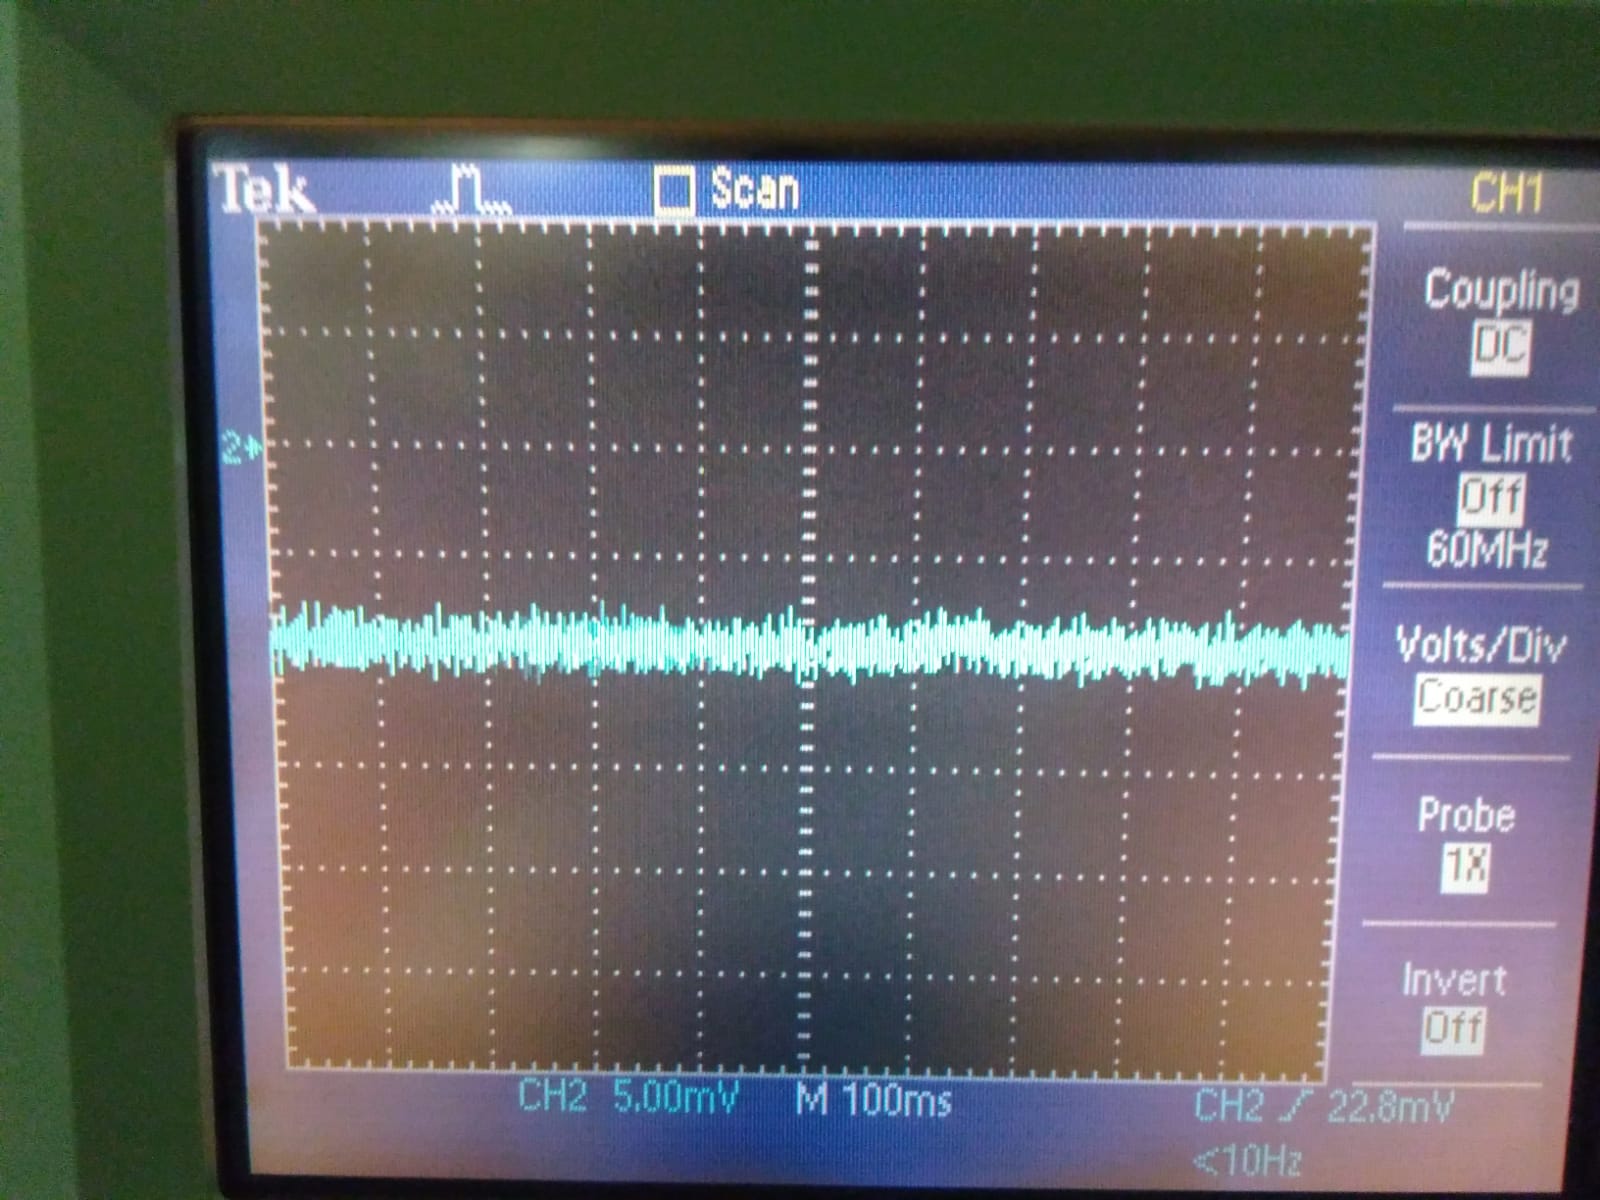
We also observed with the oscilloscope that there is an offset of -10mV. (pic 2).
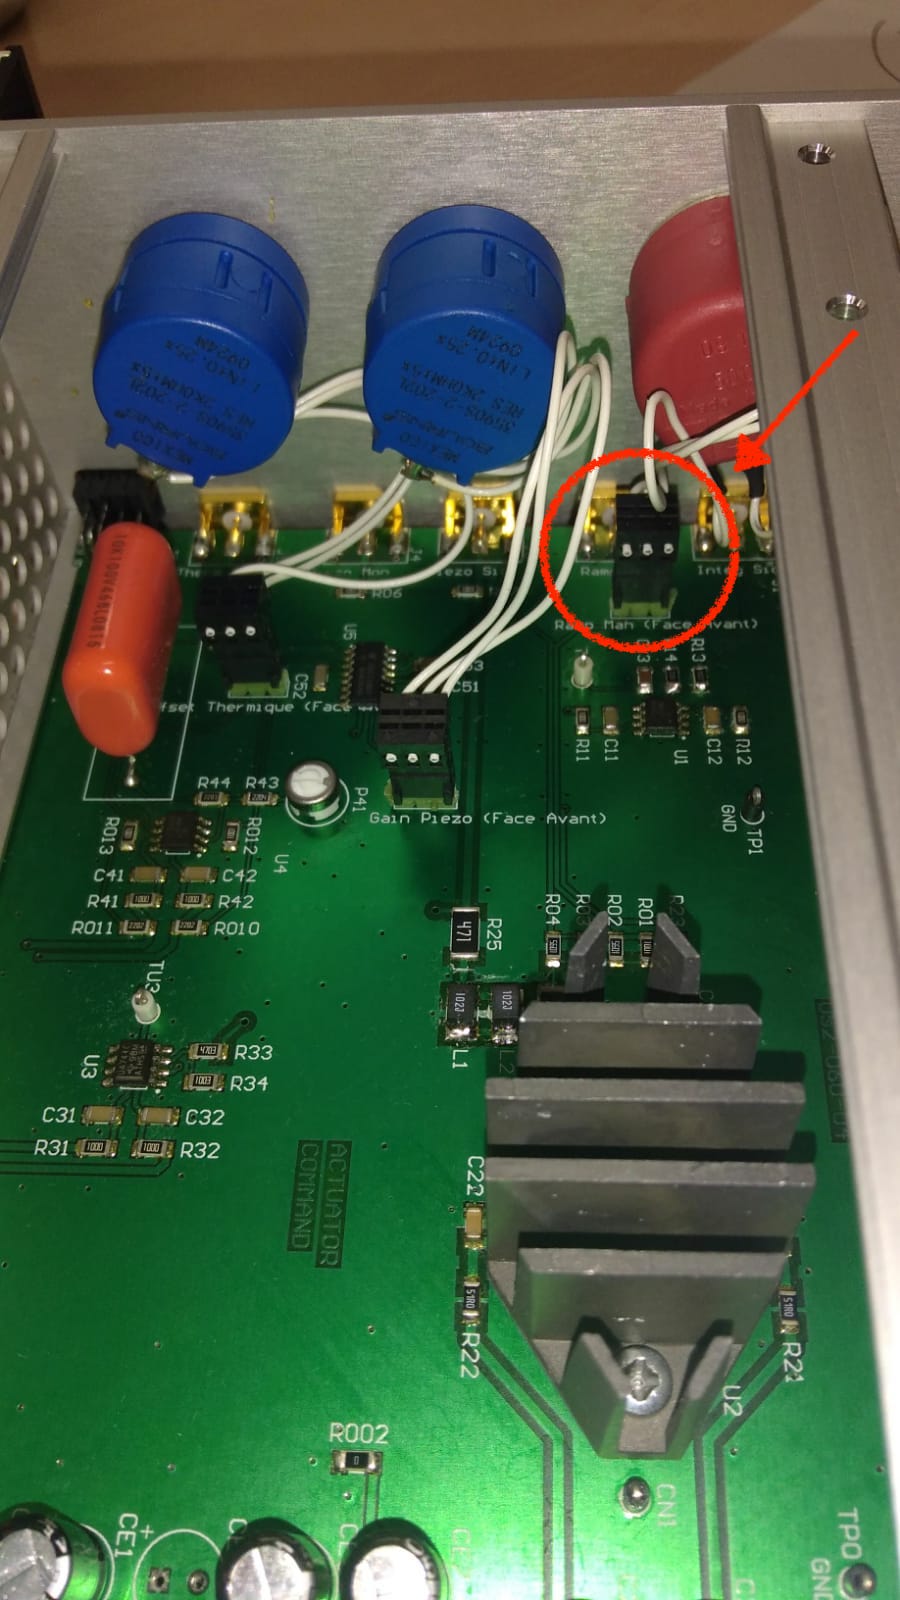
In order to reduce the rampeauto output noise, following the advice of Pierre, we have disconnected the ramp input (which normaly is not used for suspended cavities). (pic 3)
The output noise has been reduced by a factor 3 and now it is about 800 nV/sqrt(Hz), below 5 kHz. (see pic. 1 and 4)
In pic 5, we have compared the rampeauto noise (actuation noise) with the free running laser noise and found that it becomes dominant above 2 kHz.
For the conversion to Hz we used a piezo gain of 2 MHz/V, as measeured in entry #859.
The next step is to re-measure the phase noise, as done in entry #863, with this new configuration.
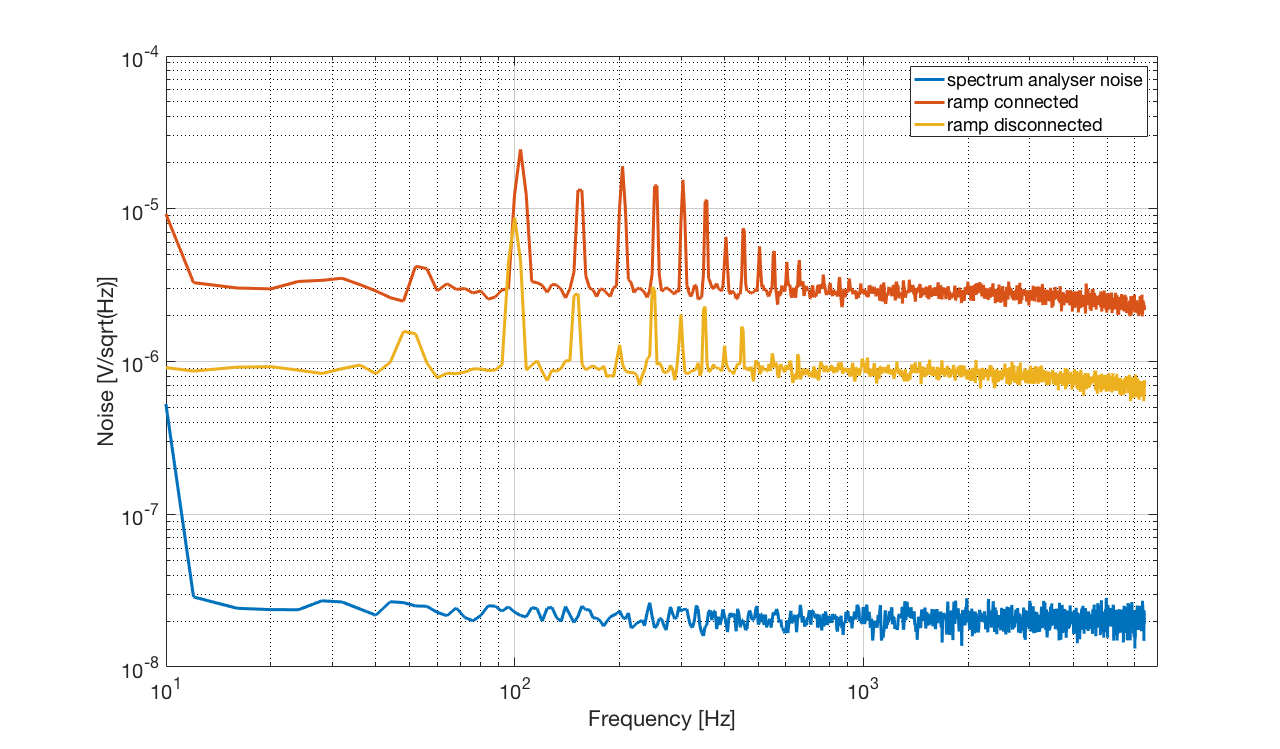
We compare the green error signal spectrum before and after the disconnection of Ramp injection point in the circuit. We can see the noise level is reduced by a factor up to 3 from 2kHz.
Participaint: Eleonora, Matteo Barsuglia and Yuhang.
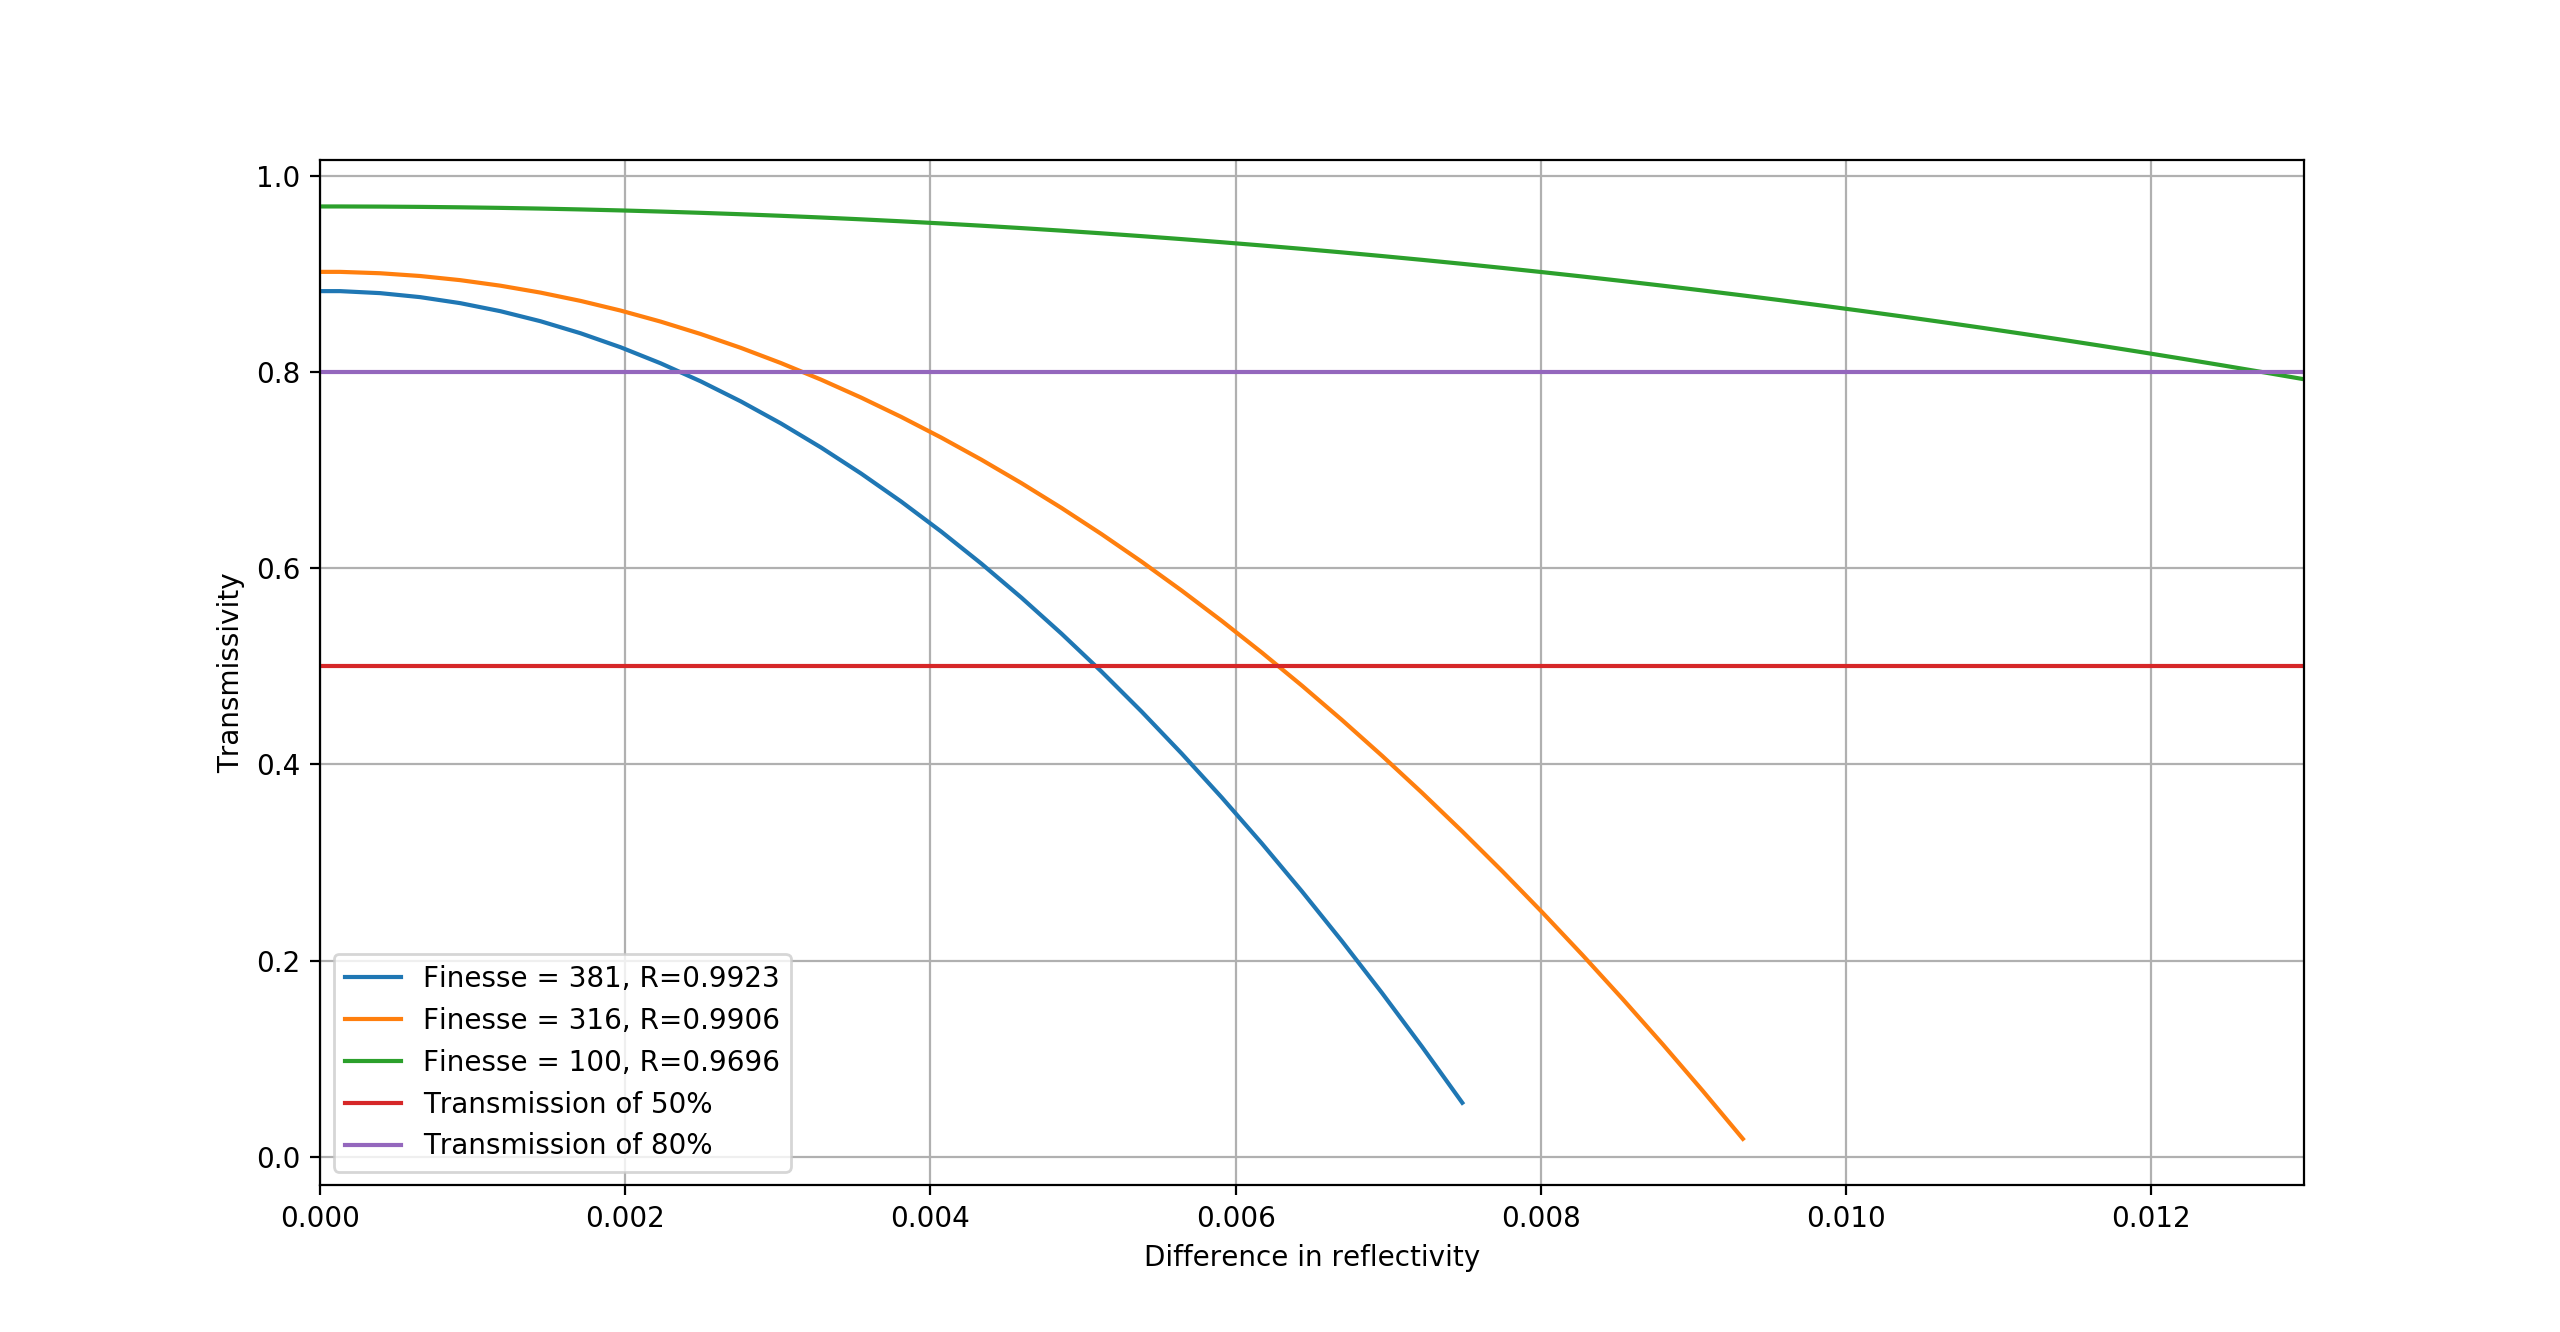
As we found before, the transmissivity of mode cleaner is not as expected. We also found for different Finesse requirement, we can have different tolerance of reflectivity error.
According to the measurement result of entry871 and entry548, we firstly get the reflectivity of mirror (r) and then we use this result and scan the reflectivity amplitude from 0 to 0.13.
We put this difference to each mirror as delta/2, for example we use r_1=r+delta/2, r_2=r-delta/2. However, when we convert this amplitude difference to power difference, we bring back a factor of 2. So they balance.
We also plot the case for Finesse as 100. As the experience of Matteo Barsuglia, this Finesse can give us 99% of clean to have TEM00. And we can increase reflectivity difference tolerance dramatically. For details, refer to attahced figure.
We also investigate the reason of higher transmission with lower Finesse. The reason is we loss some of the power through the end mirror of mode cleaner. The higher the Finesse is, the more losses we have.