NAOJ GW Elog Logbook 3.2

Participaint: Eleonora, Yuhang and Matteo
Motivation: Last week, we achieved the coupling of laser to fiber up to 50 percent. However, we find it has a large fluctuation. We guessed it might be caused by the back reflection laser. Anyway, we need to have this FI.
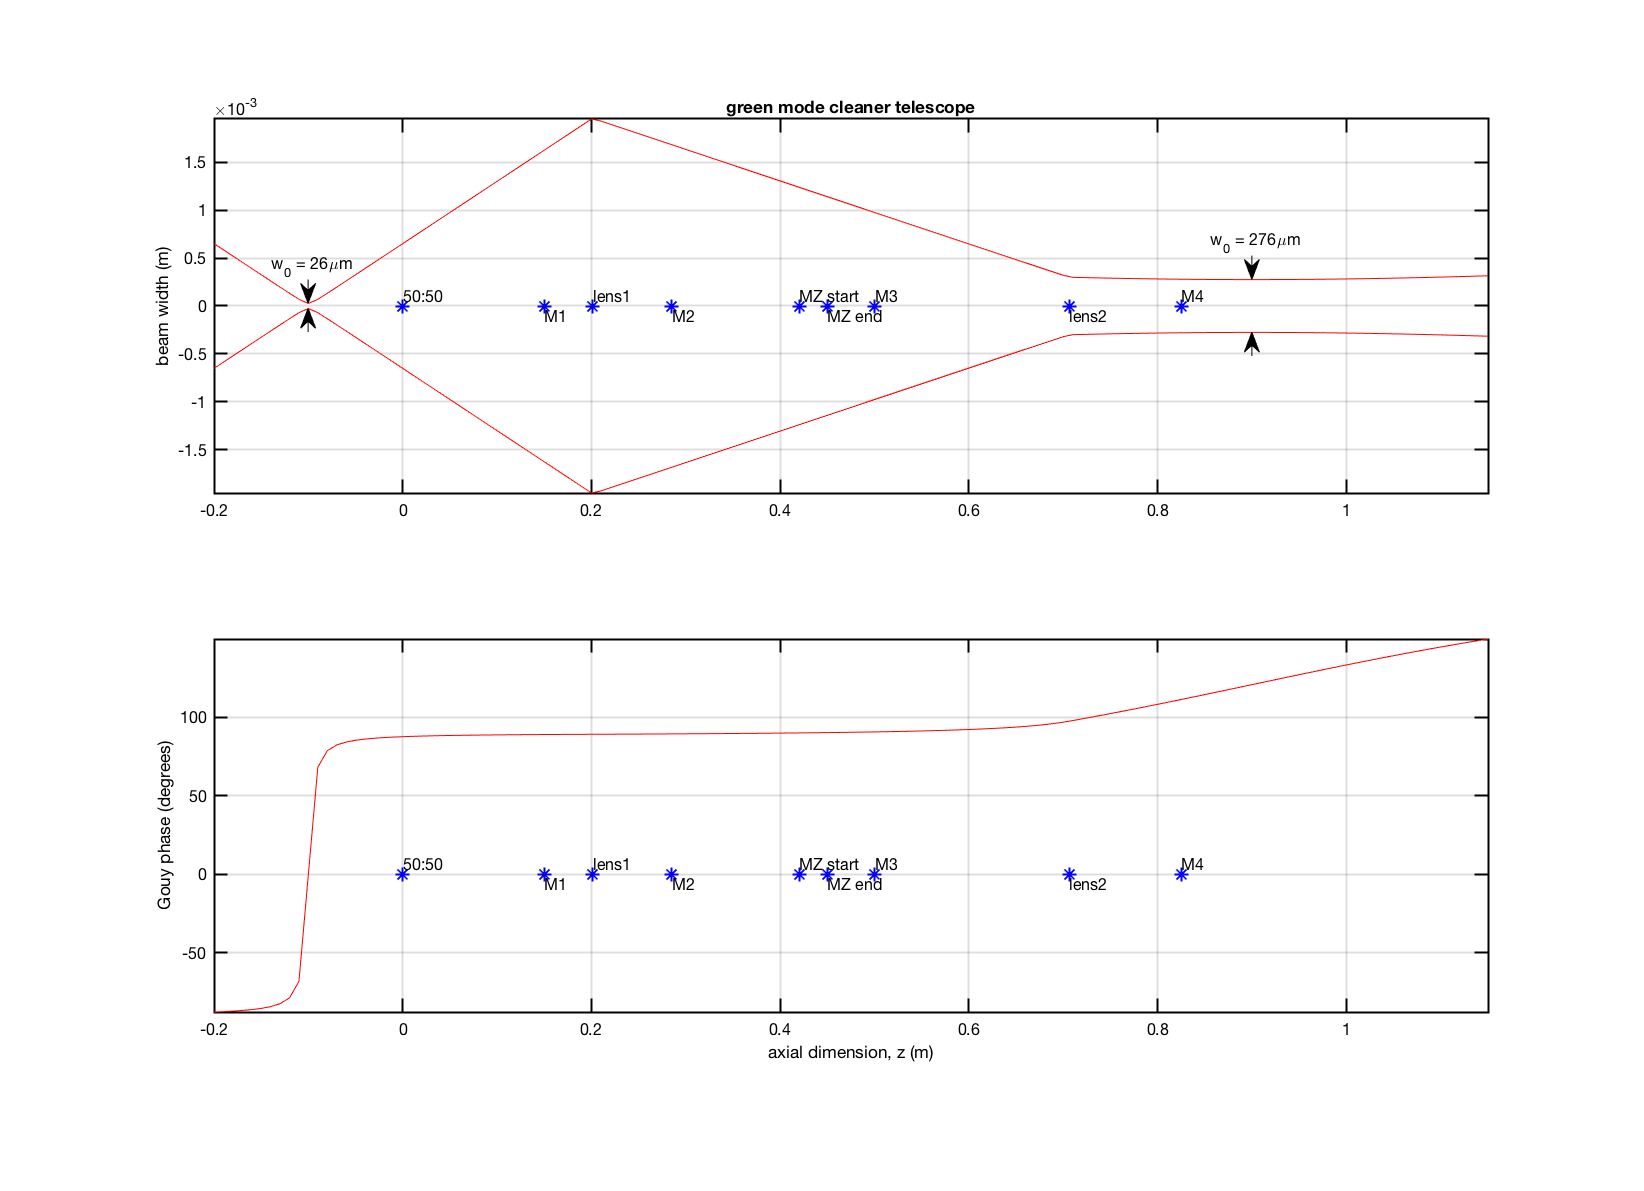
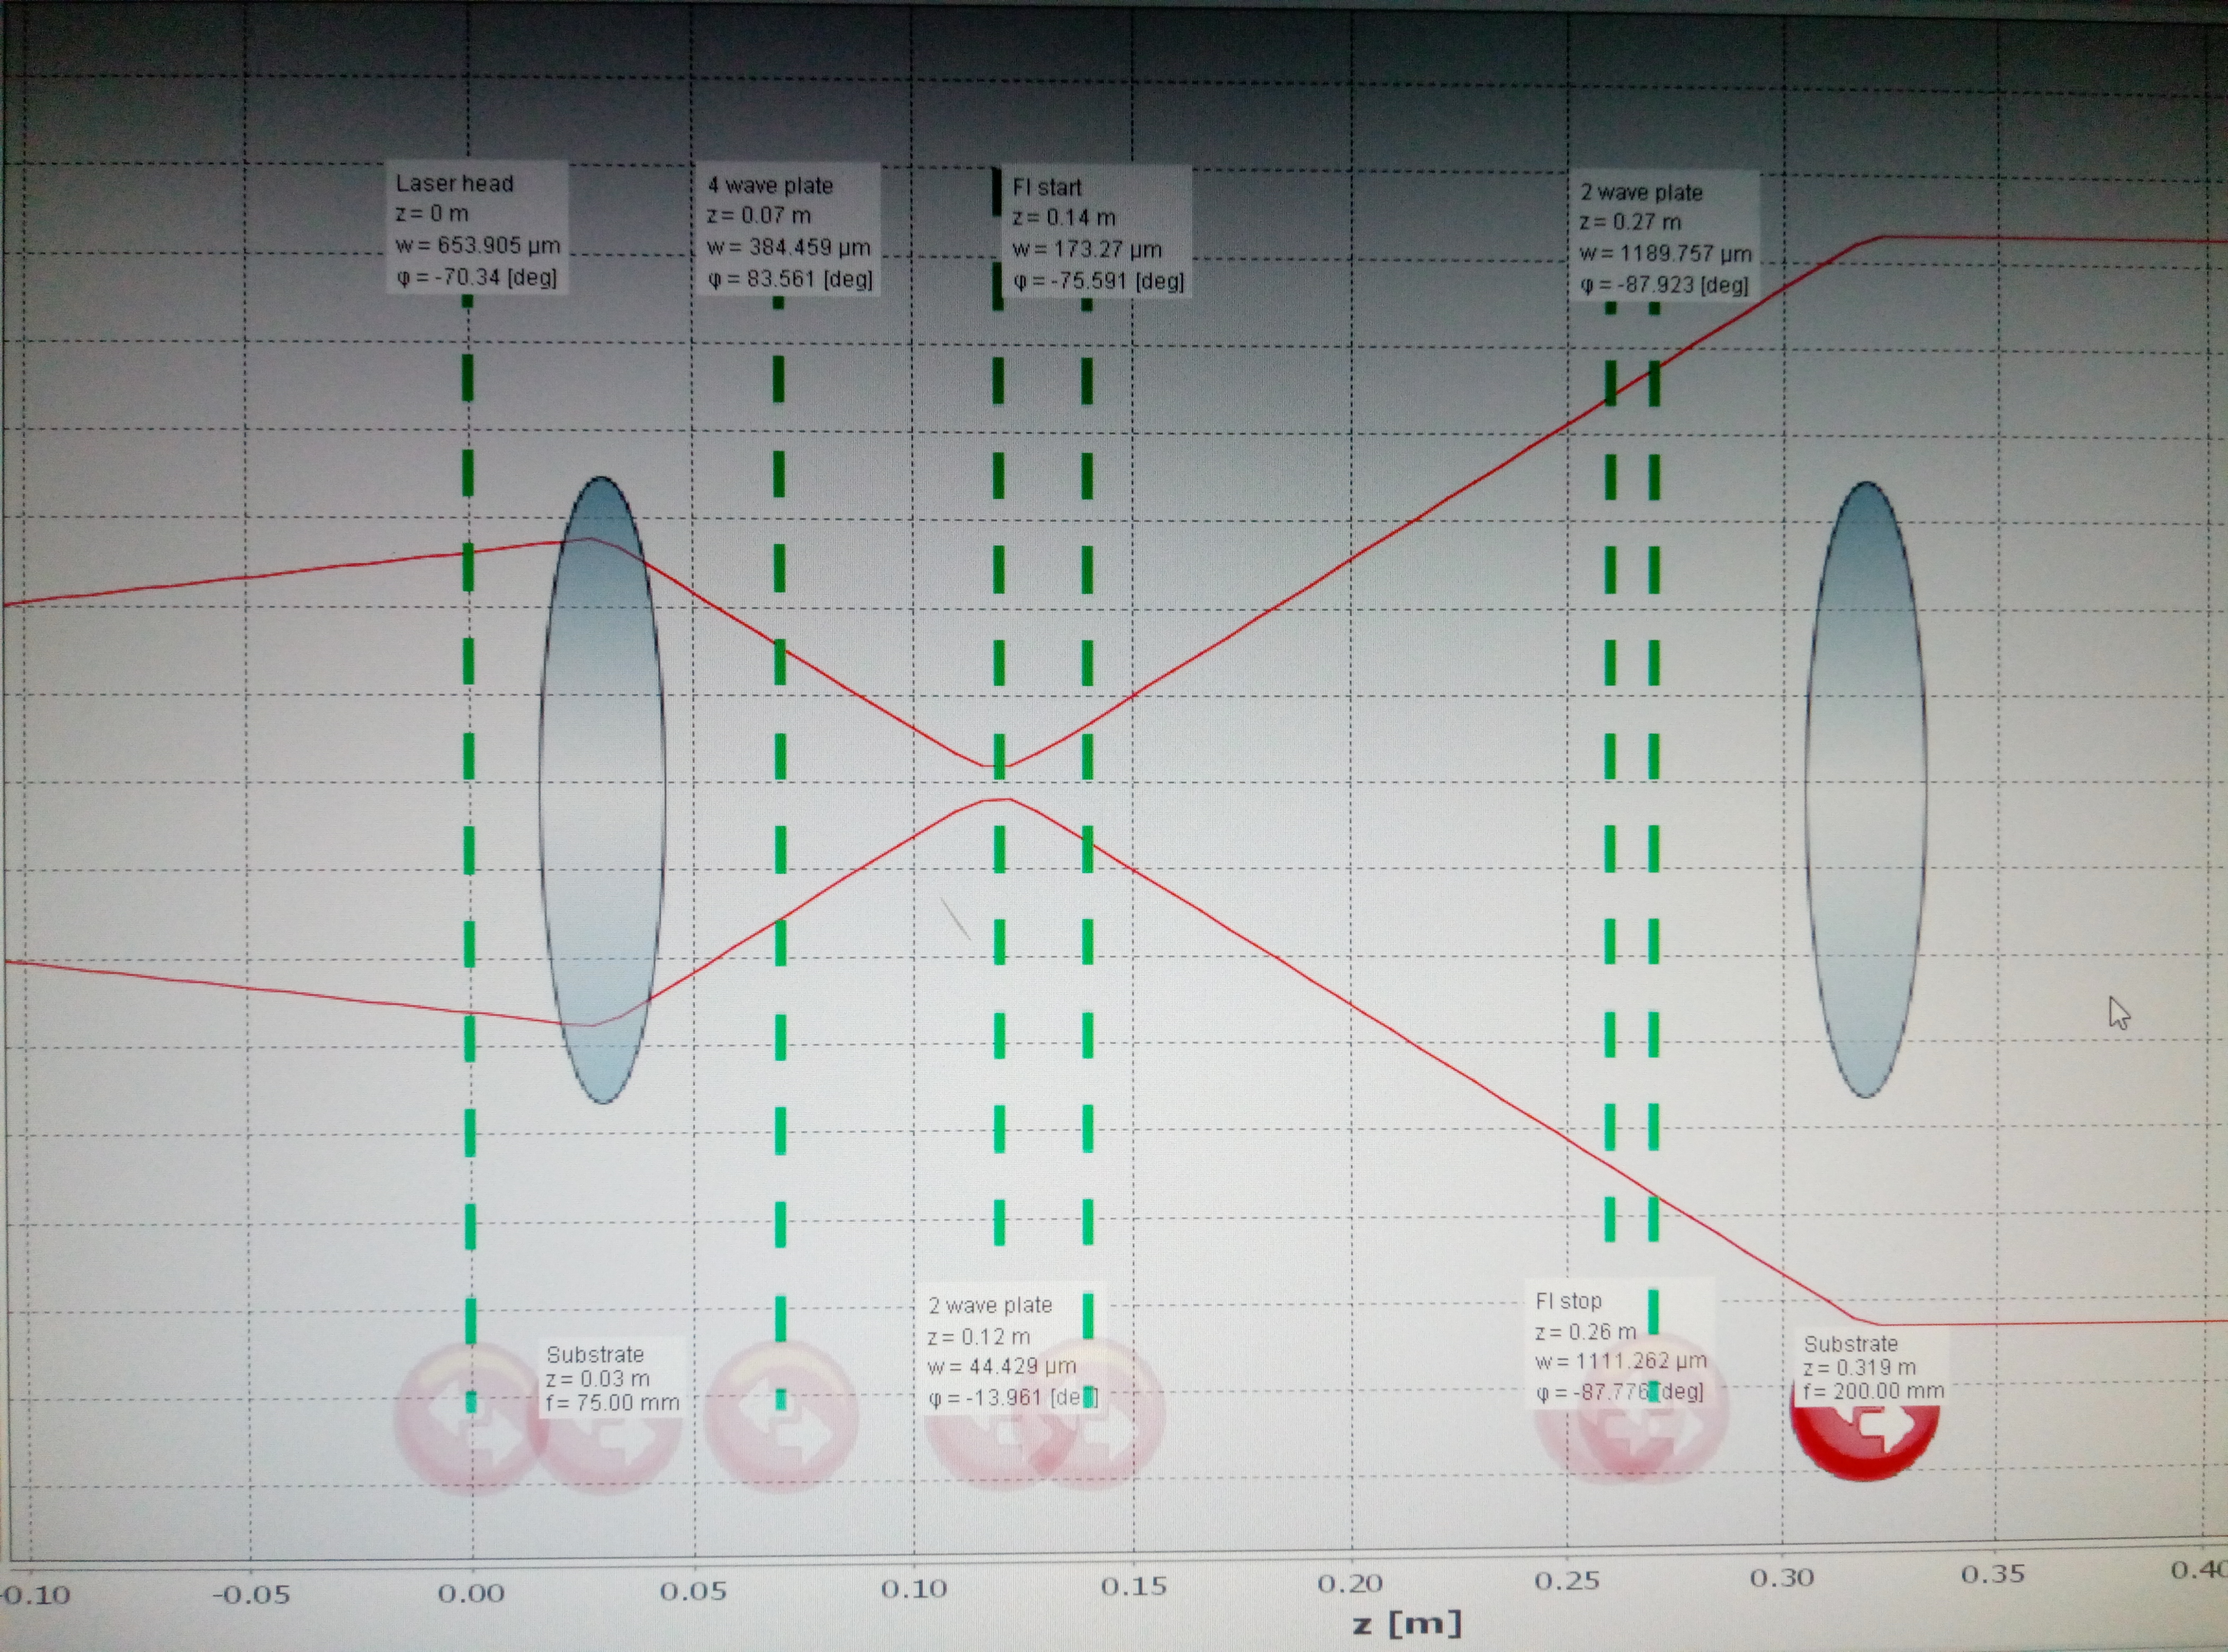
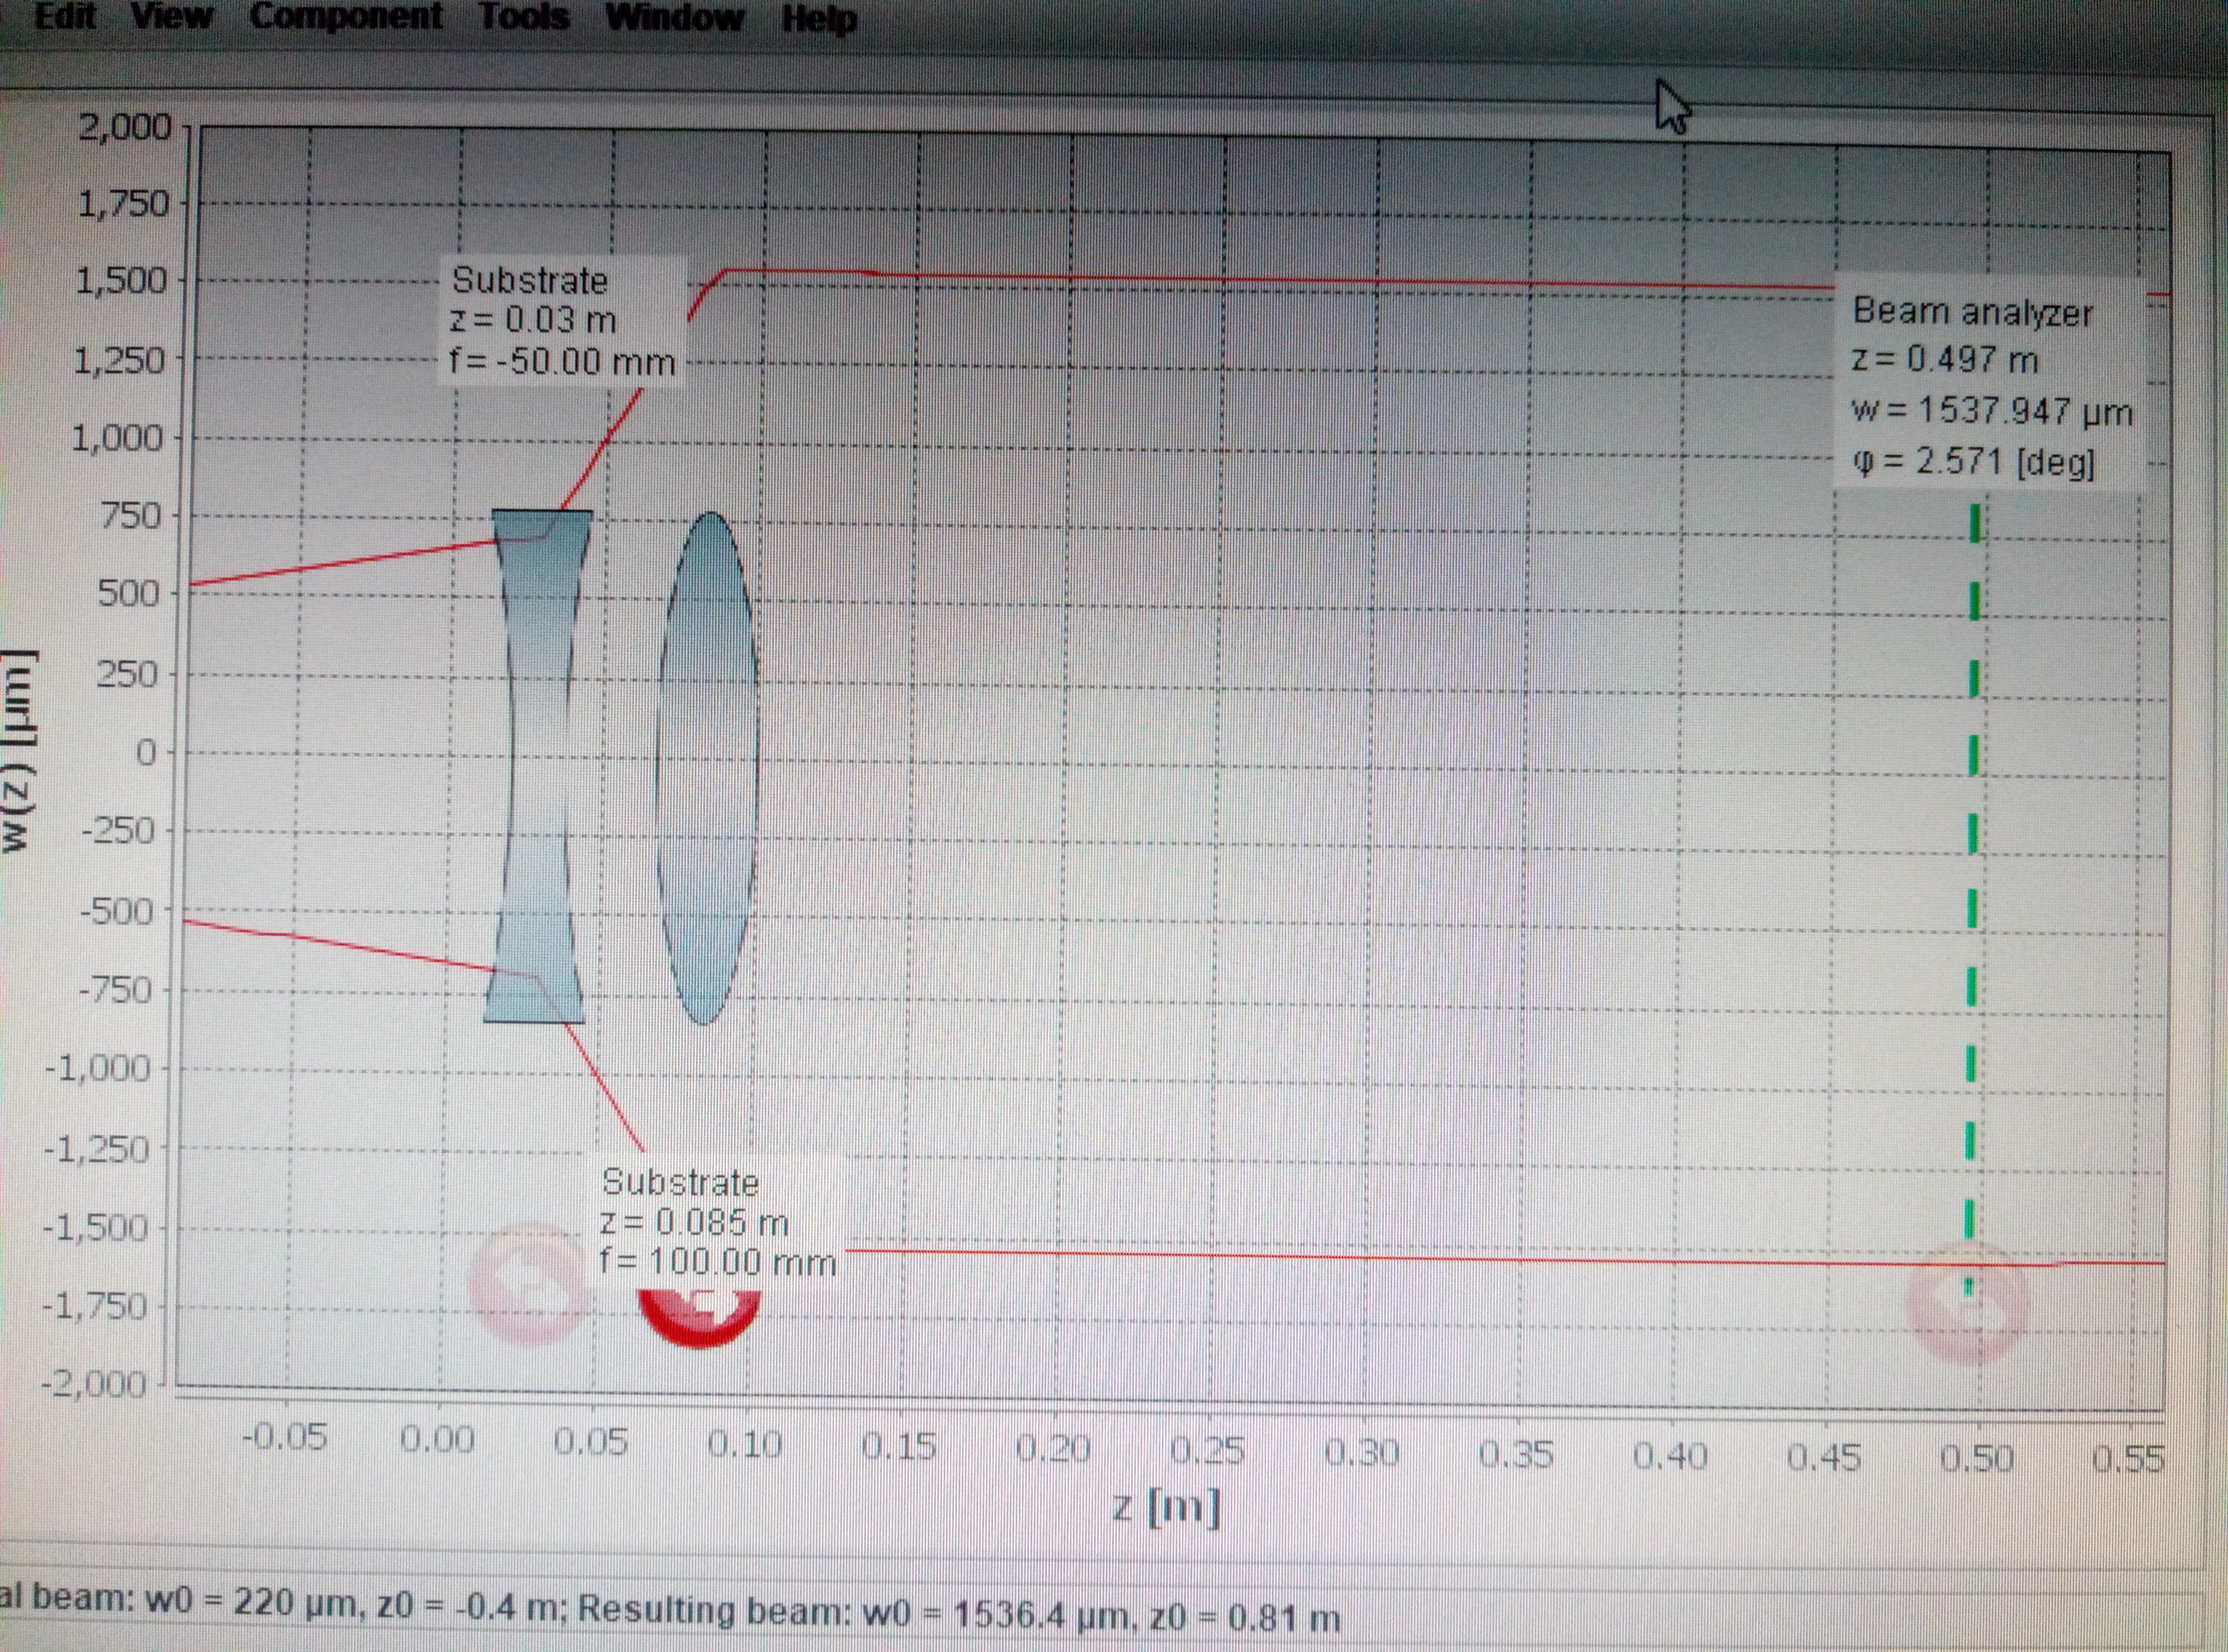
Simulation: I designed how to put them so that we can have a output beam which can match collimator and fiber. I also checked the beam going into FI is much smaller than the aperture of FI(5mm). See attached Figure. 1.
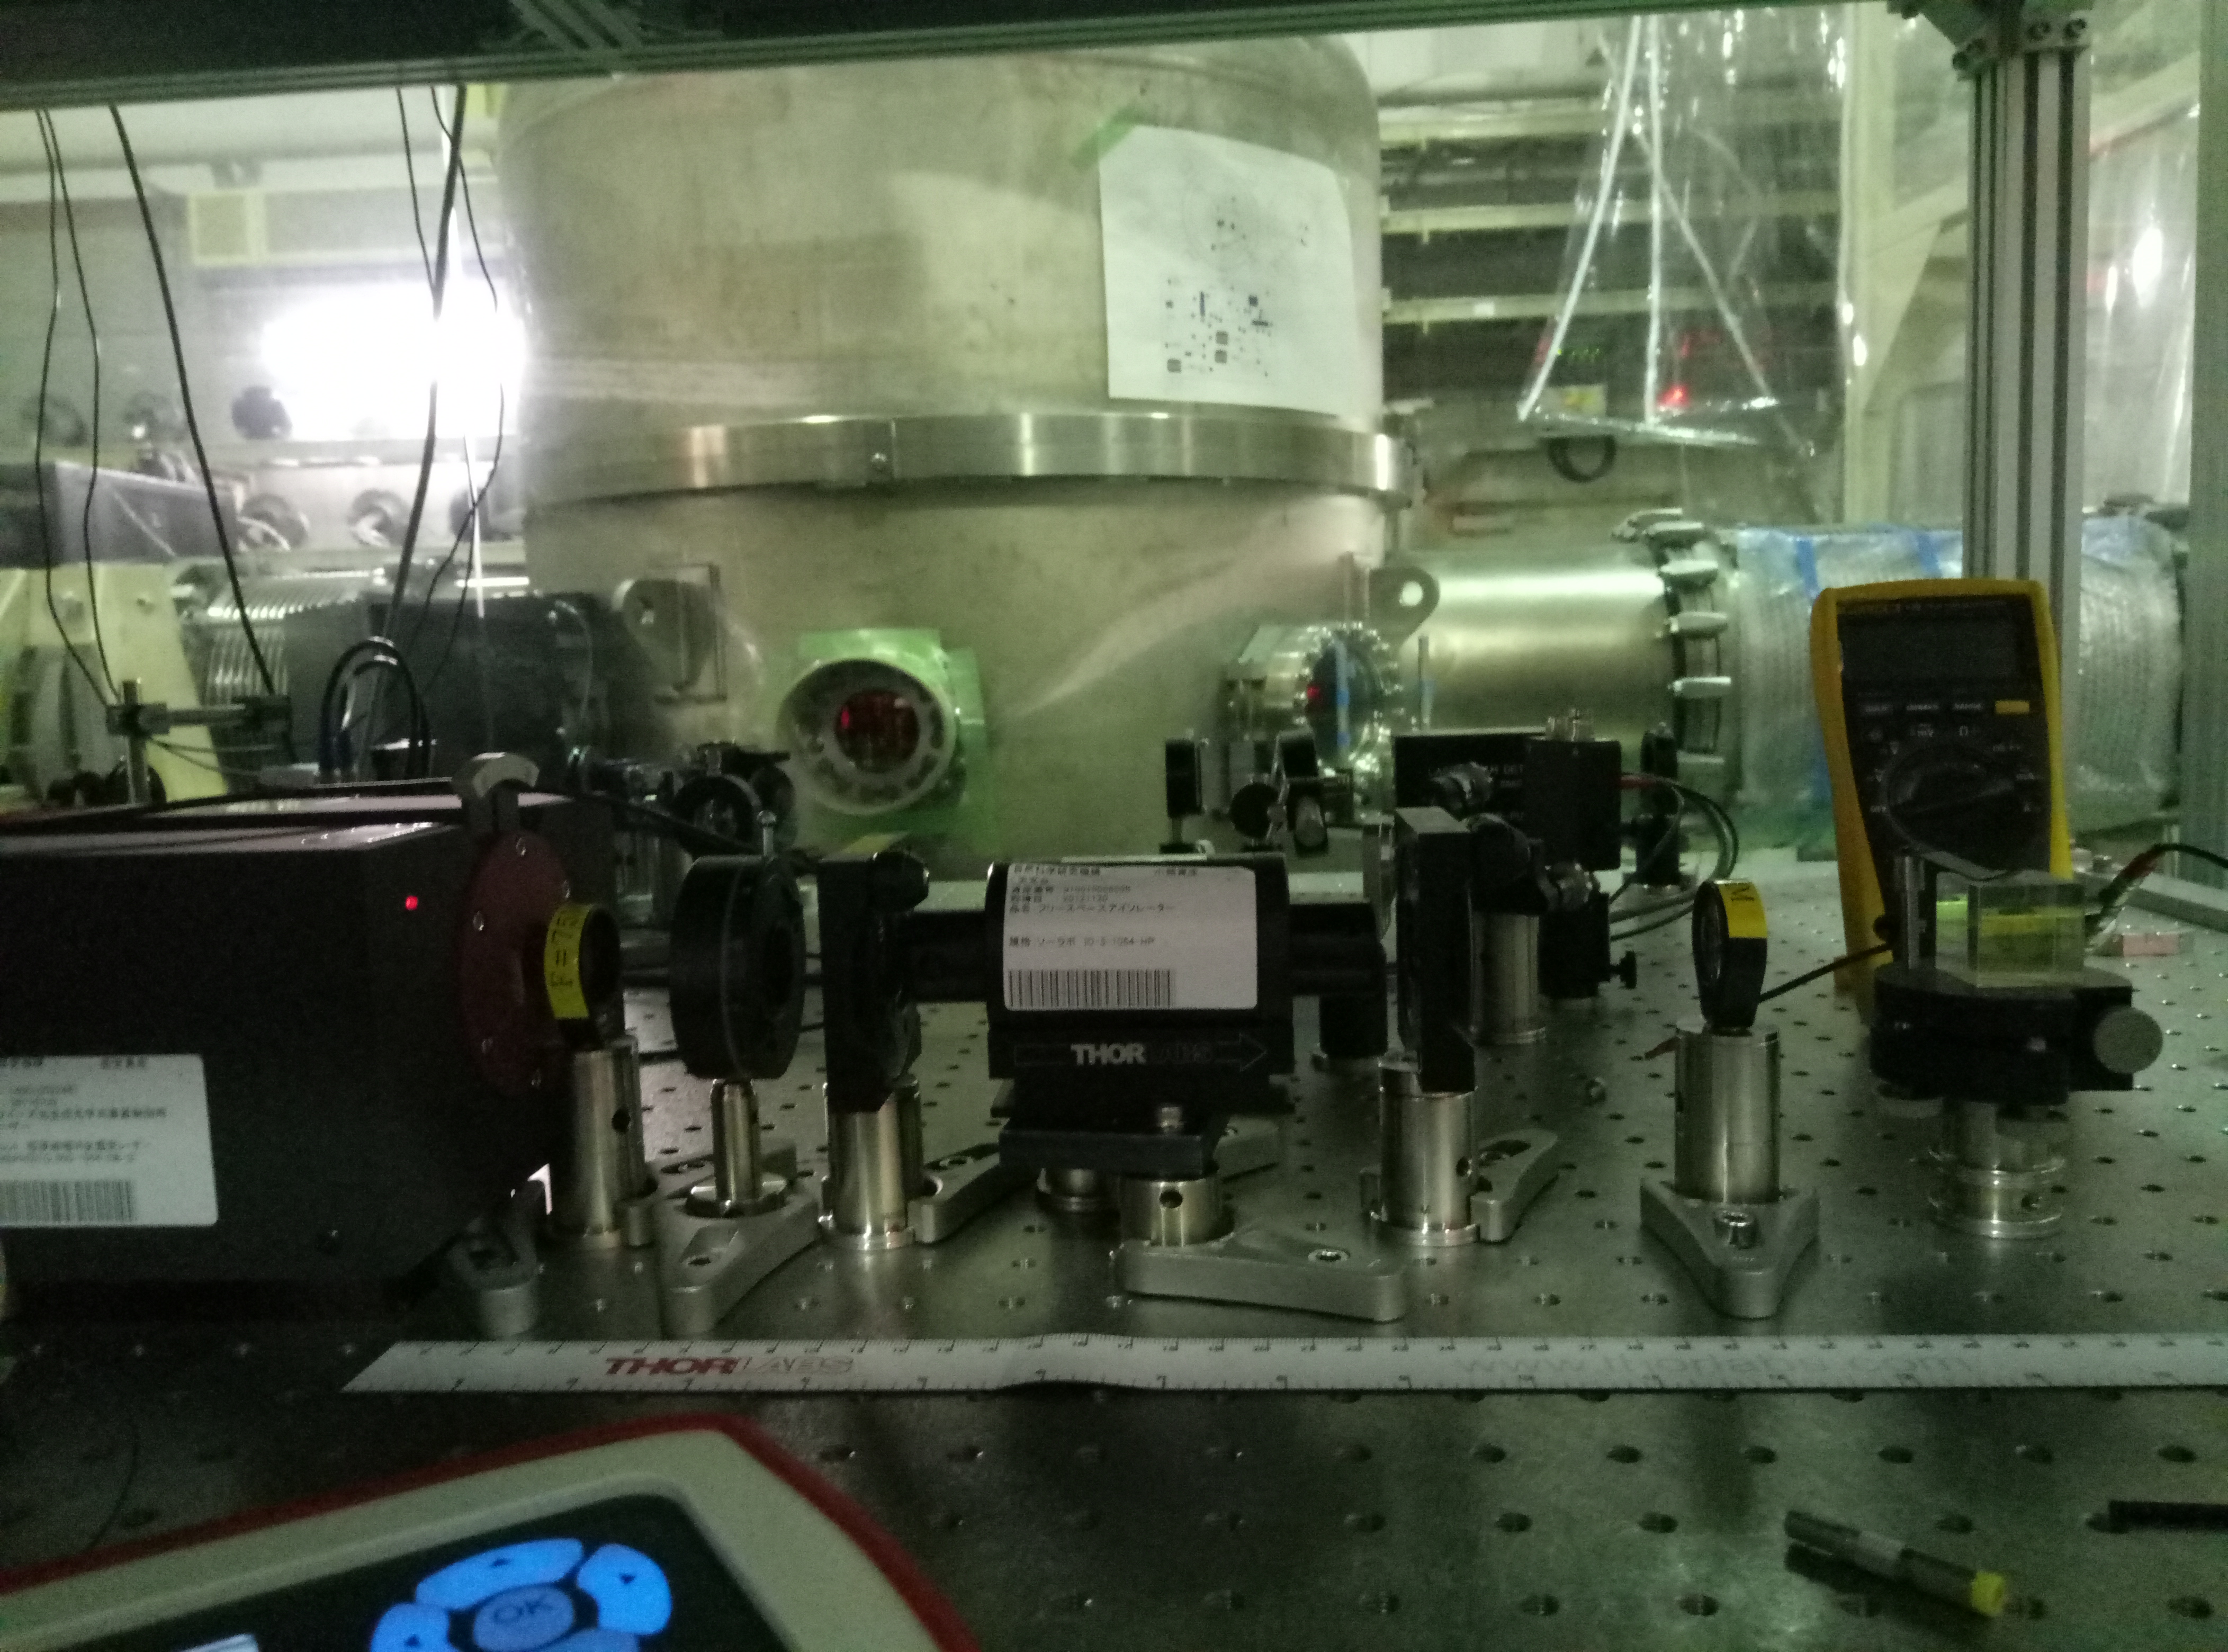
Installation: I collected all the necessary components and put them in sequency. I also checked the beam after the last lens seems fine. But I found the second half-wave plate is broken. I mean we cannot rotate it, so we cannot change polarization. I will change it tomorrow and make the light s-polarization. See attached Fig. 2.
Result:
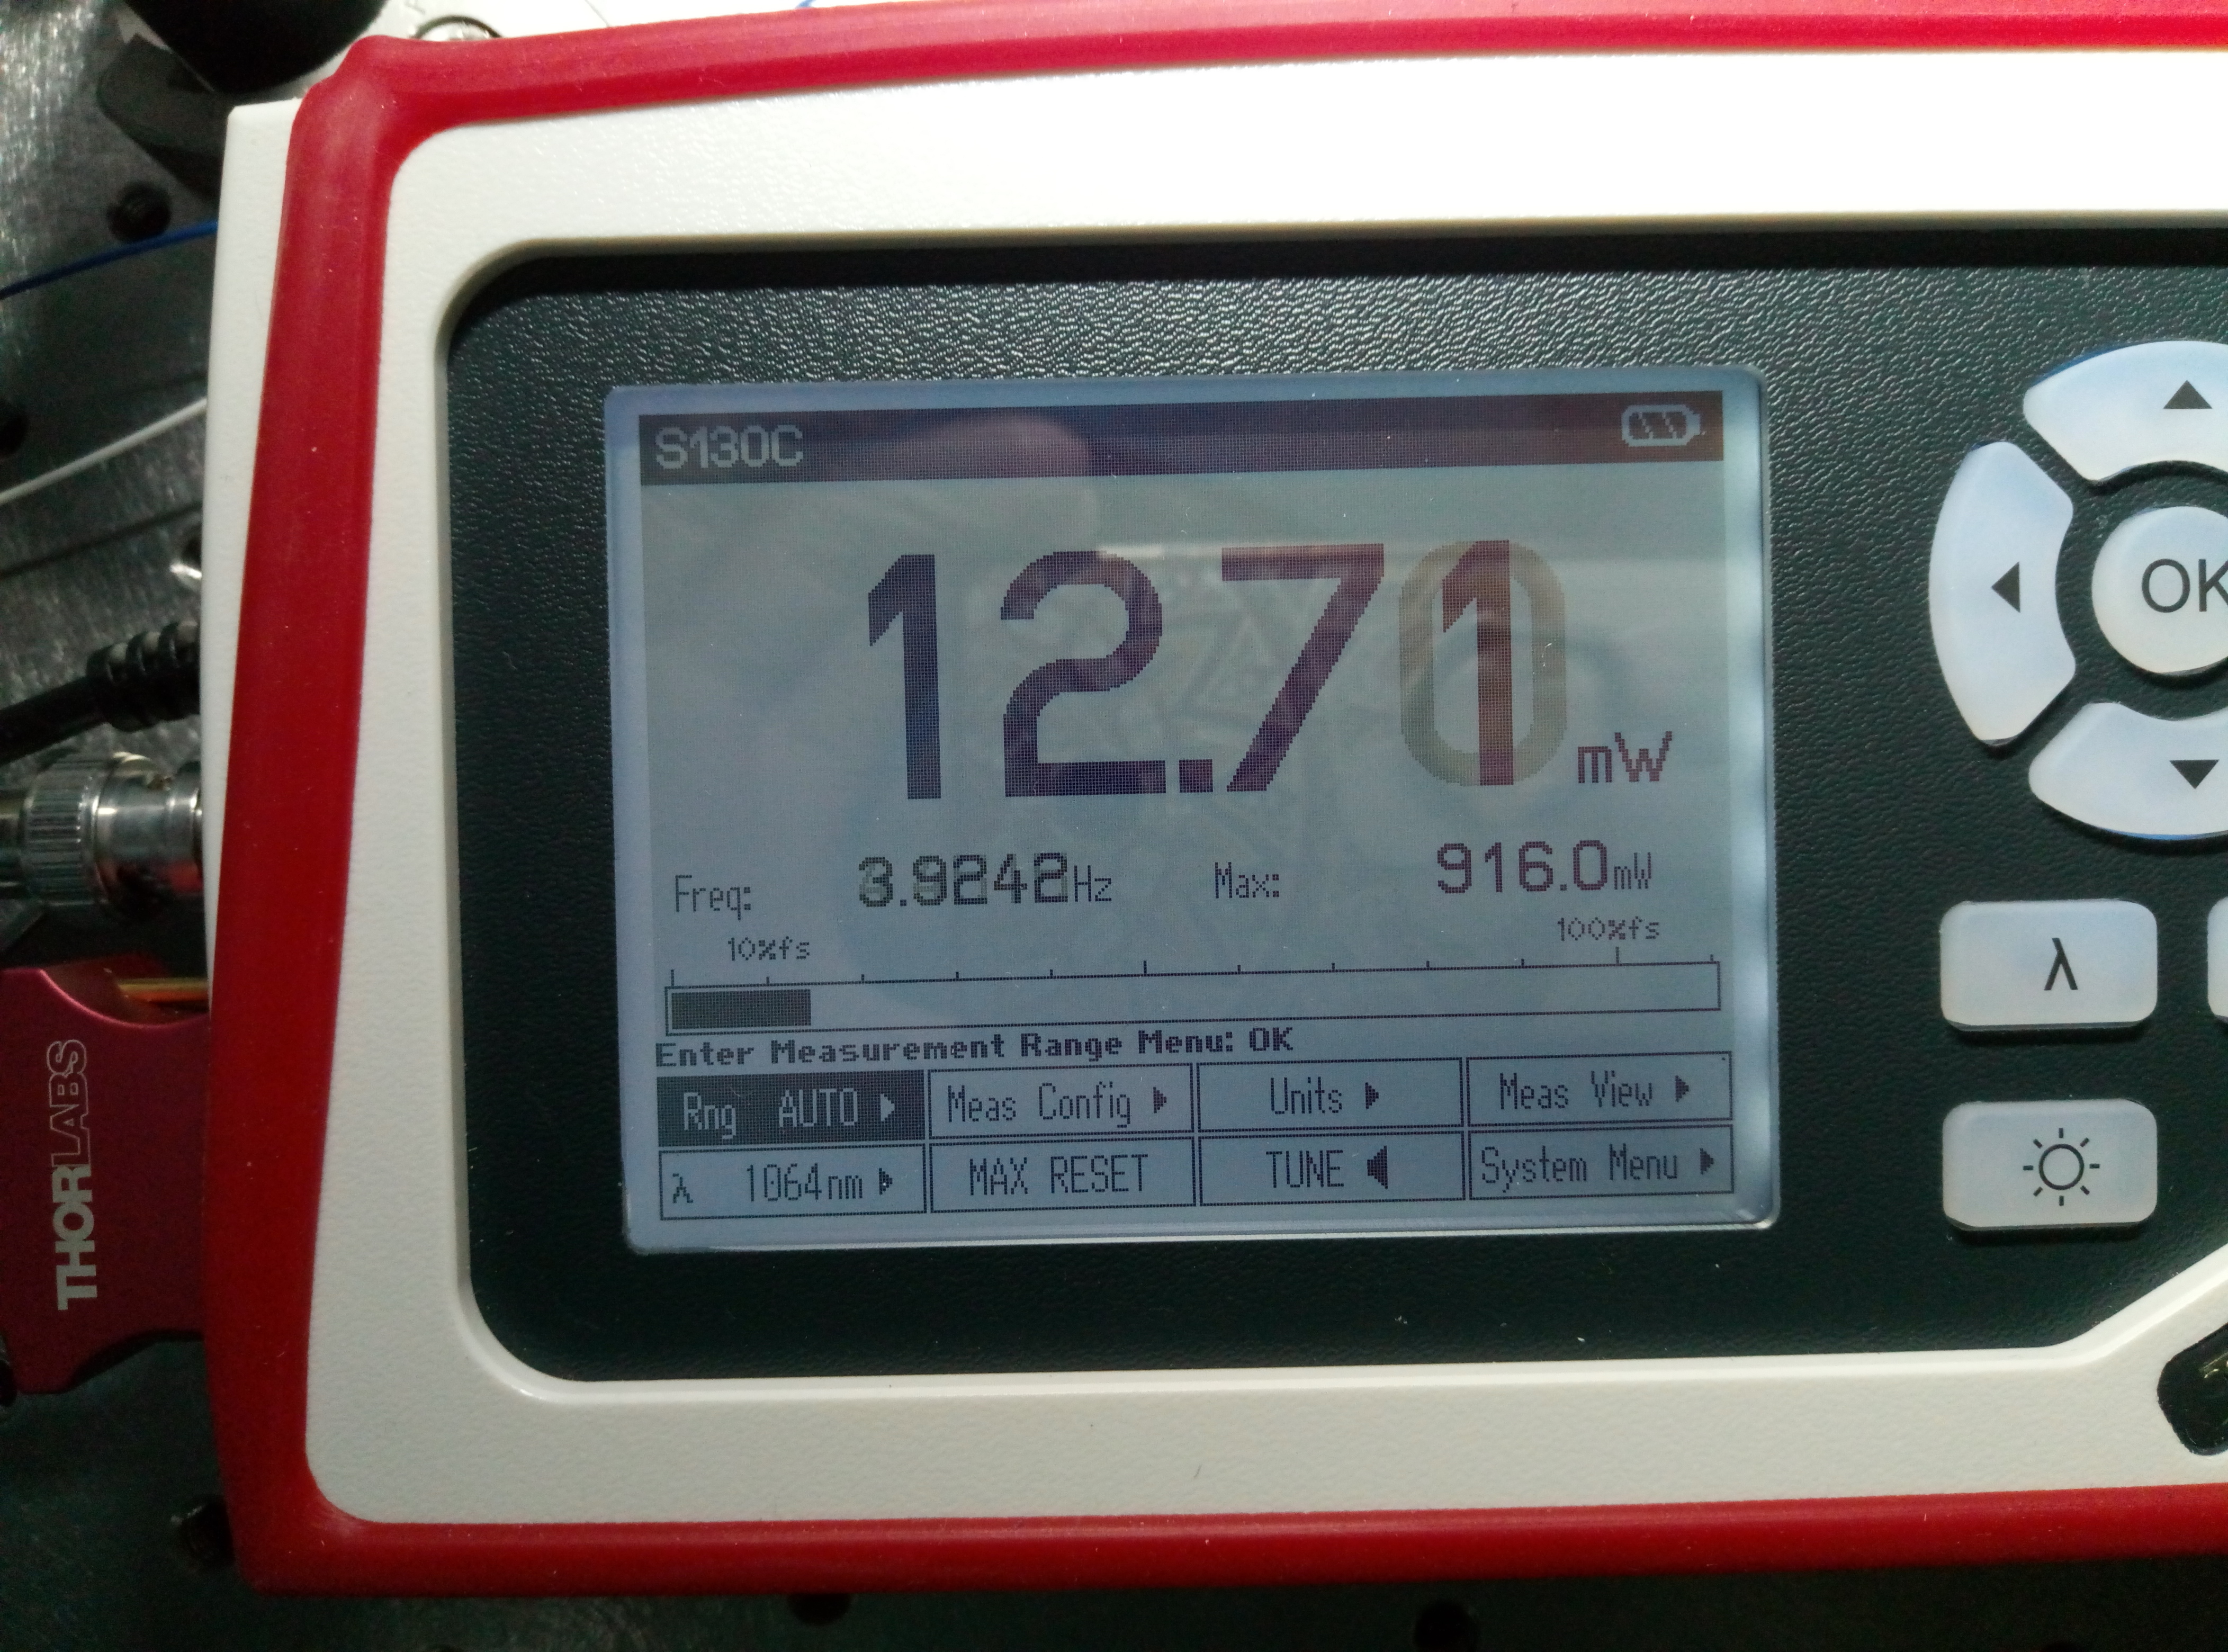
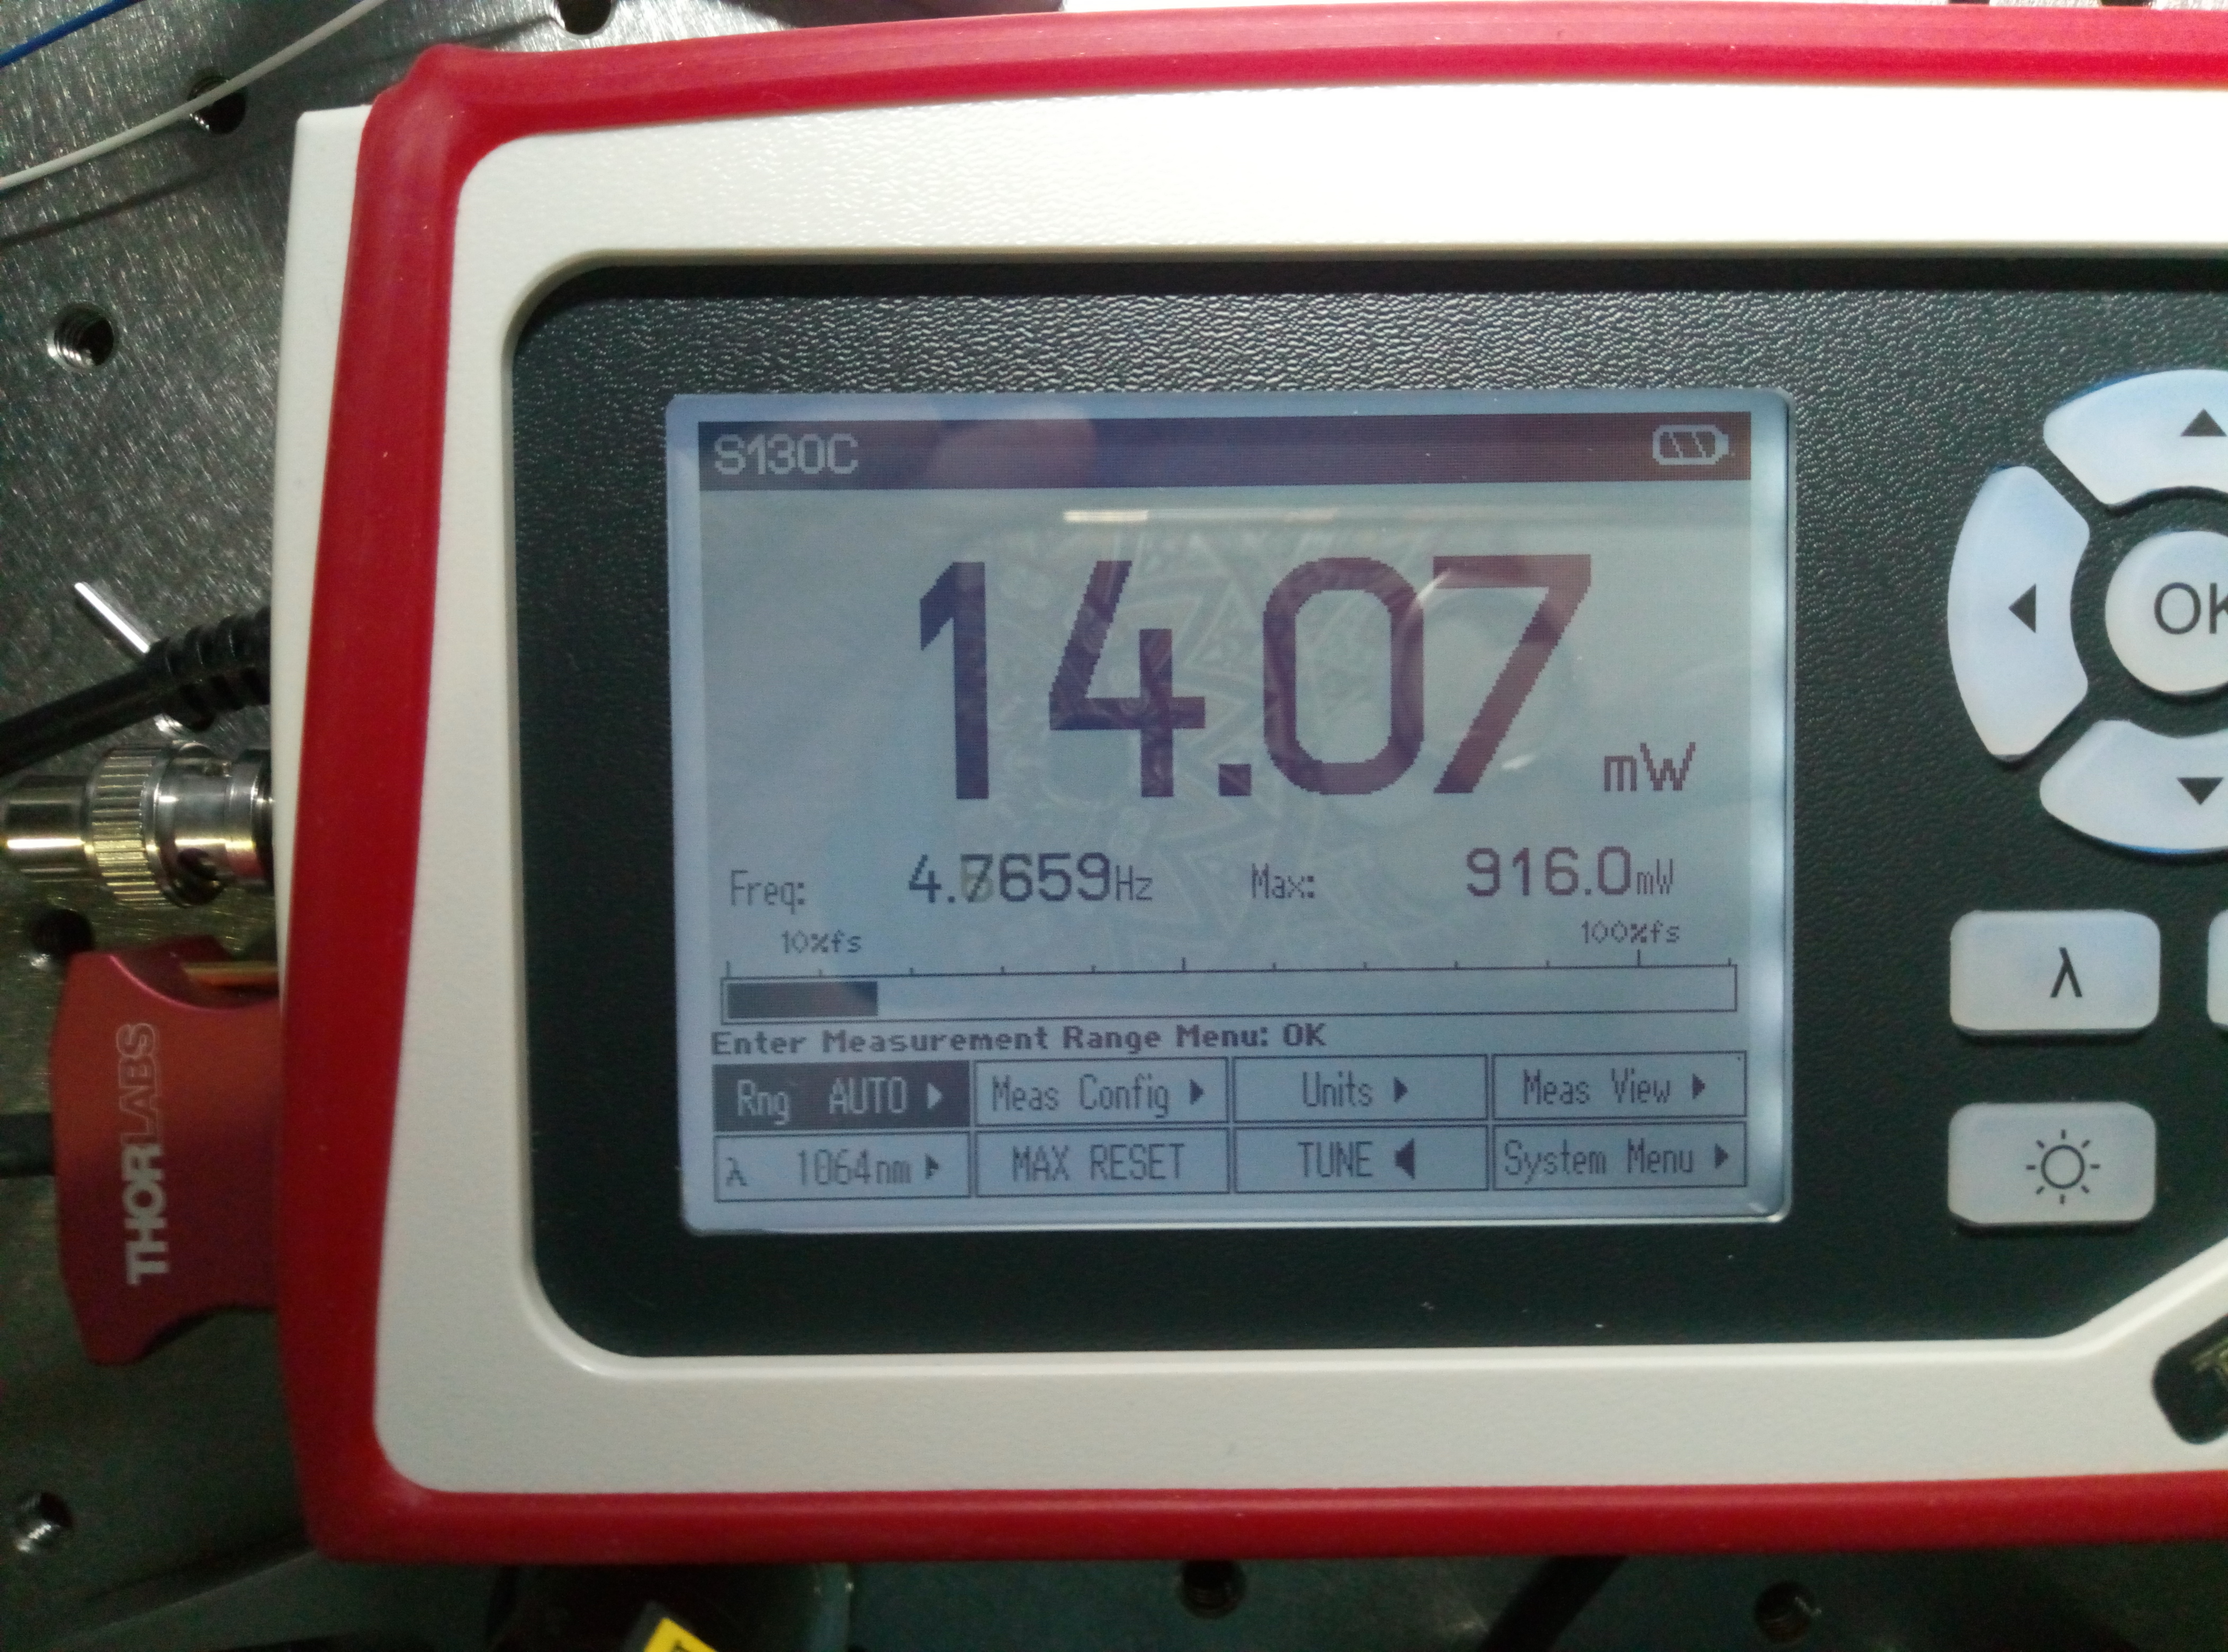
The transmission of FI is 12.71/14.07 = 90.33%. See attached Fig. 3 and 4.
I used roughly 33 cm of space.
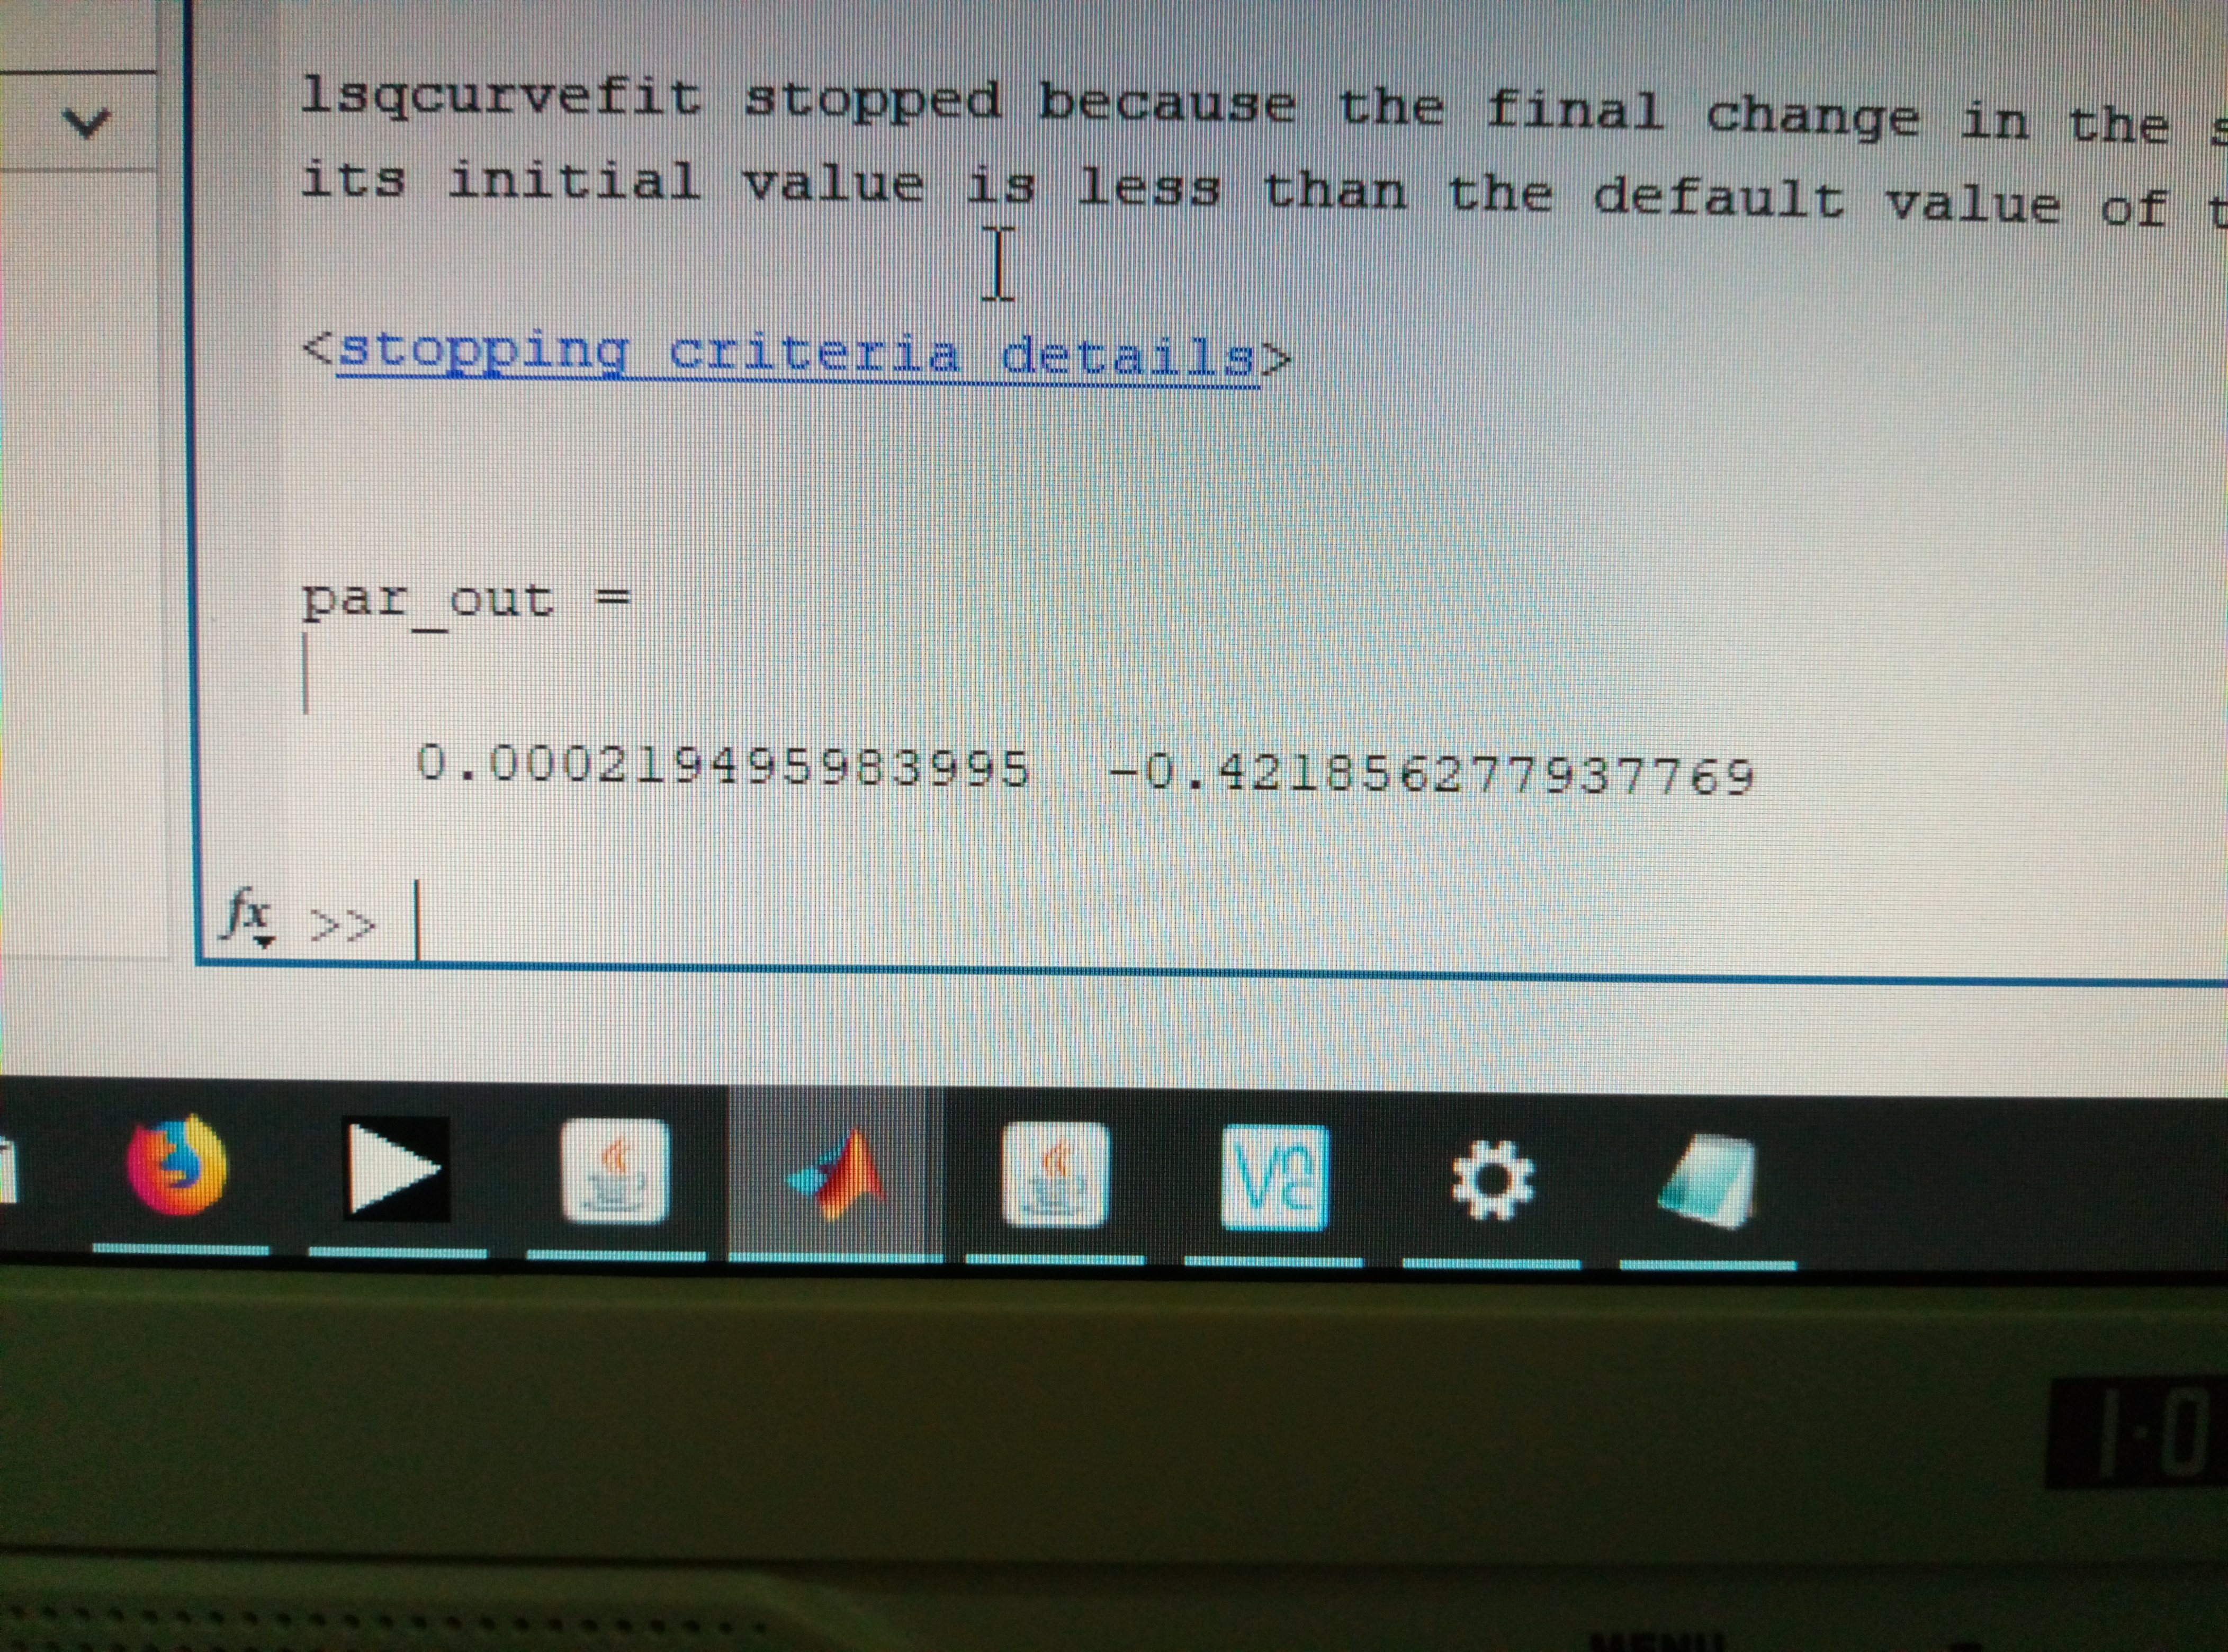
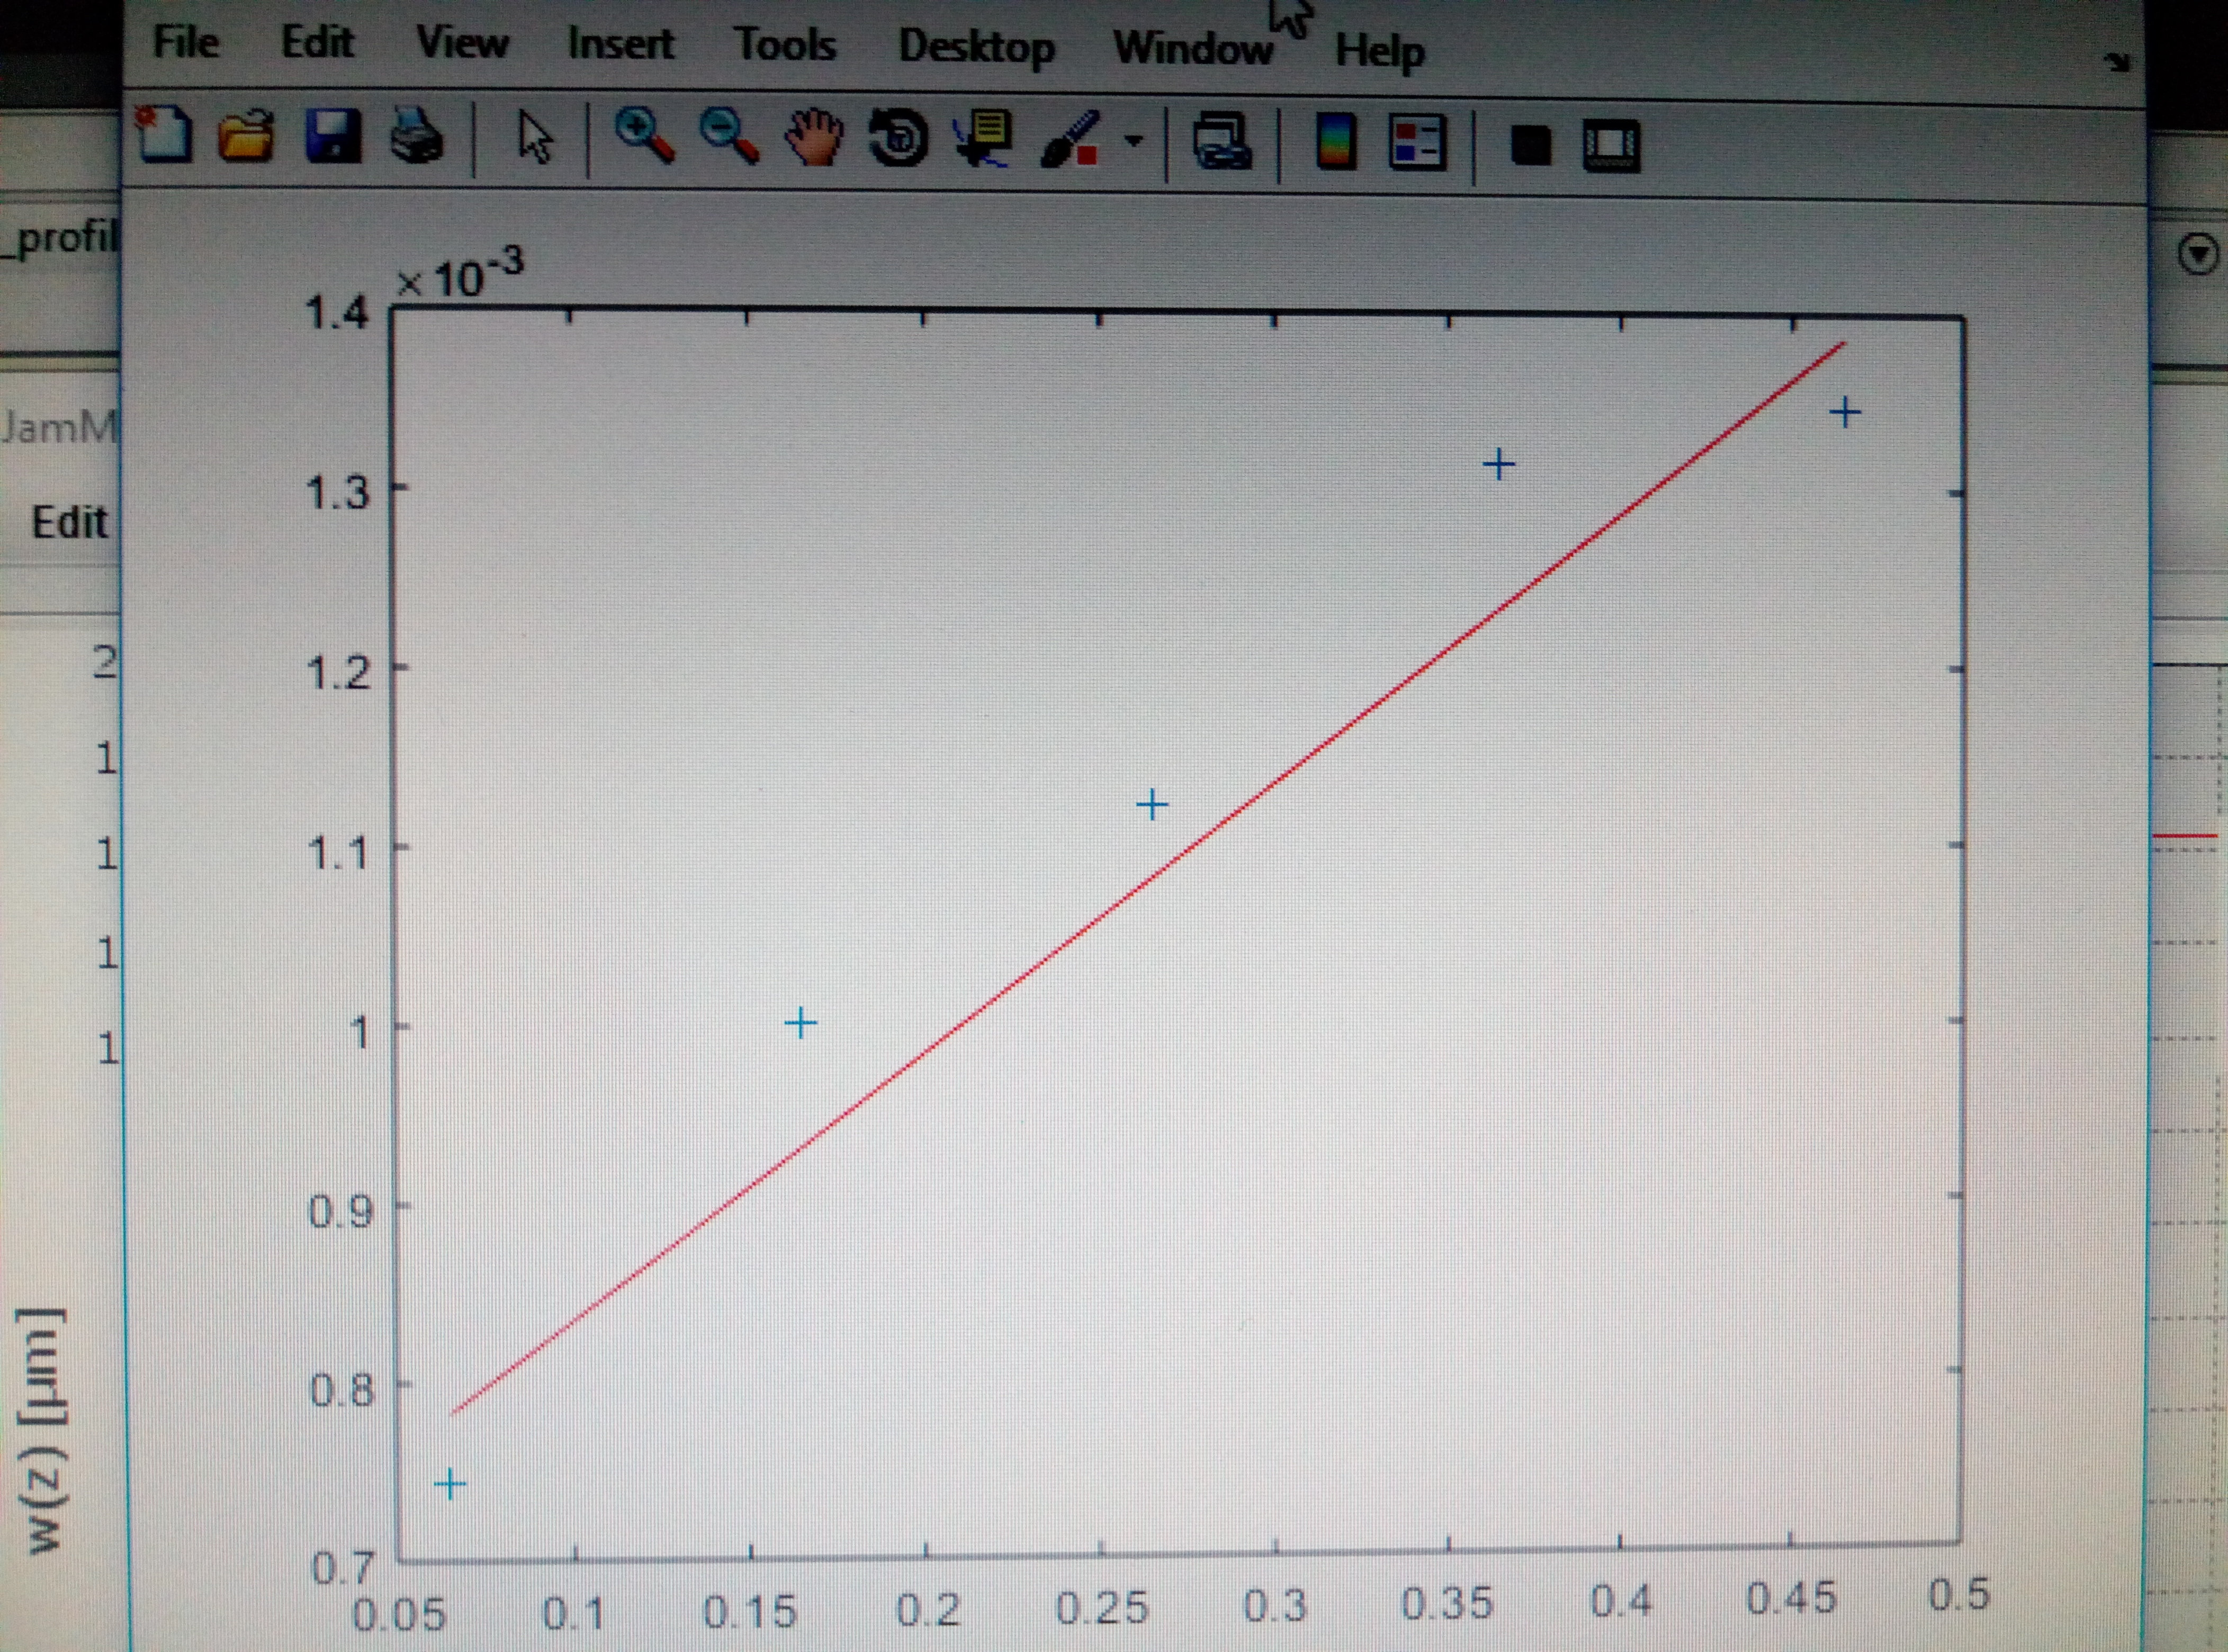
I find there is a mistake in the calculation, see attached picture 1. I used a wrong unit for a number. After the correction, I plot the result again(see attached picture 2)
Now the error on AOM is 1.07mrad.
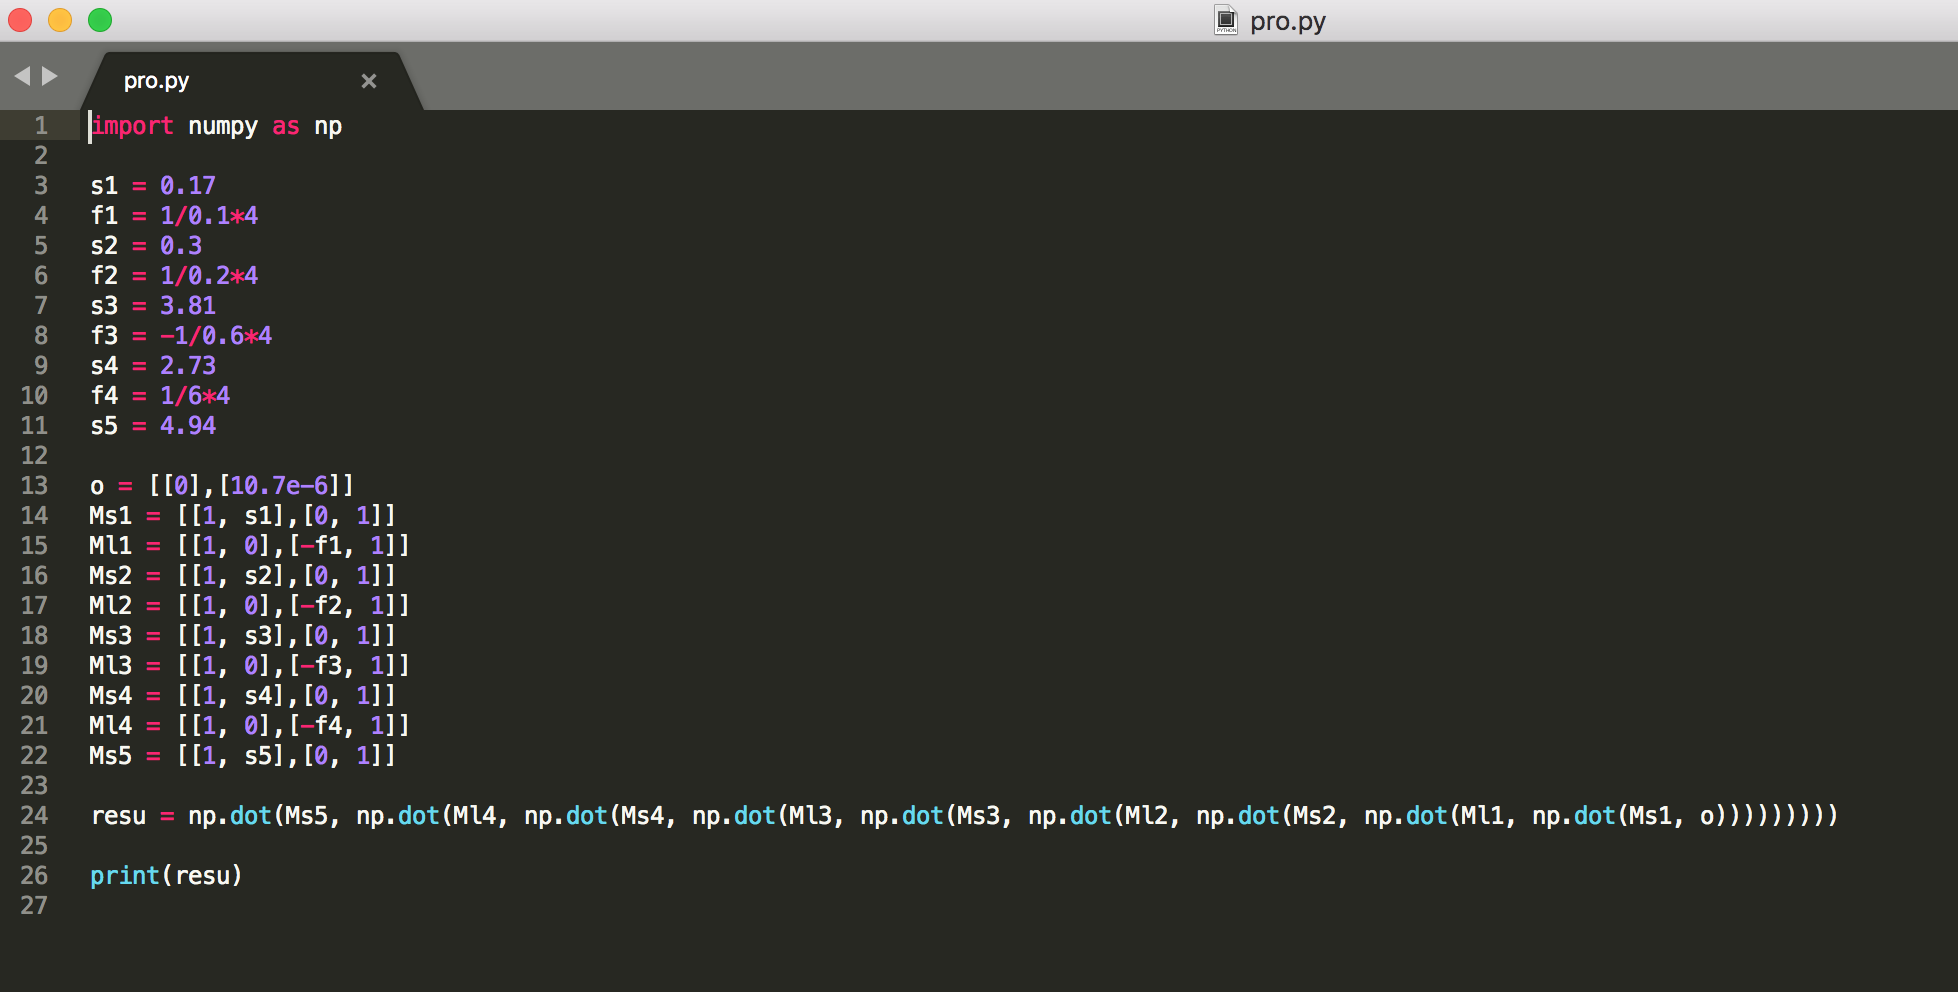
By using ABCD matrix, I propogate the AOM dithering from AOM to filter cavity import mirror. Here we modulate AOM with a very large amplitude (2MHz) and small velocity.
In this case, I got the result of 0.012m dithering on AOM.
The calculation is attached.
The serial number of AOM is MT110-A1.5-VIS. I checked the manual today. The best input modulation voltage is 1V. There is also one information about the seperation angle's relationship with wavelength. However, the manual is so sketchy that I cannot understand clearly.
Bad thing: The operating manual is only availabe for someone has account of that company!
Today, We tried to use smaller value of beam radius. I found that this can make coupling better. From 0.1mV to 0.2mV. The input laser is 5mW.
The fiber detector(DET01CFC/M) is 3.5V(5.5mW), that means we have 0.0003mW comes out from fiber now. This is definitly smaller than the case of last week. The coupling is only 0.01% now.
The procedure I did is like this:
1. Without inserting fiber, check the laser is almost going through the center of collimator.
2. Insert the fiber to collamitor, then adjust the x and y of collimator.
3. At the same time, use multi-meter to monitor the fiber detector(without using 50 Om). Until the voltage goes beyond the range of multi-meter, we start to use 50 Om.
4.Now you will 0.1mV on the multi-meter. Usually, this is the time to use two sterring mirrors to maximaze the coupling.
I did this procedure many times, but still the best result is 0.2mV. It seems something maybe wrong.
(By the way, I spoke a wrong thing during today's optics meeting. When we can read 0.1mV on multi-meter, the output of fiber is very weak! I am so sorry that I remember something wrong!)
Yesterday, we installed a telescope in front of the collimator of fiber. The purpose is to make the output of this telescope have the same beam radius ( roughlty, r=1500um )with the output of fiber.(the simulation of telescope is in Fig.3)
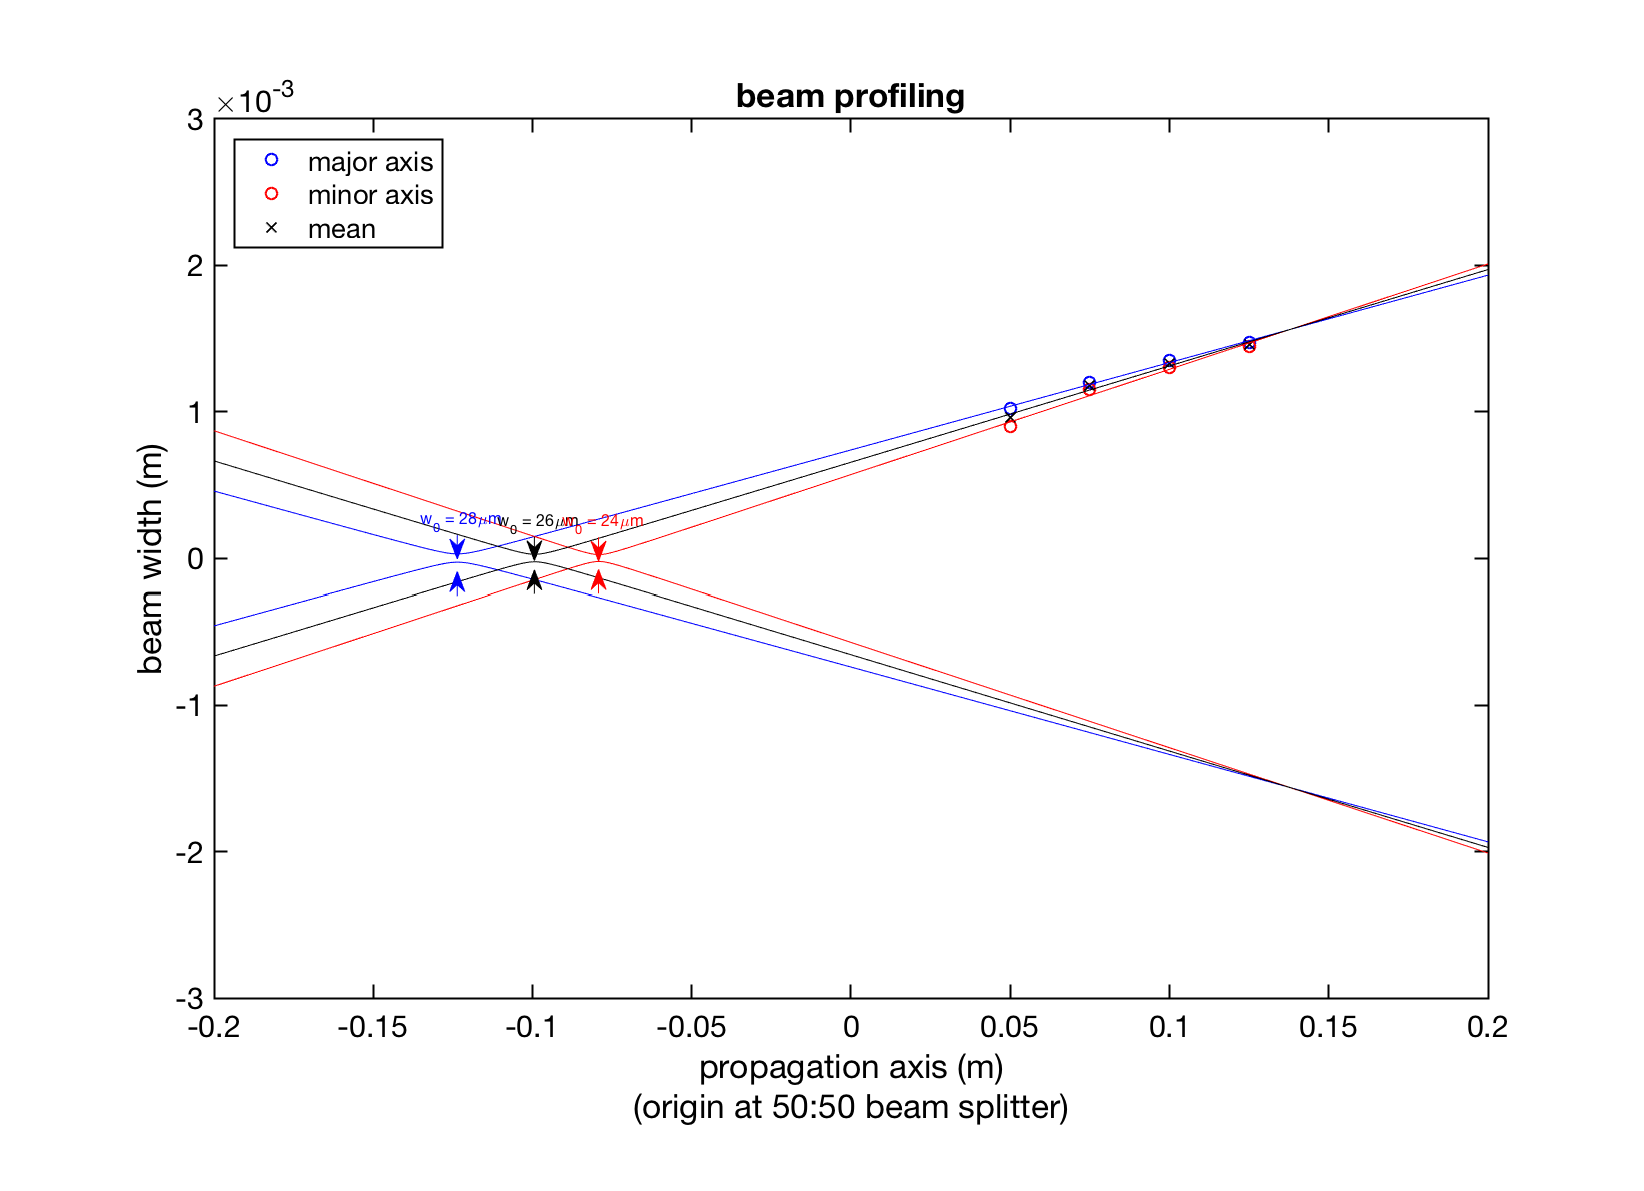
However, during the simulation and installation of this telescope, we found the result doesn't agree with what we found in practise. We measured the beam parameter of AUX1 again.(the parameter of AUX1 is shown in attached Fig.1, we should say that the origin of this measurement is the head of laser box)
Today, We tried to use smaller value of beam radius. I found that this can make coupling better. From 0.1mV to 0.2mV. The input laser is 5mW.
The fiber detector(DET01CFC/M) is 3.5V(5.5mW), that means we have 0.0003mW comes out from fiber now. This is definitly smaller than the case of last week. The coupling is only 0.01% now.
The procedure I did is like this:
1. Without inserting fiber, check the laser is almost going through the center of collimator.
2. Insert the fiber to collamitor, then adjust the x and y of collimator.
3. At the same time, use multi-meter to monitor the fiber detector(without using 50 Om). Until the voltage goes beyond the range of multi-meter, we start to use 50 Om.
4.Now you will 0.1mV on the multi-meter. Usually, this is the time to use two sterring mirrors to maximaze the coupling.
I did this procedure many times, but still the best result is 0.2mV. It seems something maybe wrong.
(By the way, I spoke a wrong thing during today's optics meeting. When we can read 0.1mV on multi-meter, the output of fiber is very weak! I am so sorry that I remember something wrong!)
The total amount of power not coupled inside the FC is composed of the mode-mismatch and the sidebands.
The sidebands maximum are respectively : 0.1462 and 0.1422 mV (this takes into account the background value).
This means that 11.84% of the light is not coupled inside the FC.
I think there is a factor 2 missing in the formula: the pole of the cavity is FSR/(2*F) = 500000/(2*4355) = 57 Hz
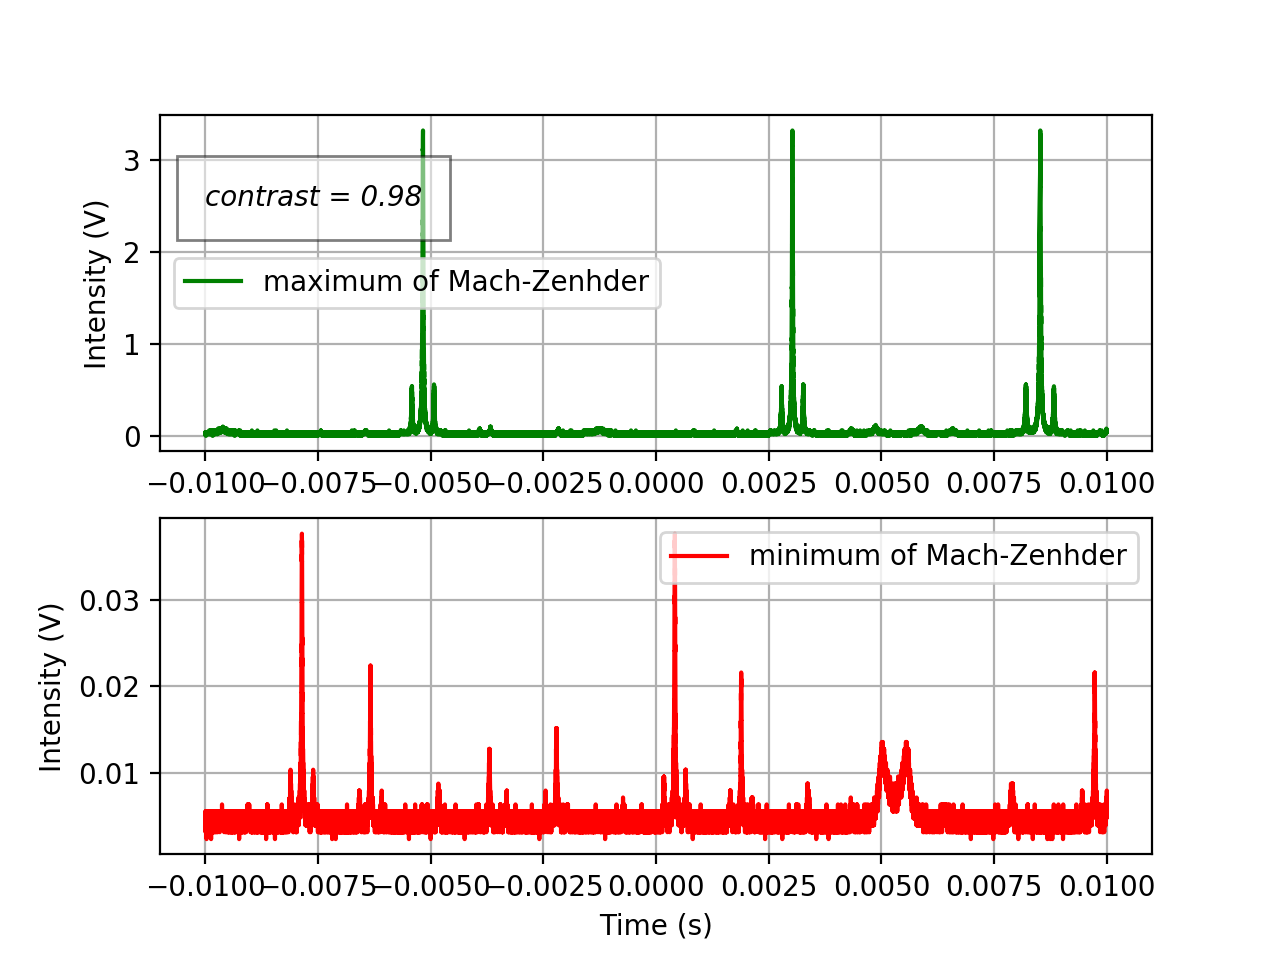
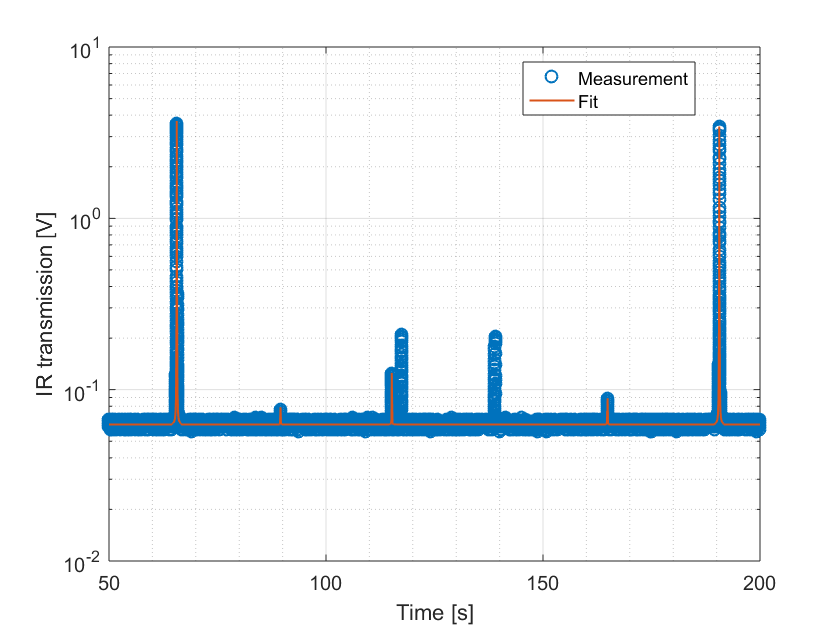
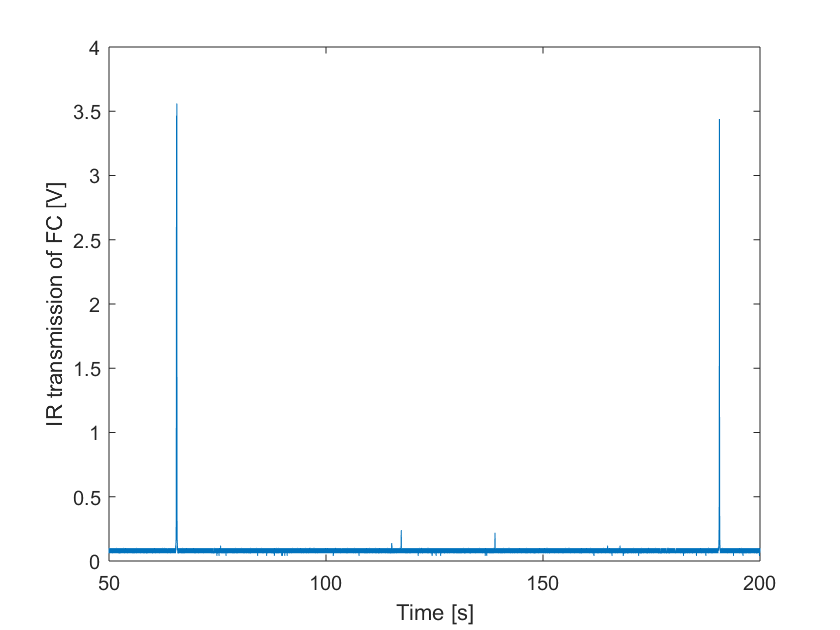
After the installation of mode cleaner, we measure the contrast again. This method is like this
We use the high voltage driver of MZ as an offset adder. By giving different offset to it, we can have almost all light transmit or almost no light transmit.
Then we record the highest peak hight while almost all light transmit. Record the highest peak hight while almost no light transmit(actually, this is the time when TEM00 almost vanishes).
We got result like attached picture 1.
However, I don't know if this is the right calculation method. (Maybe I should do like Marc did for FC scan, intergrate all the peaks in-between a FSR?)
Corresponding to the comment of Eleonora, the bandwidth of filter cavity for infrared is 114Hz but not 55Hz. Then I think we can explain the result (almost).
bandwidth=FSR/Finesse=500000/4355=114
According to the signal we send to DDS board, the modulation frequency of we give to EOM is 15.2MHz. The FSR is 0.5MHz.
15.2/0.5=30.4
So we will have additional 0.4 of FSR. This exactly explains the result we have on the oscilloscope.
Participaint: Marc, Matteo
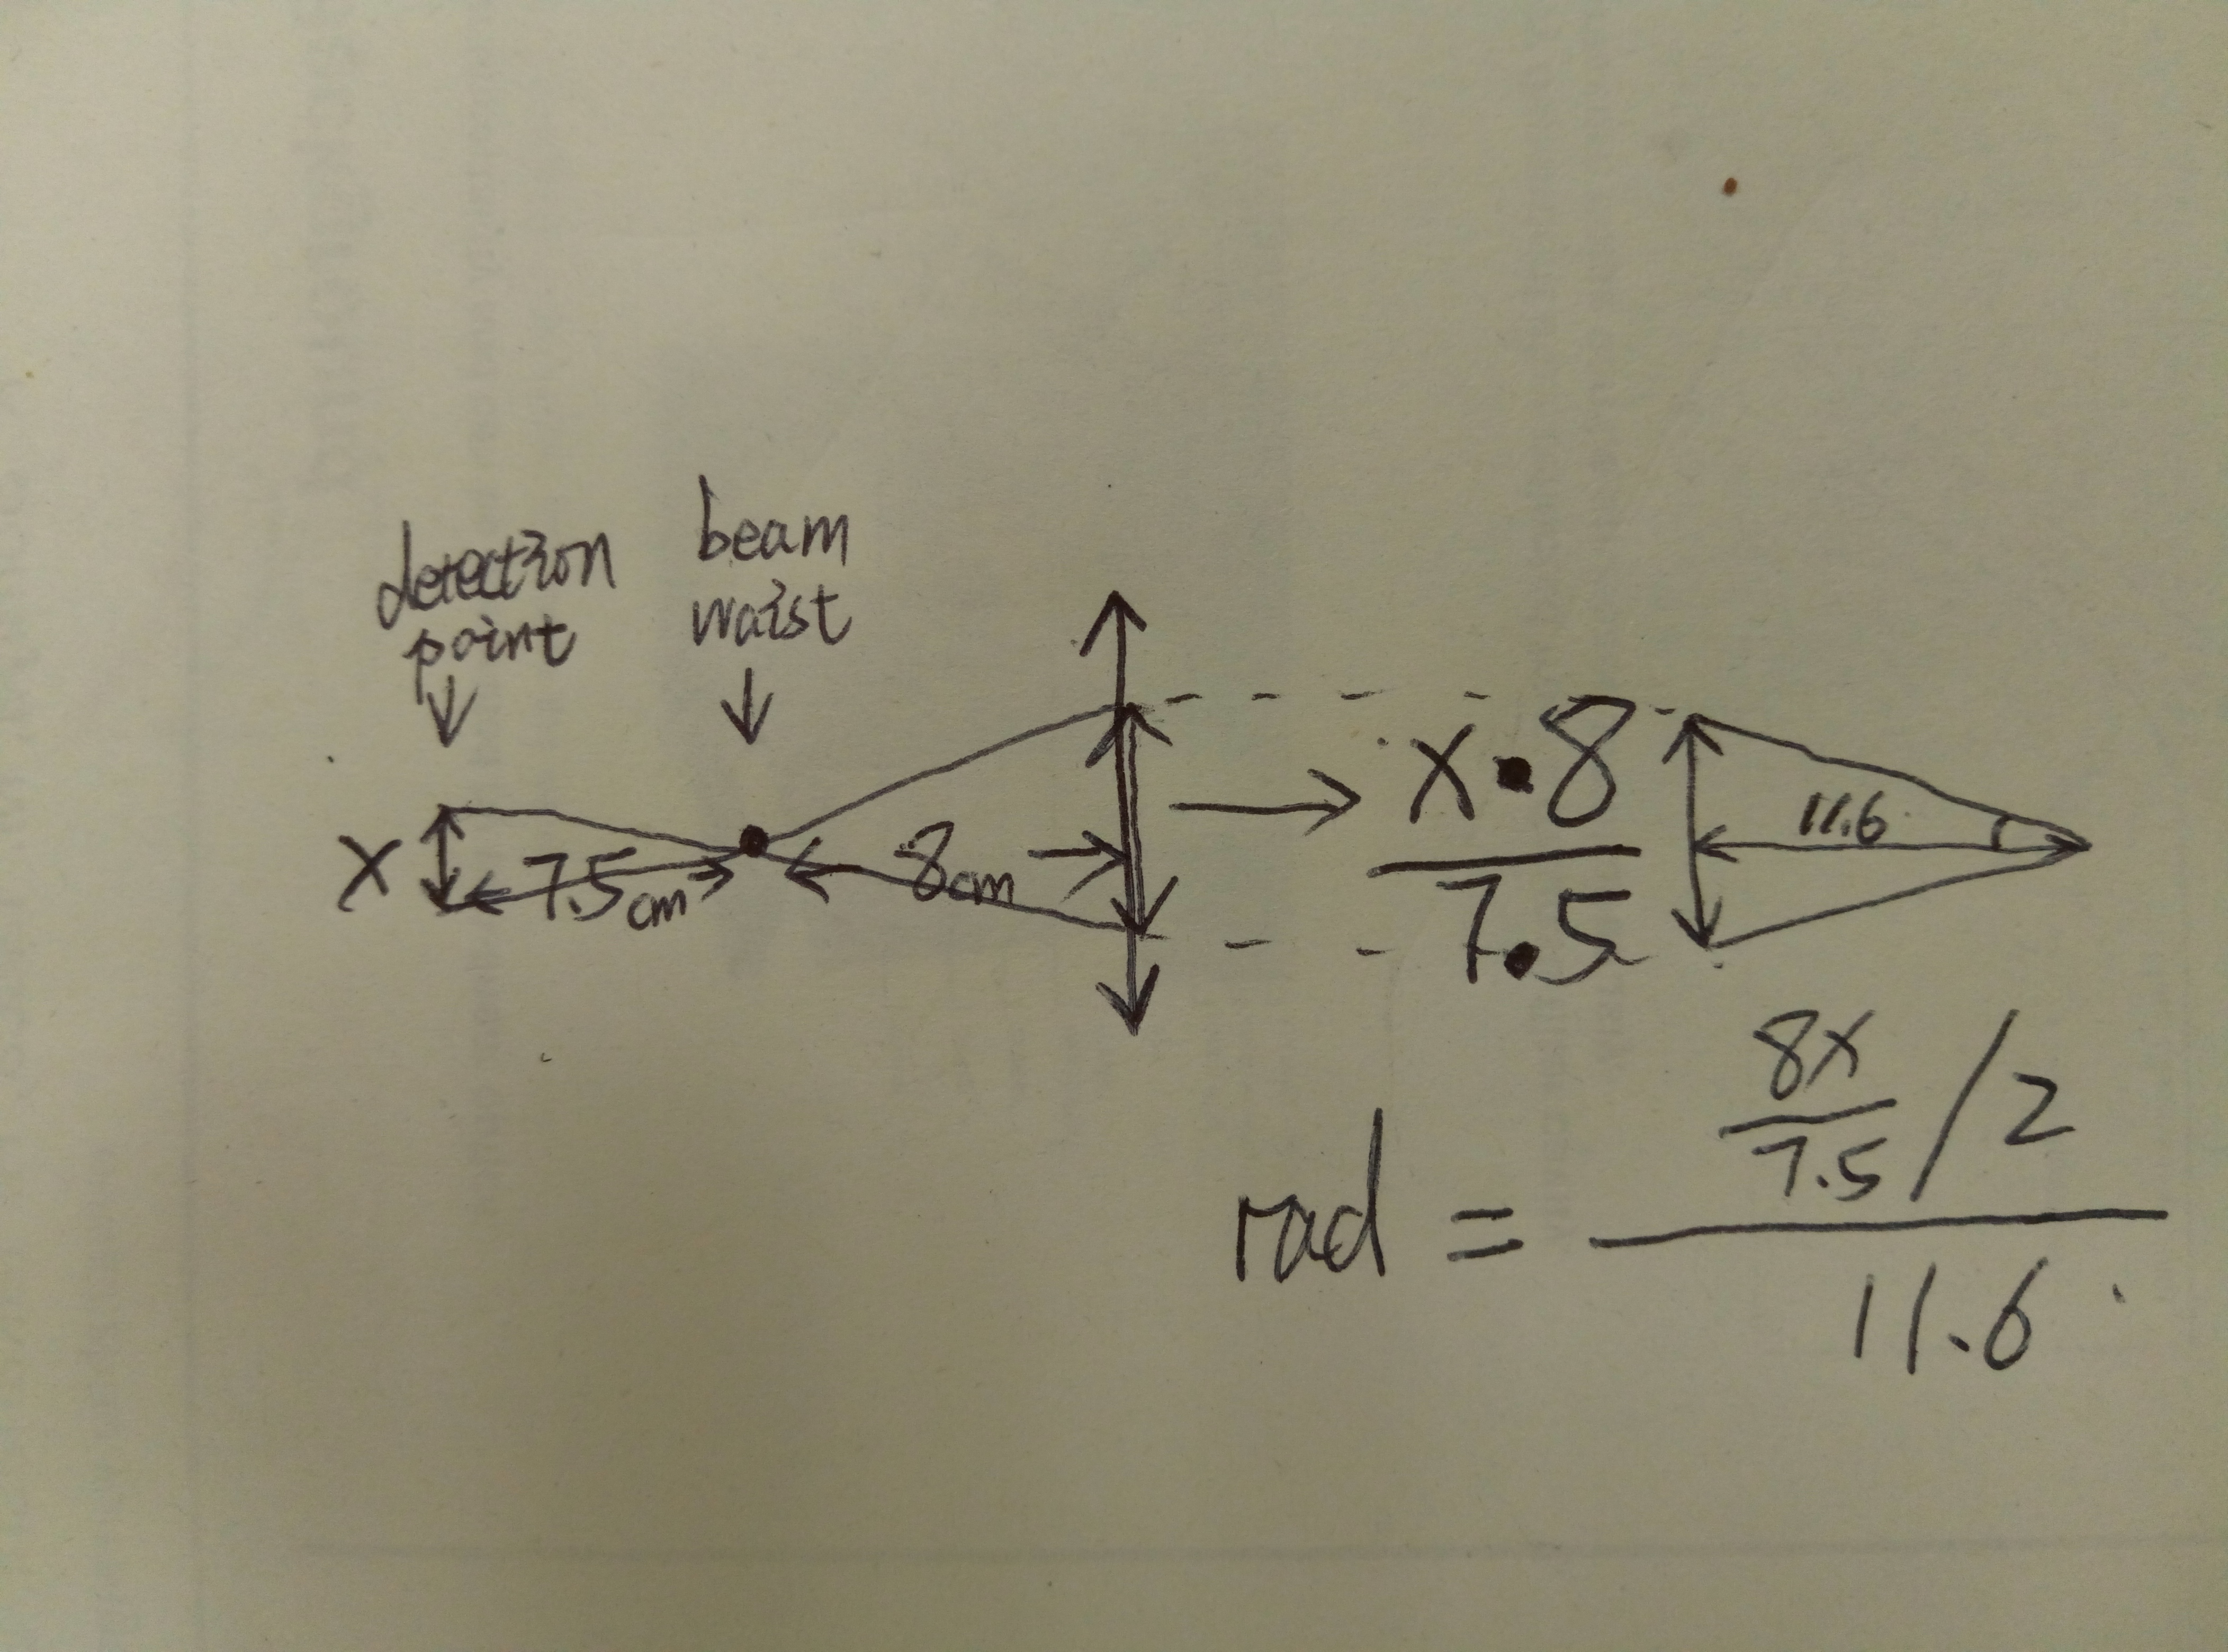
We used PSD(position sensitivite detector) to detect the beam dittering incured by AOM modulation.
The modulation information of AOM: 2MHz(pk-pk), 10Hz(50ms for a half period). This gives us AOM scanning velocity of 40MHz/s. (this is really a fast scan!)
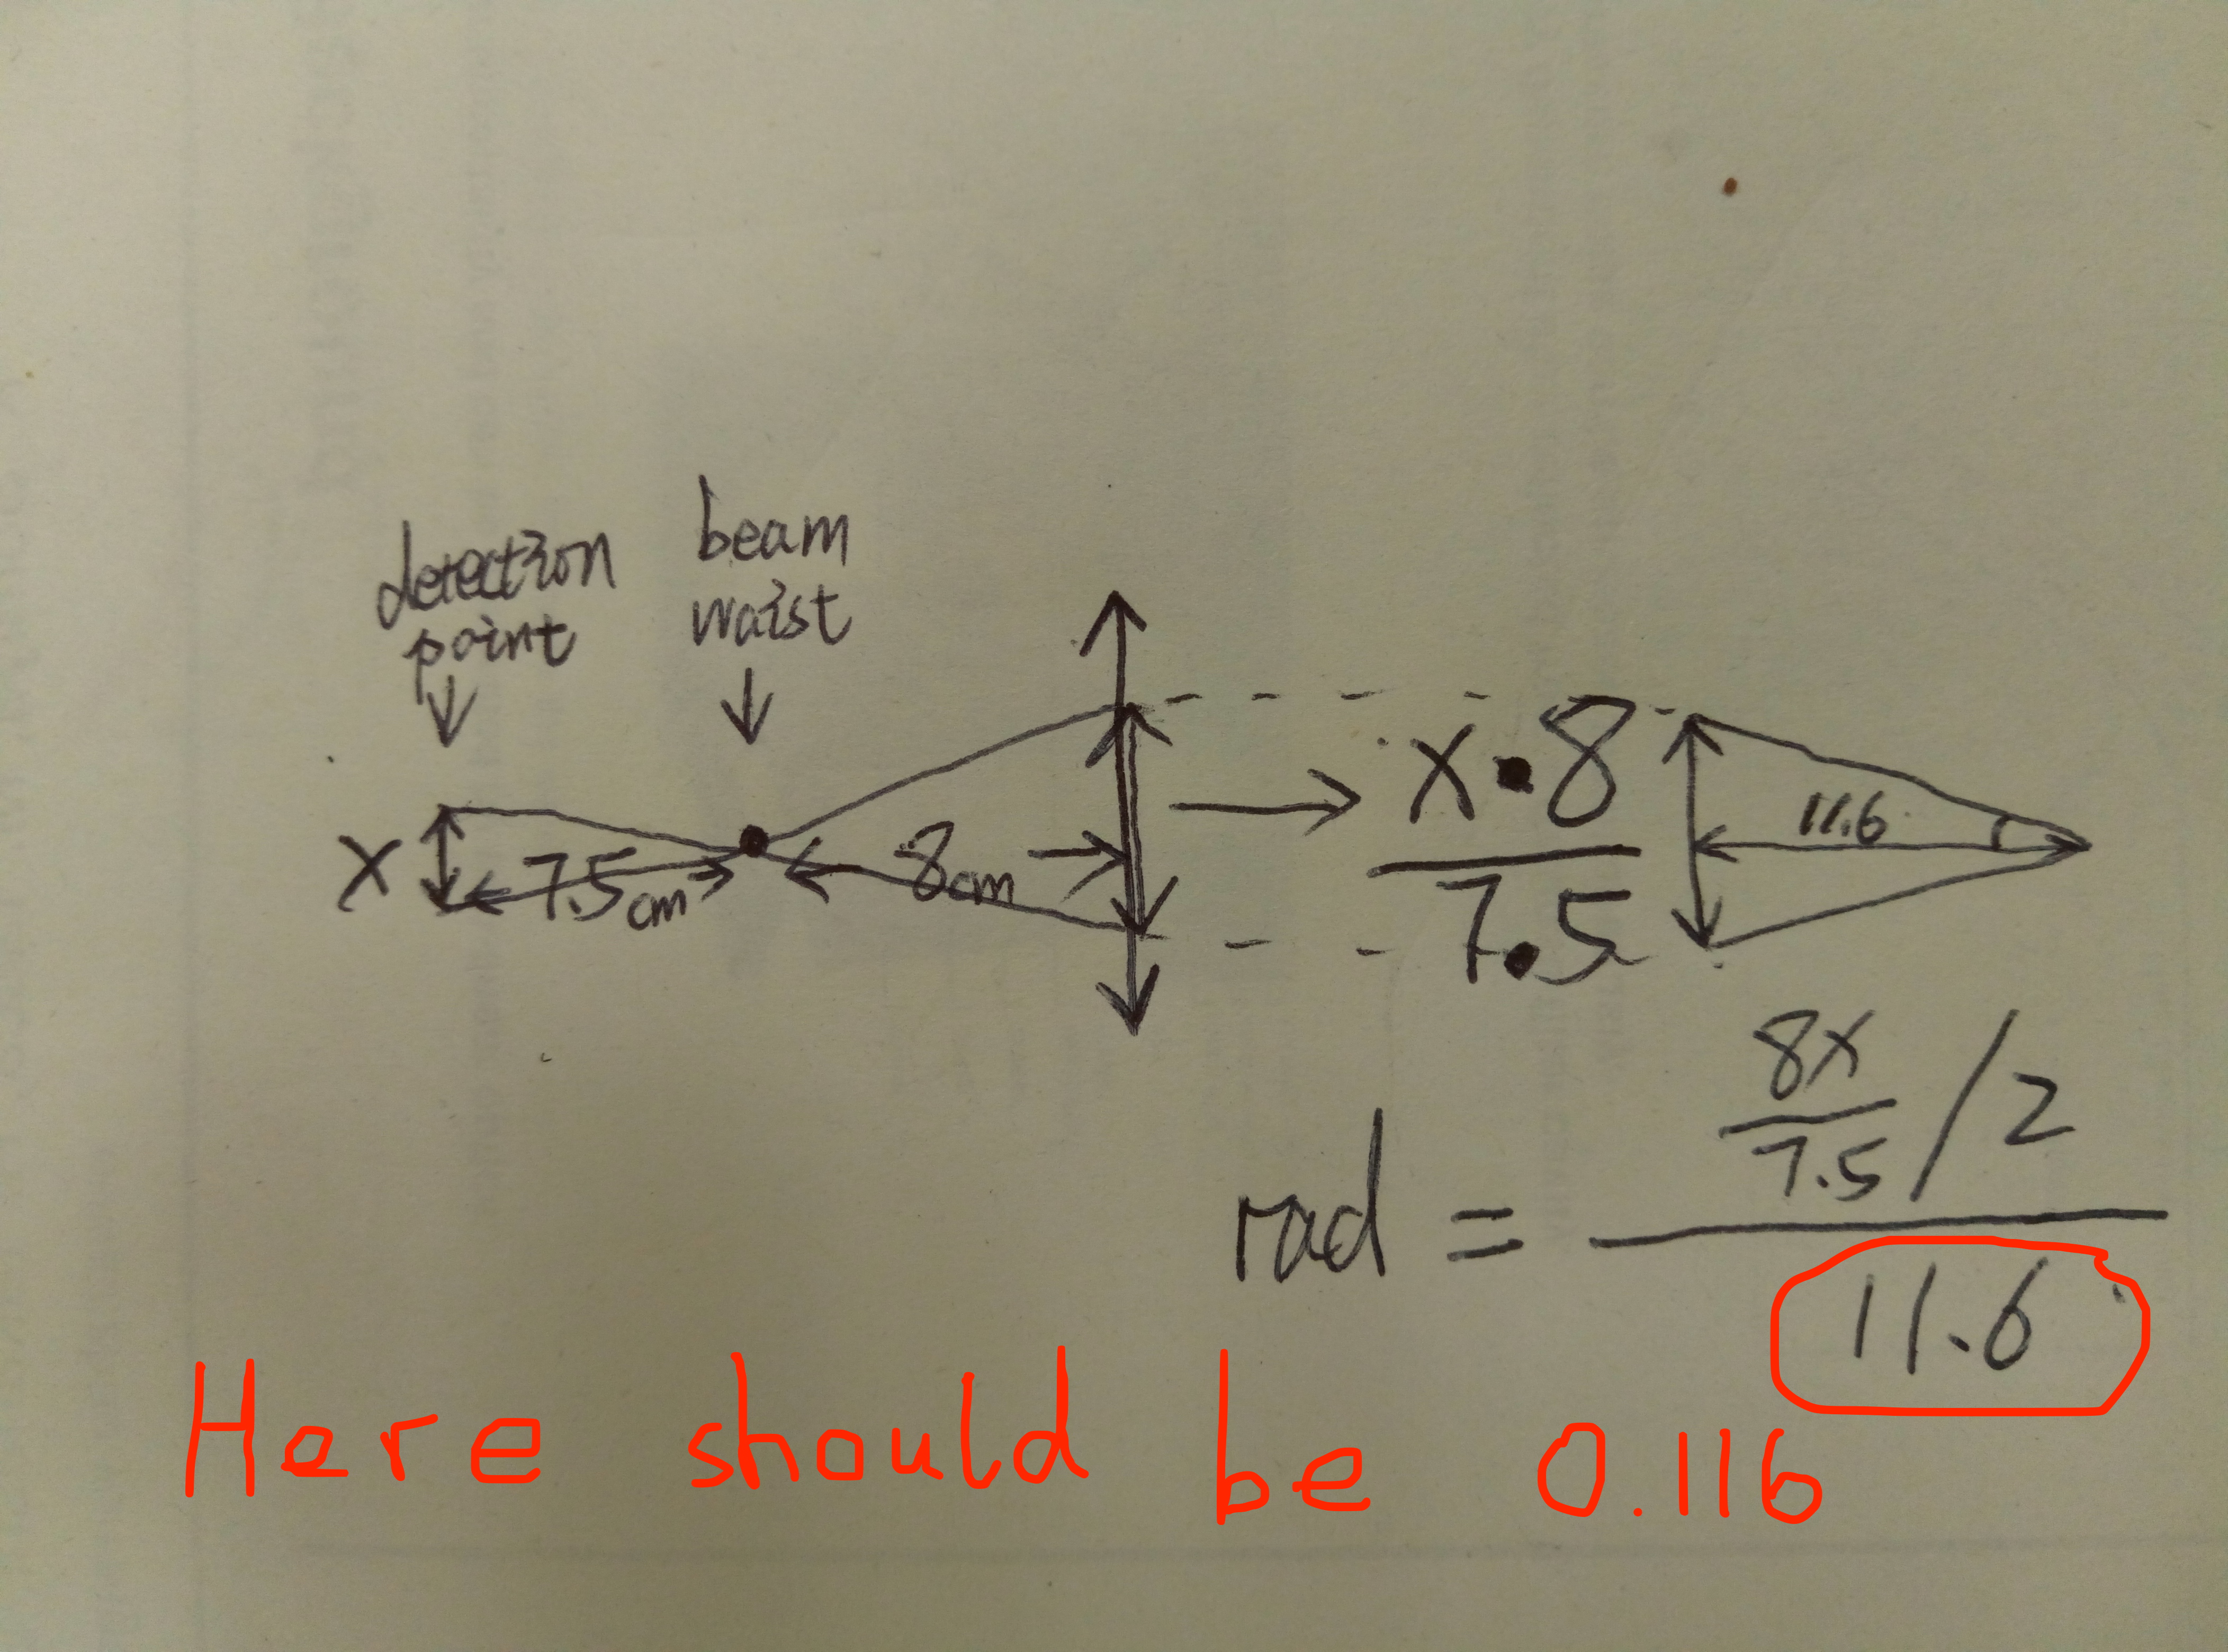
We put PSD inbetween the telescope after AOM. Although this gives us diffcuilty, but this is the only proper place to put PSD. See attached picture 1 to know how can we propagate the dittering back through the lens.
The calibration we use the result of entry 276. It is 0.0071[m/V]. We use it to transfer the voltage change of PSD to the beam dittering in meter.(Then we got "x" in attached picture 1)
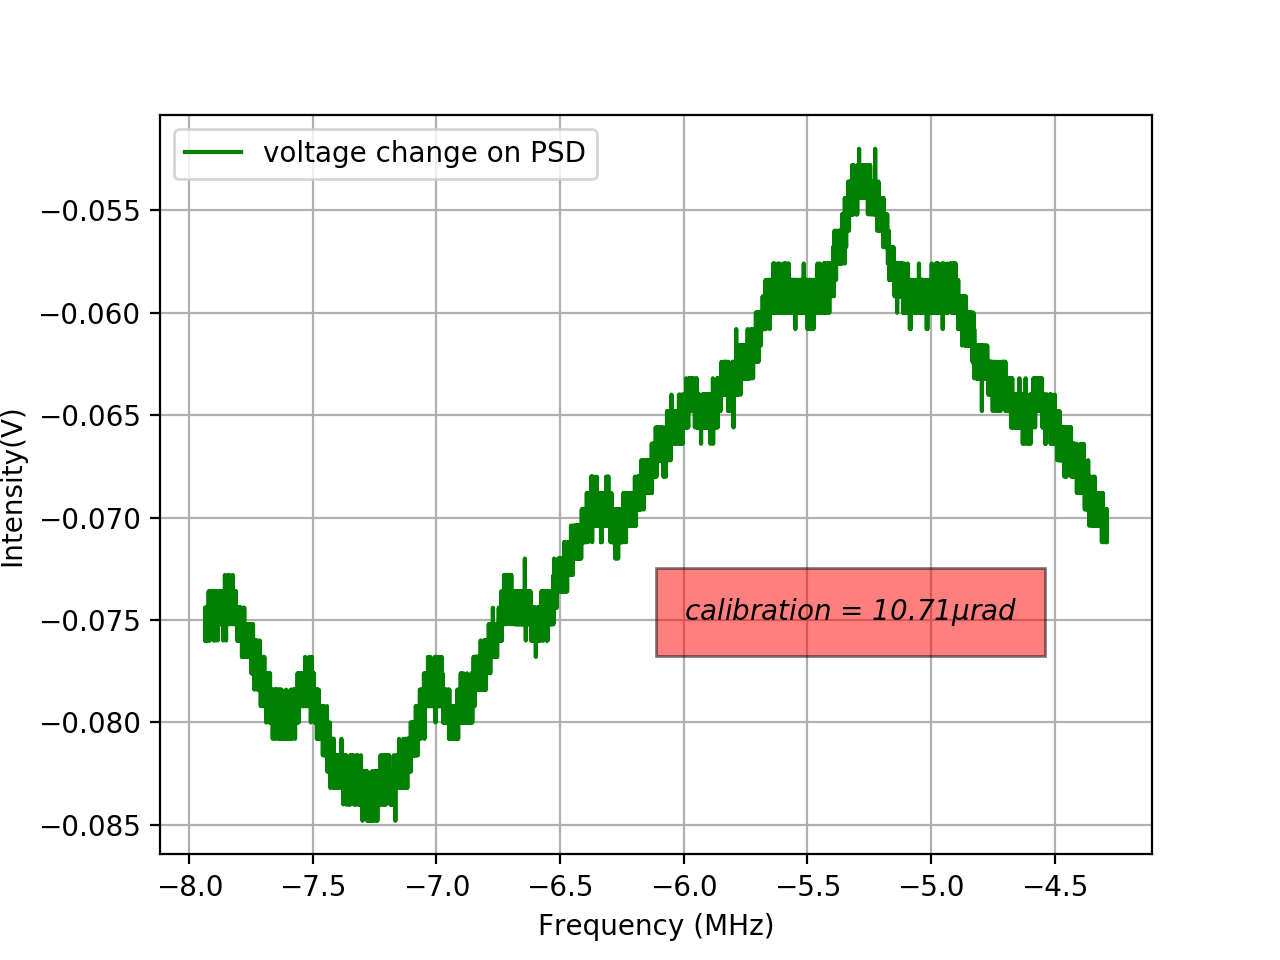
Conclusion: See attached picture 2. We have 10.7e-6[rad] angle change corresponding to frequency change of 2MHz.
The serial number of AOM is MT110-A1.5-VIS. I checked the manual today. The best input modulation voltage is 1V. There is also one information about the seperation angle's relationship with wavelength. However, the manual is so sketchy that I cannot understand clearly.
Bad thing: The operating manual is only availabe for someone has account of that company!
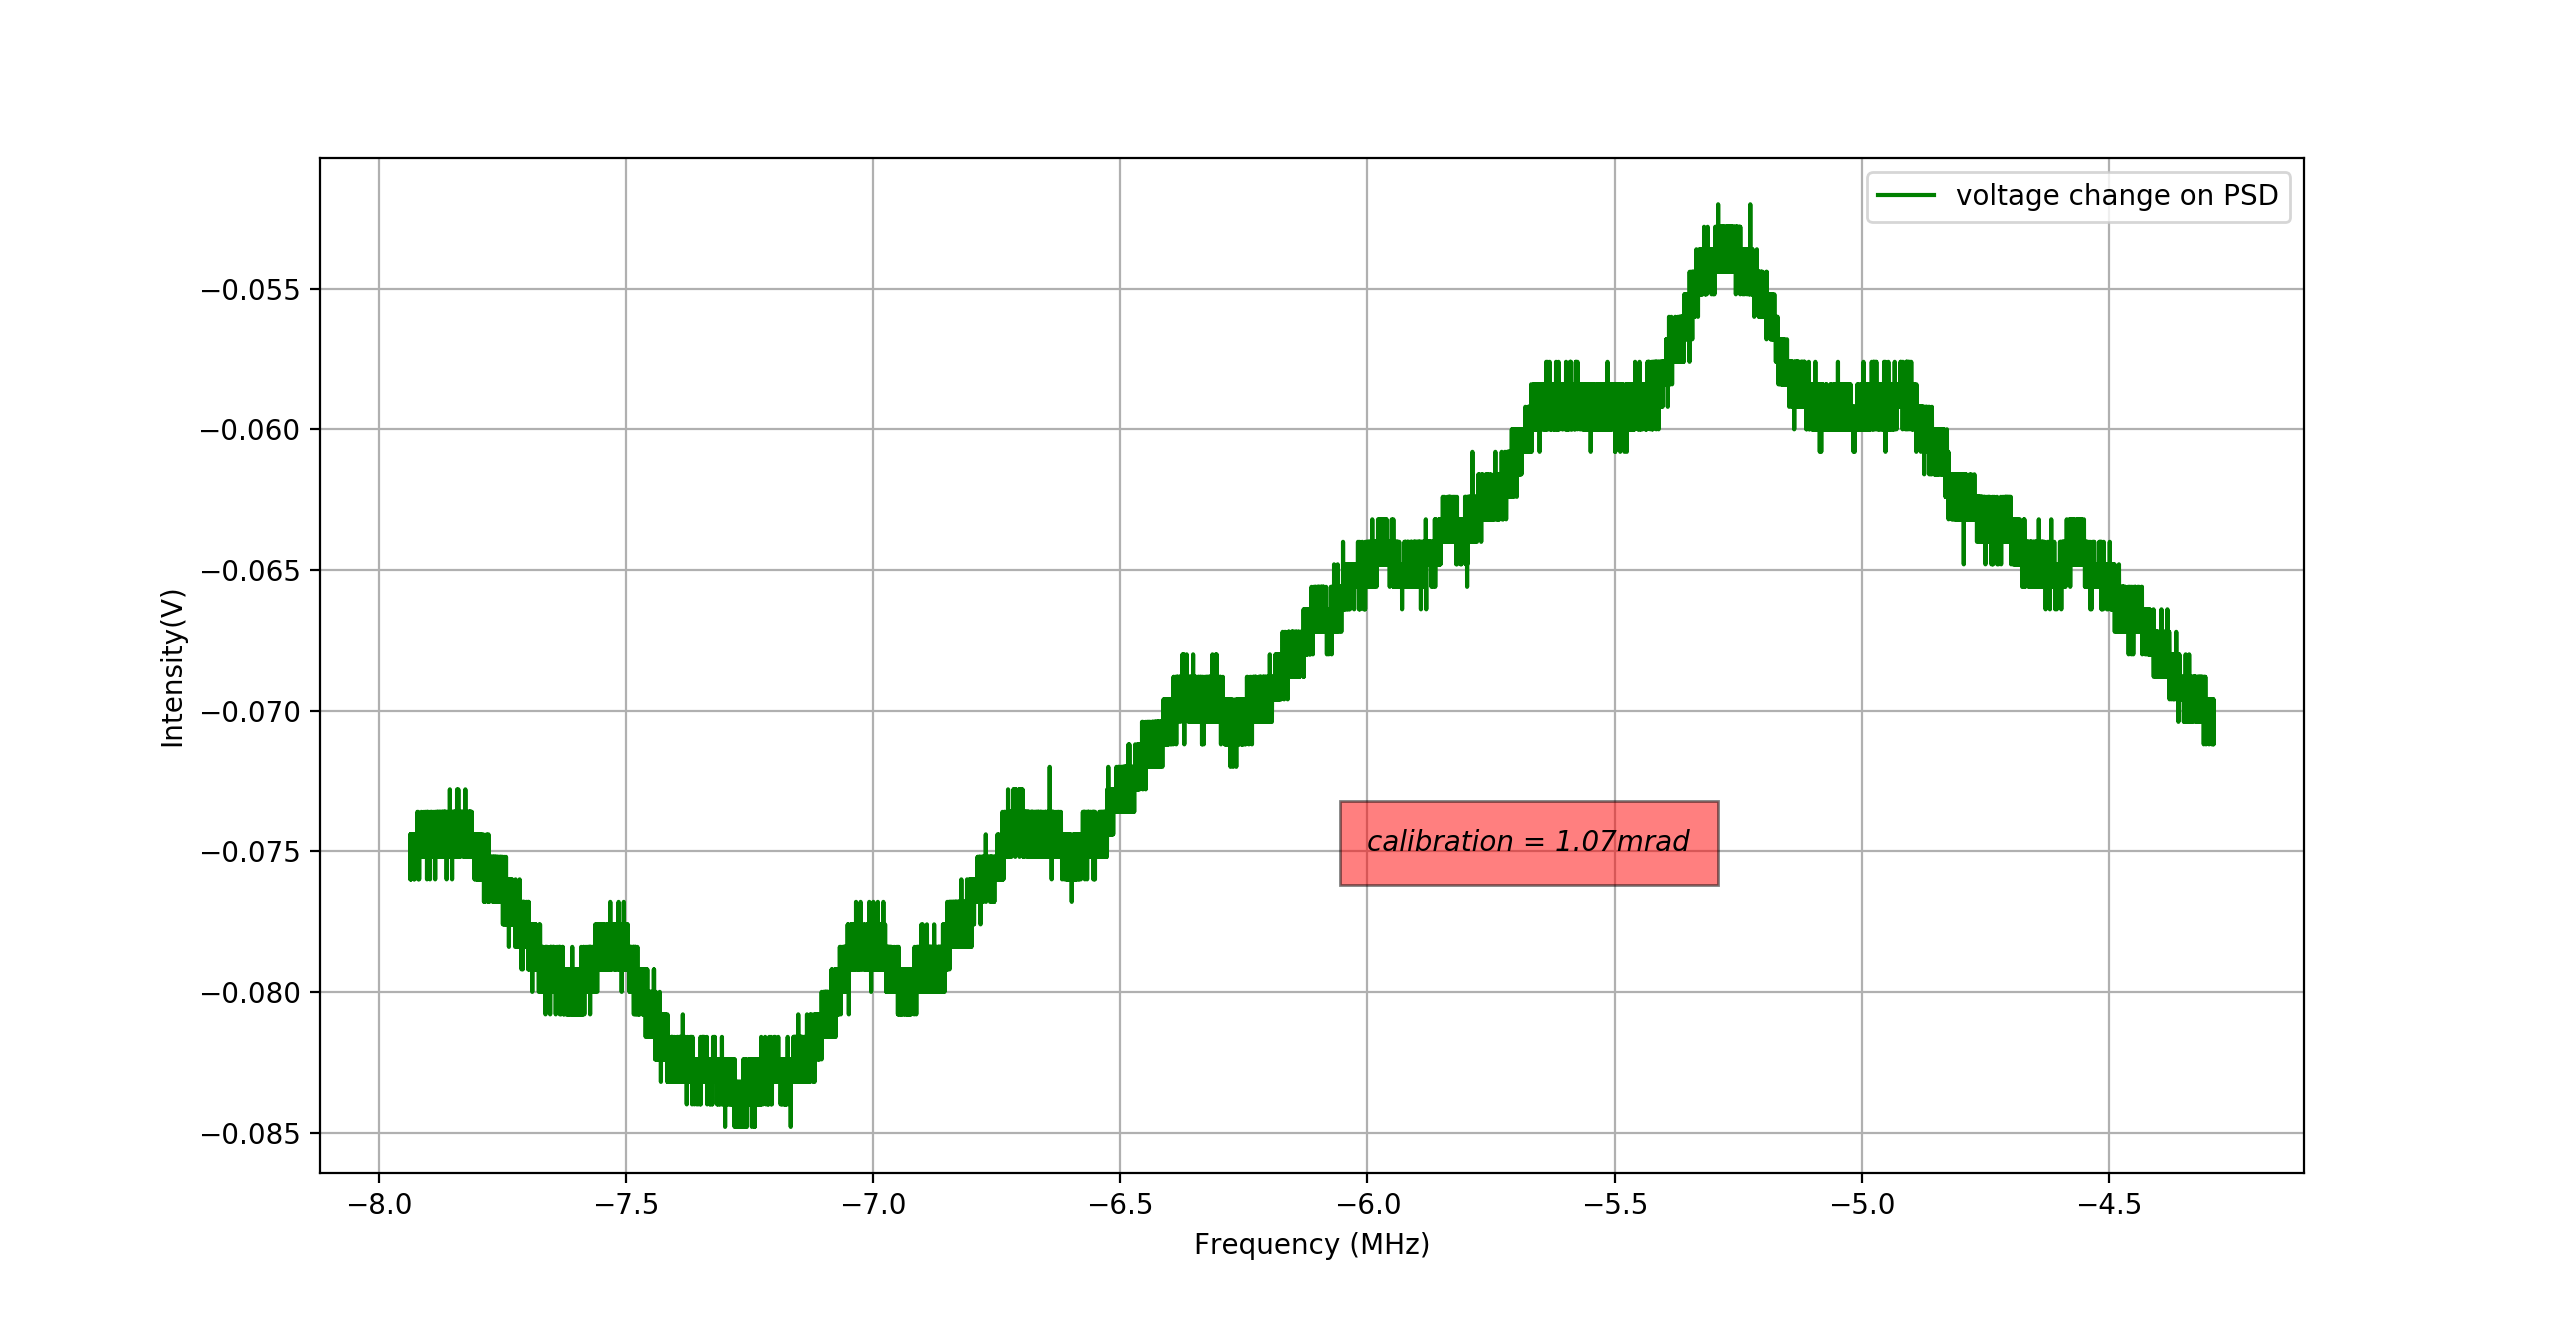
I find there is a mistake in the calculation, see attached picture 1. I used a wrong unit for a number. After the correction, I plot the result again(see attached picture 2)
Now the error on AOM is 1.07mrad.
Participants: Yuhang, Yuefan, Matteo
Today we tried again to couple the laser beam into the fiber.
But first, we moved the two steering mirrors and collimator closer to each other. Since the further the distance, every time the movement on the collimator input is larger.
Then by adjusting the two steering mirrors and the x, y screws of the collimator, we are able to reach 10V(maximum) on the photodiode which corresponds to 5.5mW which is even larger than the input laser power.
We found out this is because the oscilloscope has a high impedance which will amplify the power. So we add a 50ohm resistor and we could get 10% beam power coupled into the fiber and after that, it became difficult to improve more.
According to Thorlab website, this collimator should have 2.09mm at the output, but now with a 200mm focal length just after the laser output, we have a beam at the collimator around 400um in radius.
So we did a bit simulation, in order to get the right size of the beam we should combine one -100mm and one 200mm lens. We will try to change the setup tomorrow.
Participants : Marc, Yuefan, Yuhang
Here is presented the FC scan.
Compared to entries 771 and 775 few corrections have been implemented.
There was a mistake in the first estimation of the mode-mismatch (2 order 0 have been taken into account as well as the 2 sidebands).
There was another mistake done while doing the fitting : Now we used 1 Airy function defined by the 2 order 0 and then only changed the normalization value (T0).
We obtain the following results :
r : 0.9992
FSR : 125 s (the AOM frequency modulation have been changed but we still have FSR=500 kHz)
T0 (normalization factor) : 3.6374 0.0164 0.0604 0.0274 0.0119 0.0262 3.3774
x0 : 65.62 89.52 115.155 115.208 164.78 164.88 190.62
The mode-mismatch was evaluated using the ratio sum of higher order modes T0/ fundamental mode T0.
This leads to a mode-mismatch of 3.9%.
Few things to notice :
The position of the sidebands needs to be confirmed
While modulating the AOM frequency to realize the scan, the beam exiting the AOM is tilted which leads to the different heights of the fundamental order peak (?)
According to the signal we send to DDS board, the modulation frequency of we give to EOM is 15.2MHz. The FSR is 0.5MHz.
15.2/0.5=30.4
So we will have additional 0.4 of FSR. This exactly explains the result we have on the oscilloscope.
The total amount of power not coupled inside the FC is composed of the mode-mismatch and the sidebands.
The sidebands maximum are respectively : 0.1462 and 0.1422 mV (this takes into account the background value).
This means that 11.84% of the light is not coupled inside the FC.
Participants : Marc, Yuefan, Yuhang
We did another FC scan.
Using 2 differents scales to see the fundamental mode and the other higher order modes we could have a quite good precision on every order peak.
By fitting every resolvable peak by an Airy function and using the ratio Area of fundamental mode / Area of fundamental mode + higher order mode,
We found that 95.24% of the light was coupled into the fundamental mode of the FC.
Participants : Marc, Yuefan, Yuhang
Today we continue the alignment of the collimator and the fiber.
Because last time wasn't successful, we decided to use a 1550 nm fiber laser and try to align it at the opposite of its use (inject the laser with the fiber and try to align the output of the collimator).
If we could align it using an IR card, it was not possible to use a power meter nor the beam profiler due to this wavelength.
We decided to go back the first way of aligning this collimator (laser at the input of the collimator and check the power at the output of the fiber).
We decided to use 2 sterring mirrors (actually one mirror and one 98/2 BS).
We got the following power
output of the Auxiliairy laser : 0.873A -> 29.7mW
After 1 mirror + BS (98/2) : 28.7mW
After collimator : 28.7mW
After the fiber 4.5 uW
We can see some light at the output of the fiber (on IR card, power meter and fiber photodiode).
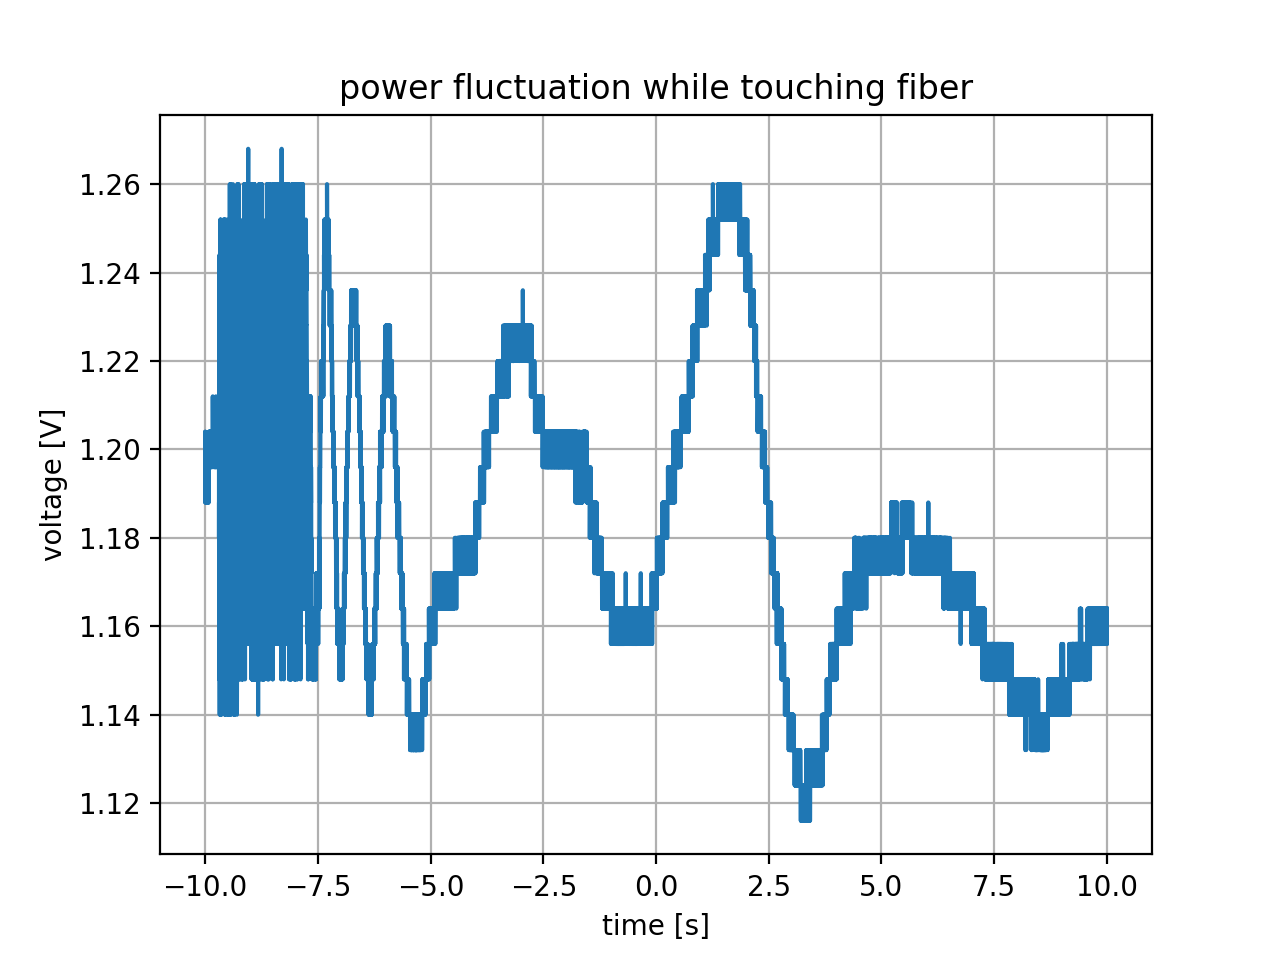
One problem is that as soon as we touch the fiber or the collimator, we see power fluctuations.
This means that between each time we screw we need to wait for few seconds...
It should be useful to find a way to fix the fiber.
Participants : Marc, Yuefan, Yuhang
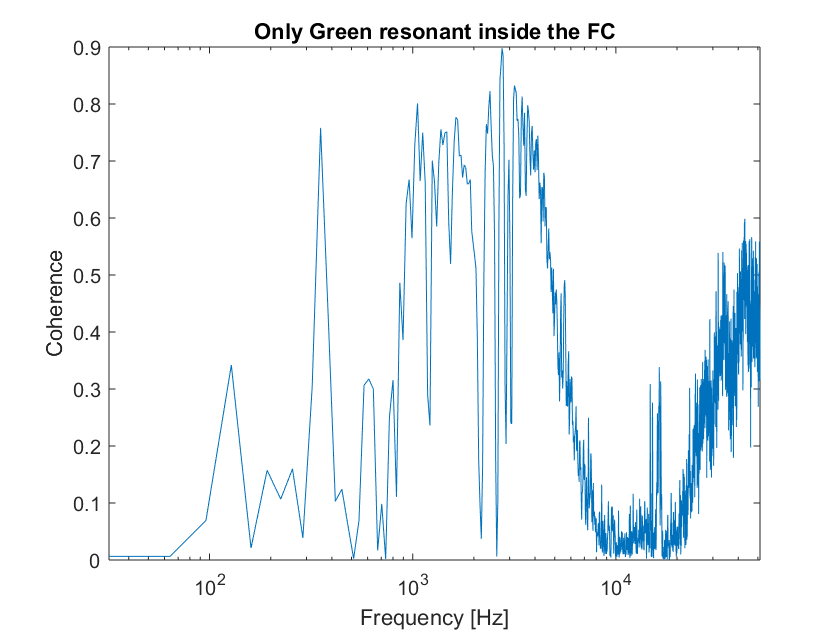
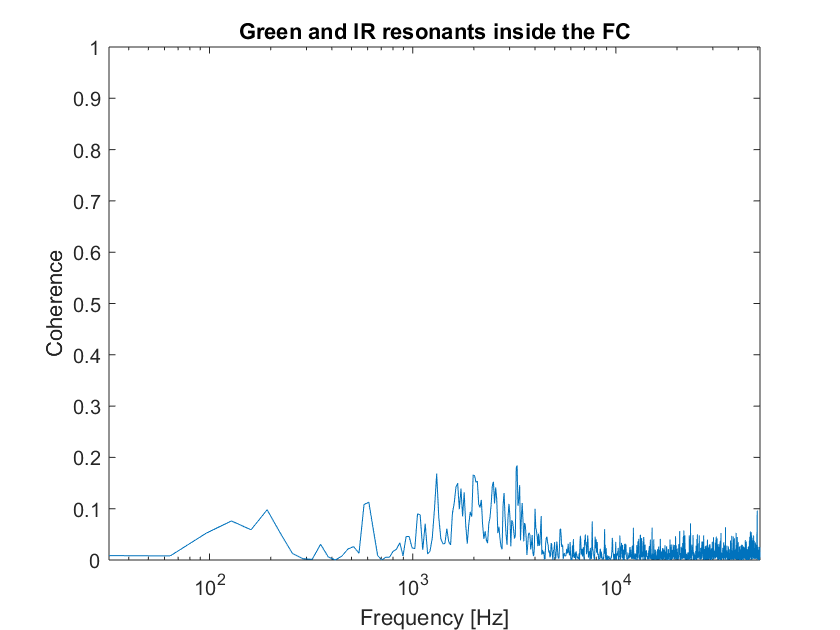
In order to study the coherence between the input laser IR power and the reflection from the filter cavity, we installed a PBS on the IR injection path and a photodiode at its reflection.
We studied 3 cases :
1) Both IR and Green resonants inside the FC (greenir.png)
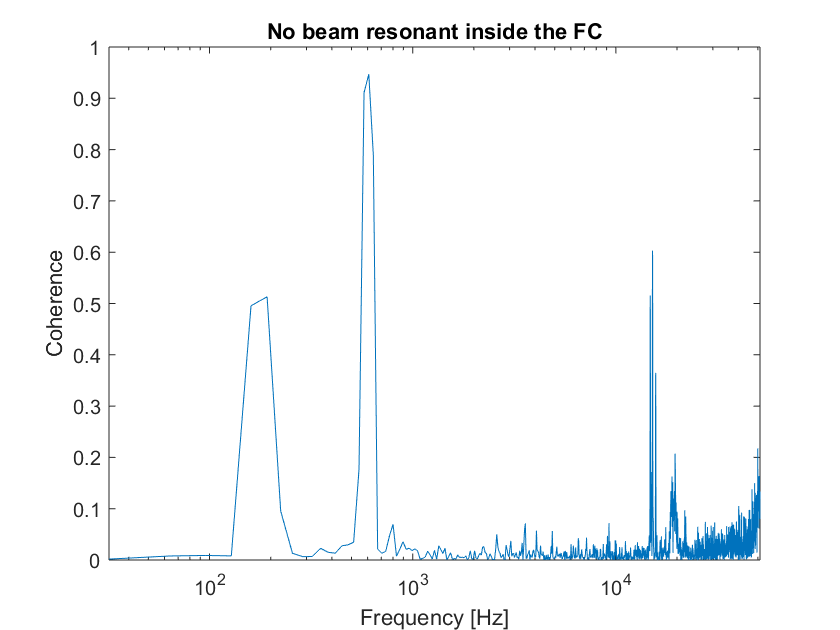
2) No beam resonant inside the FC by misaligning the EM and making sure that there was no attempt to lock on the servo (no.png)
3) Only Green resonant inside the FC by detuning the EOM frequency (green.png)
We were expecting to find similar results between the cases 2 and 3 which is not the case.
We were expecting to find coherence at high frequencies due to power fluctuations only but it only appears in the only green resonant case (maybe the coherent length of IR is too short?)
The no beam case shows clearly a 200Hz peak (ventilation of the clean booth) and a 600Hz peak (turbo pump of BS).

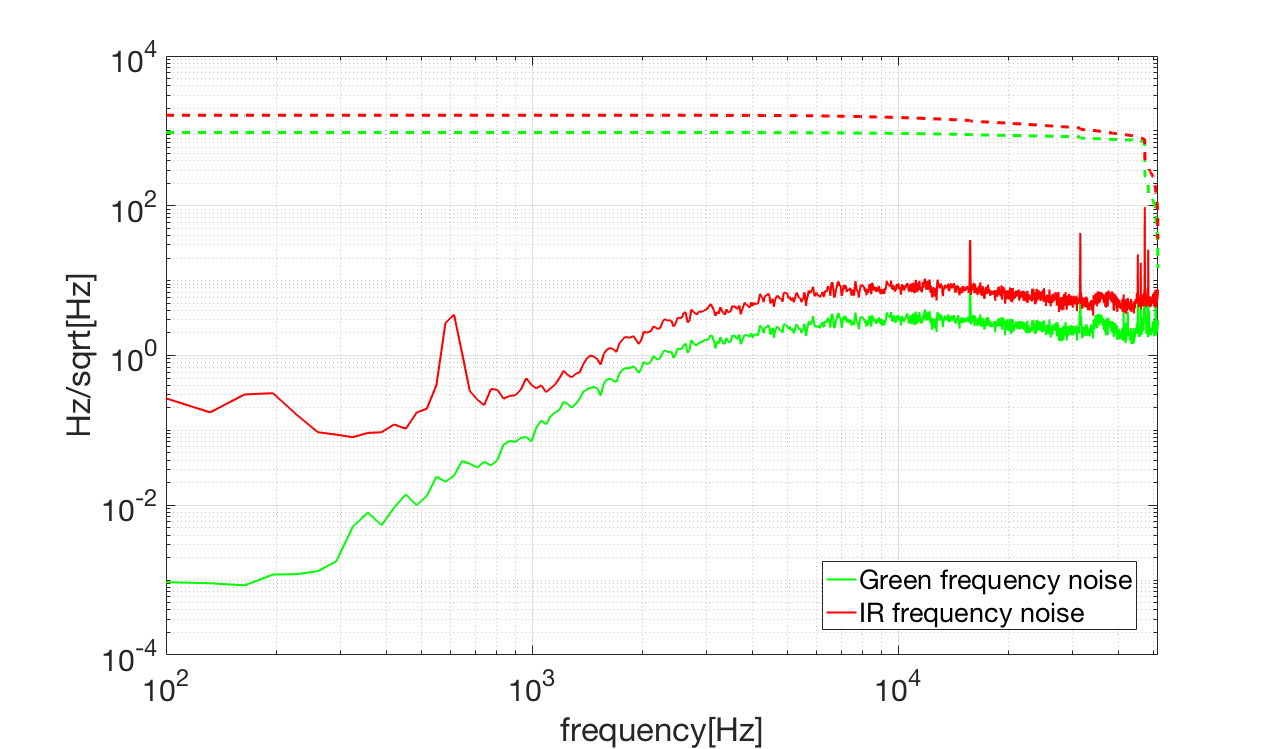
The error signals for green and infrared account for the closed loop laser frequency noise filtered by the pole of the cavity (which is different for green and IR).
In the fist attached plot, the error spectra has been divided for the corrispondig pole in order to go back to the close loop laser frequency noise.
freq nois = err sig * ( sqrt( 1+(f/f0)^2) with f0 = 55 Hz for IR and 1.45 kHz for green
The two curves obtained shoud be coincindents. The discrepancy (about a factor 2.5) suggests that there is maybe an issue with the calibration.
Participants : Marc, Yuefan, Yuhang
Last Friday we did a scan of the FC for IR.
[ In order to obtain a good beam position, the BS pitch correction is close to saturation (9V). It might be useful to move some picomotors in order to have a better beam position and a lower correction]
The scan was performed by modulating the frequency sent to the AOM.
We used the following parameters : 1 MHz for the half peak-to-peak value over a half-period of 2 mHz (the lowest value permitted).
[The "half" values are used as they are what we provided to the AOM frequency generator]
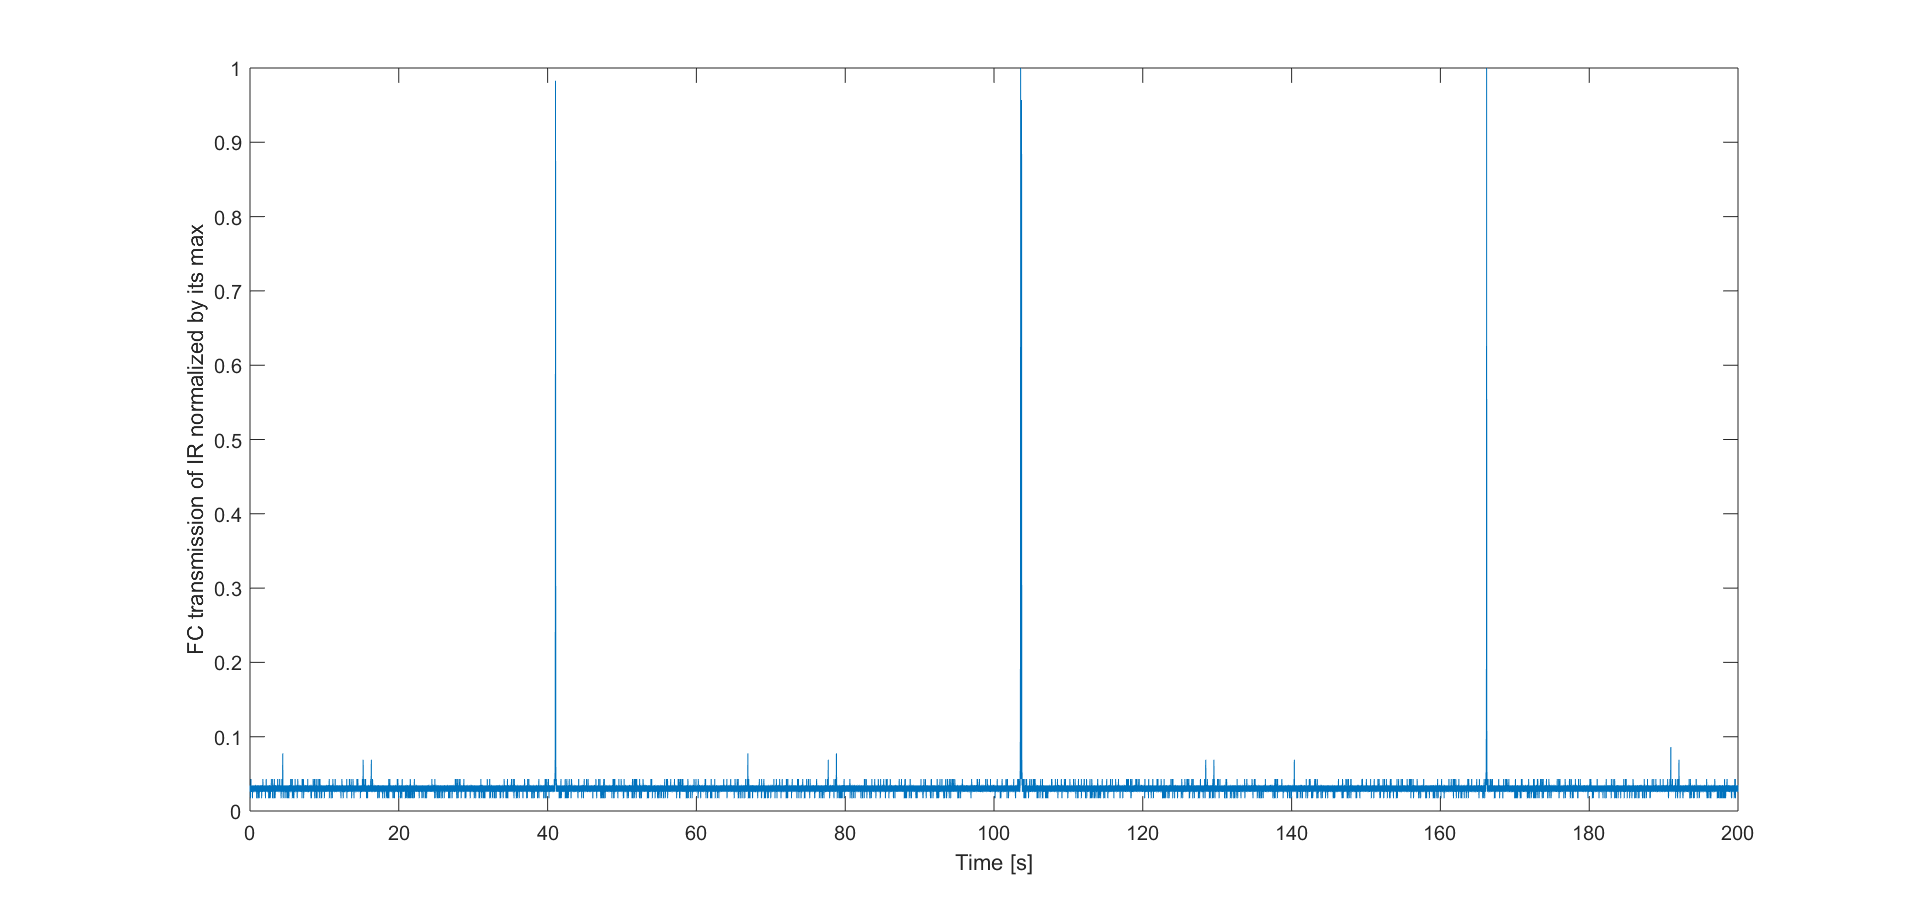
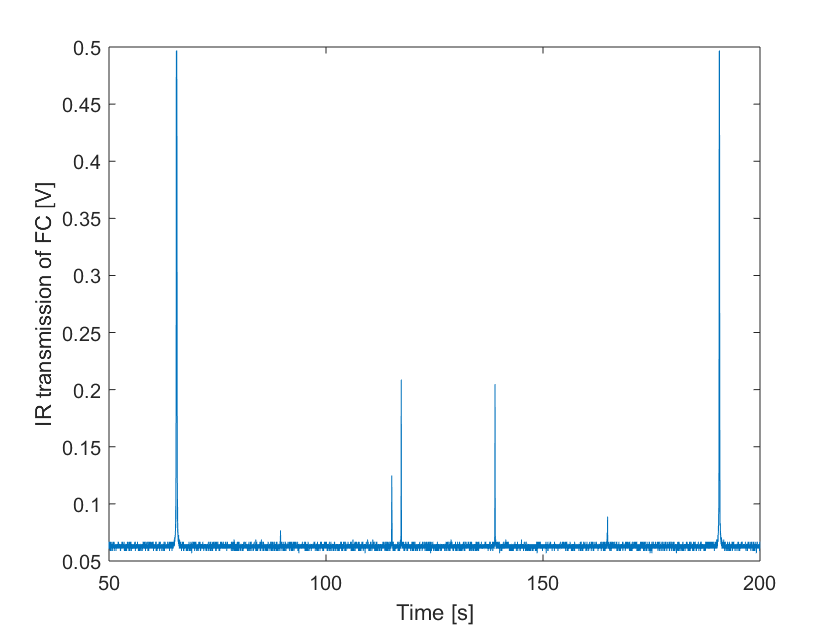
We obtained the result presented in the first picture (FC_scan.png).
Few points to notice :
there is a symmetry at the second peak (if we zoom in we can distinguish 2 peaks)
The vertical scale was not good enough to have a good resolution of the small peaks -> on Monday we will do another scan with 2 scales : 1 to resolve the fundamental mode and another one for the higher order modes.
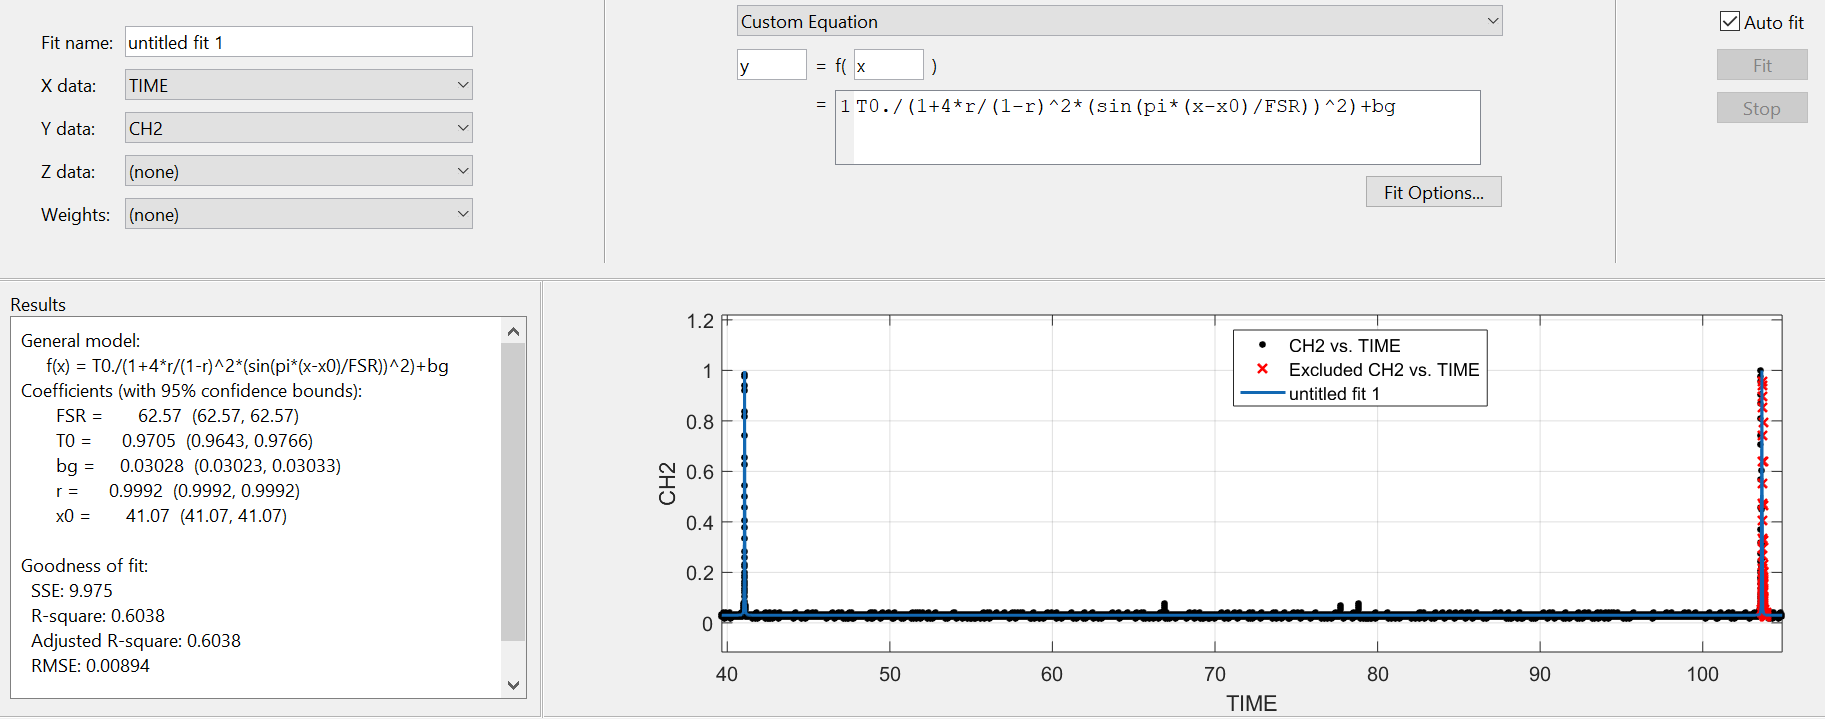
Anyway, as a preliminary analysis of this FC scan, we fitted the first 2 peaks with an Airy function (fig. FCscan_fit) which gives us a FSR of 62.57 s.
By doing : 1MHz / 2mHz * FSR[s] = FSR[Hz] we find a FSR = 500.560 kHz which is in good agreement with the logbook entry #668.
Another preliminary analysis was trying to estimate the losses due to coupling with higher order modes.
The fundamental peaks were fitted with a gaussian function while the (poor resolved) small peaks were fitted by triangles.
By comparing the ratio between the areas of fundamental mode / fundamental mode + higher order modes, we found a mode-mismatch of roughly 10%.
This analysis will be more precisely performed on Monday.