NAOJ GW Elog Logbook 3.2


[Yuhang, Matteo, Eleonora]
On Tue 3/12 morning we found the FC has difficulties to acquire the lock and to keep it, while in the past months lock was very robust and easy to get.
After some investigation (and having tweeked the gain of ramepeato) we found the input power was reduced from 12 mW to 9 mW, due to temperature change of SHG.
The day before the air conditiong was switched from summer to winter mode by Yuhang.
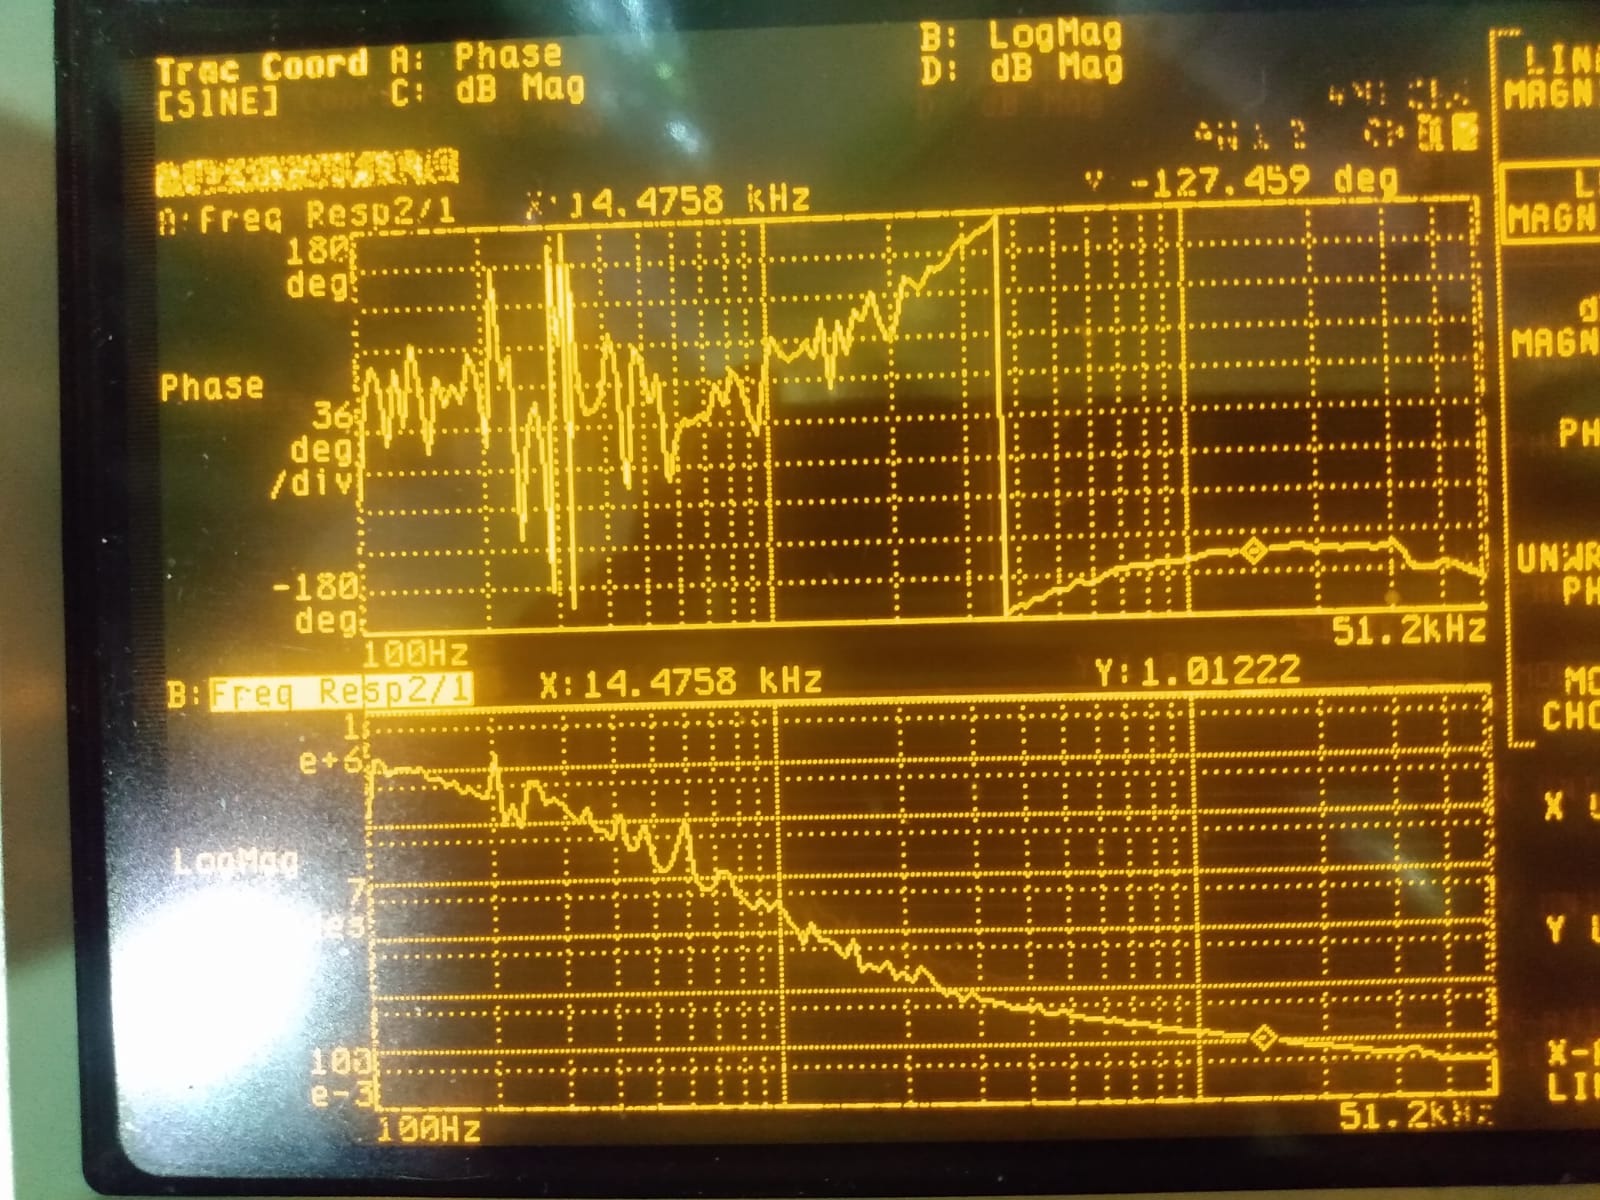
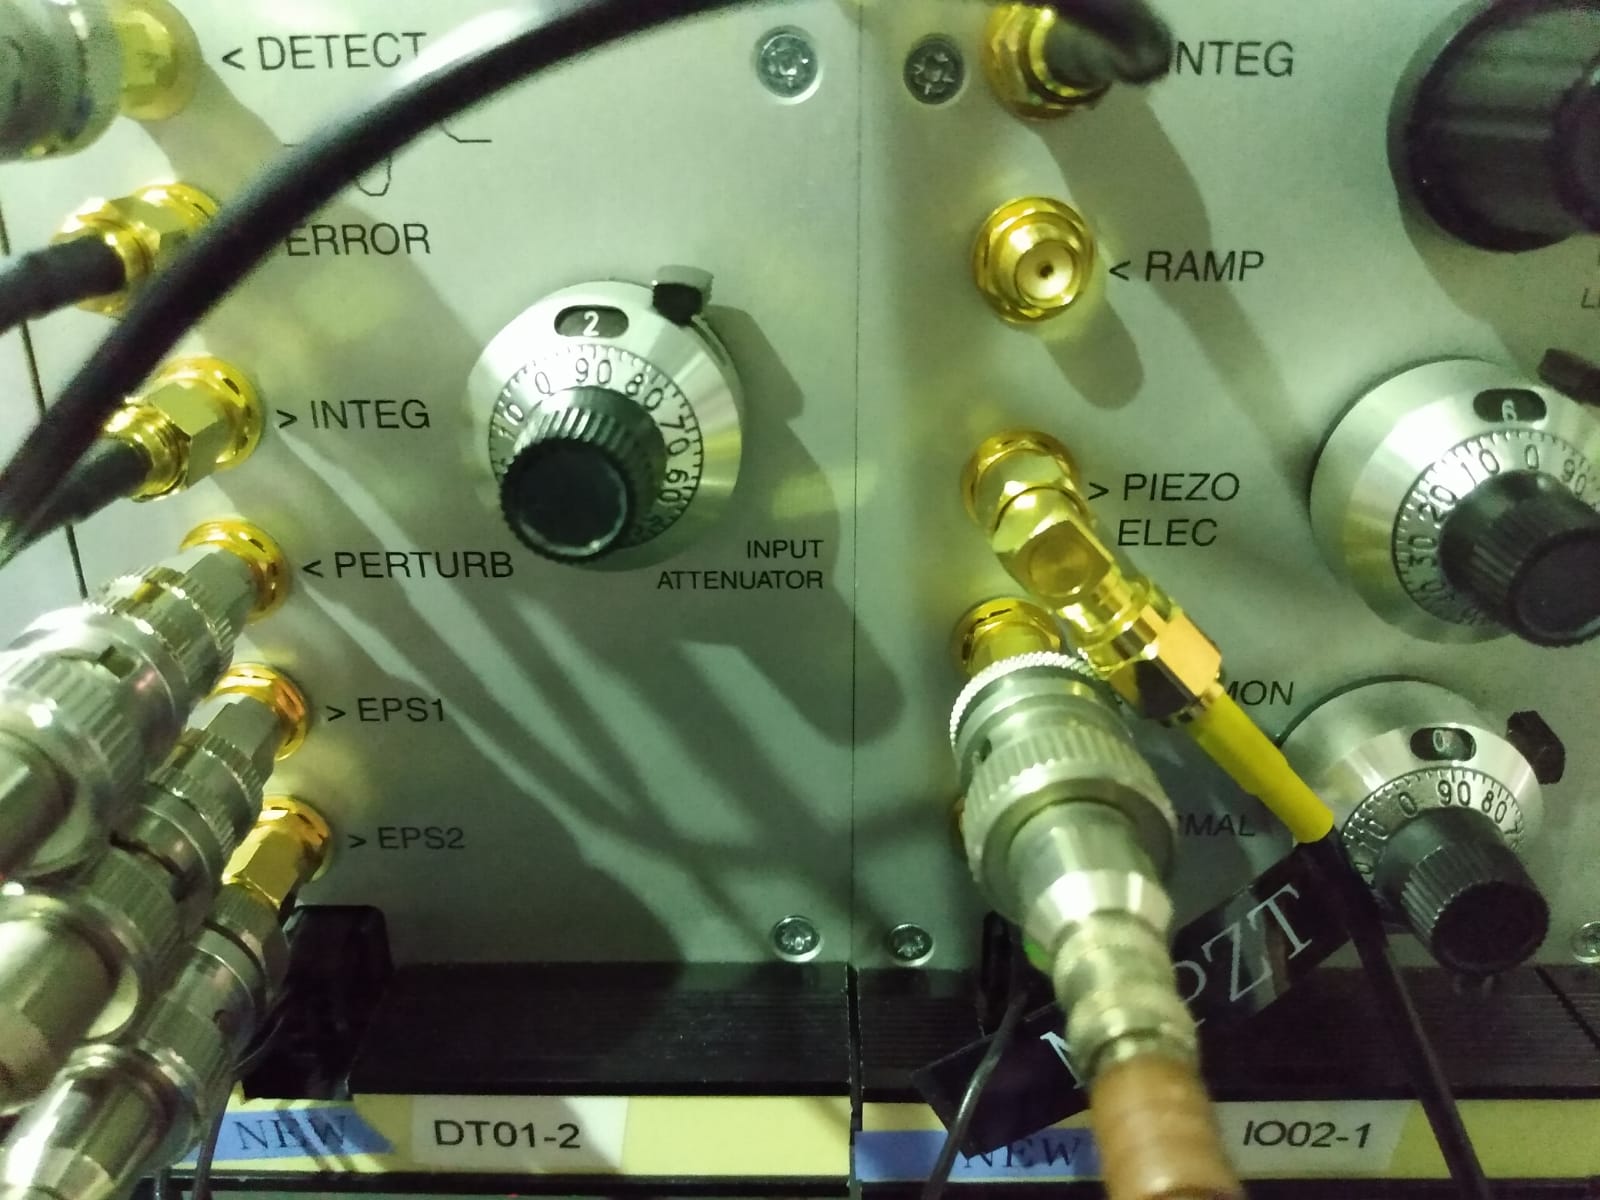
The injected power was put back to 12mW and the gains were tuned to get UGF ~ 15 kHz. (See pic 1 and 2). Anyway it seems a loop oscillation happened from time to time and error signal looks noisier than usual. It was quite late and we coudn't keep investingating any longer. We haven't been in TAMA yesterday and today because of F2F. Will check the situation tomorrow.
The main effect causing degradation of the overlap between LO and reflected beam form FC when it is ON and OFF resonance is the relative phase change between TEM 00 (resonating the cavity) and HOM (not resoanting). Raffaele did a quick calculation to show this and the numbers he found are in rough agreement with those we observed. I attached a pdf with a similar calulation and a plot that shows the overlap degradation as a function of the not coupled power into FC.

[Eleonora, Matteo, Raffaele]
On 29/11 dIthering was implemented also in Yaw, with the same scheme used for pitch.
Dithering lines are injected on INPUT and END mirrors at a frequency of 16.5 Hz and 17.5 Hz respectively. Each error signal obtained from transmitted power demodulation is filtered with a simple integrator and fed back to its own mirror.
From the time taken by the loop to recover the alignemnt after misalignig a mirror on purpose, the UGF seems smaller 50 mHz. I tried to measure openloop TF with a swep sine injection at very low frequency but coherence was not good, no matter the excitation amplitude.
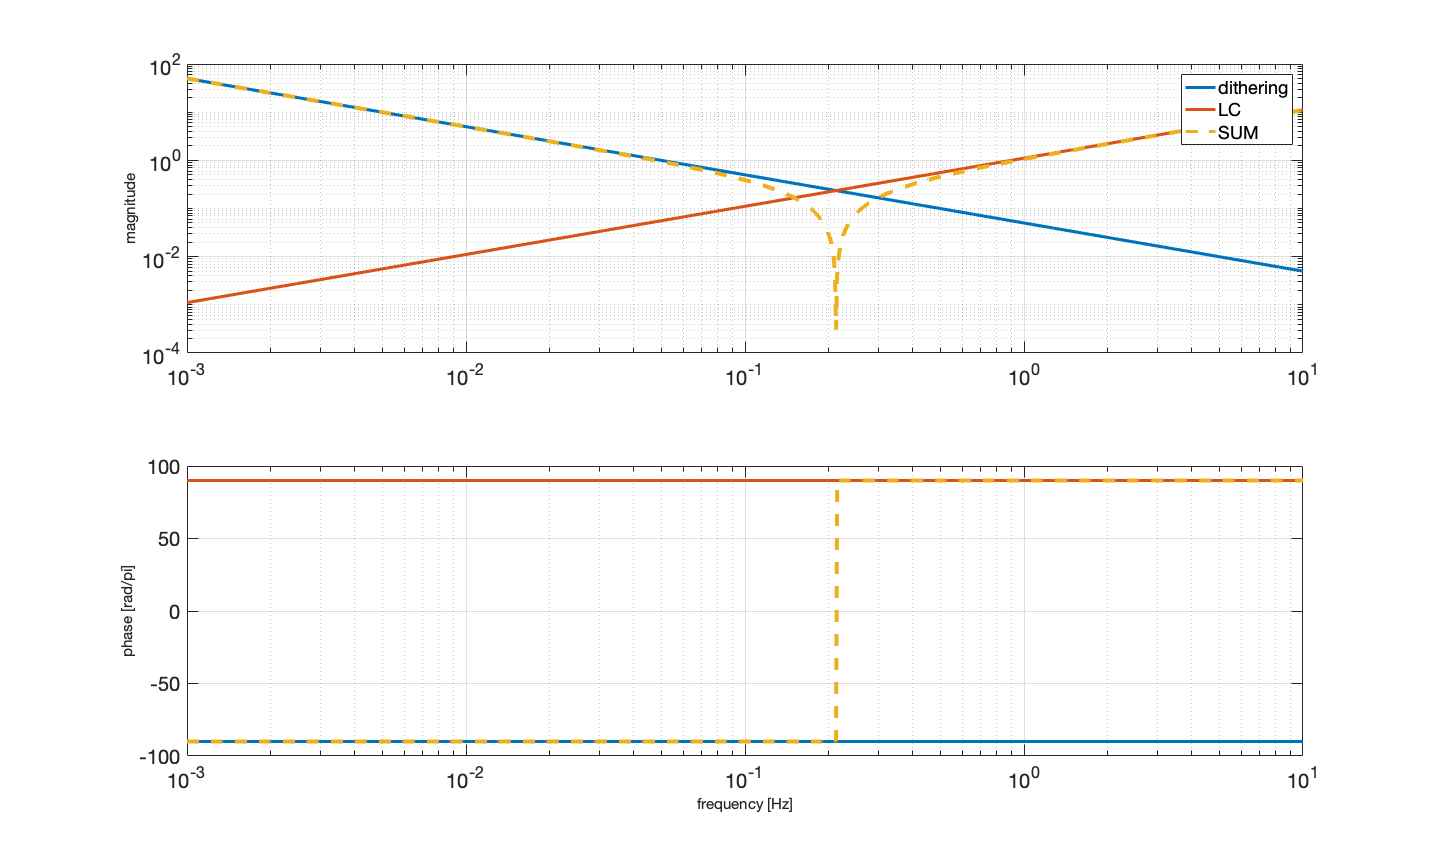
Note that with the current filter configuration (simple integrator) the UGF of dithering is limited by the interaction with the damping loops. See attached simulation. We discussed the possibiliy to shape the filter to avod the instabilty. Anyway since damping UGF is quite high ~1 Hz. in the present configuration the sum of the two loops is stable. Another possibility would be to go back to DC controlled optical lever and add the dithering DC correction to the set point of this loop. I think this is what is done in Virgo.
I put fused silica mirrors inside the cryostat chamber in order to construct a FP cavity with cavity length od 9.9cm.
Then I injected a laser into the cavity and tried to see the flash with PD which is located at transmission port.
So far I could not see any transmitted beam.
I will improve the alignment and mode matching with two lenses.
Yaochin and Yuhang
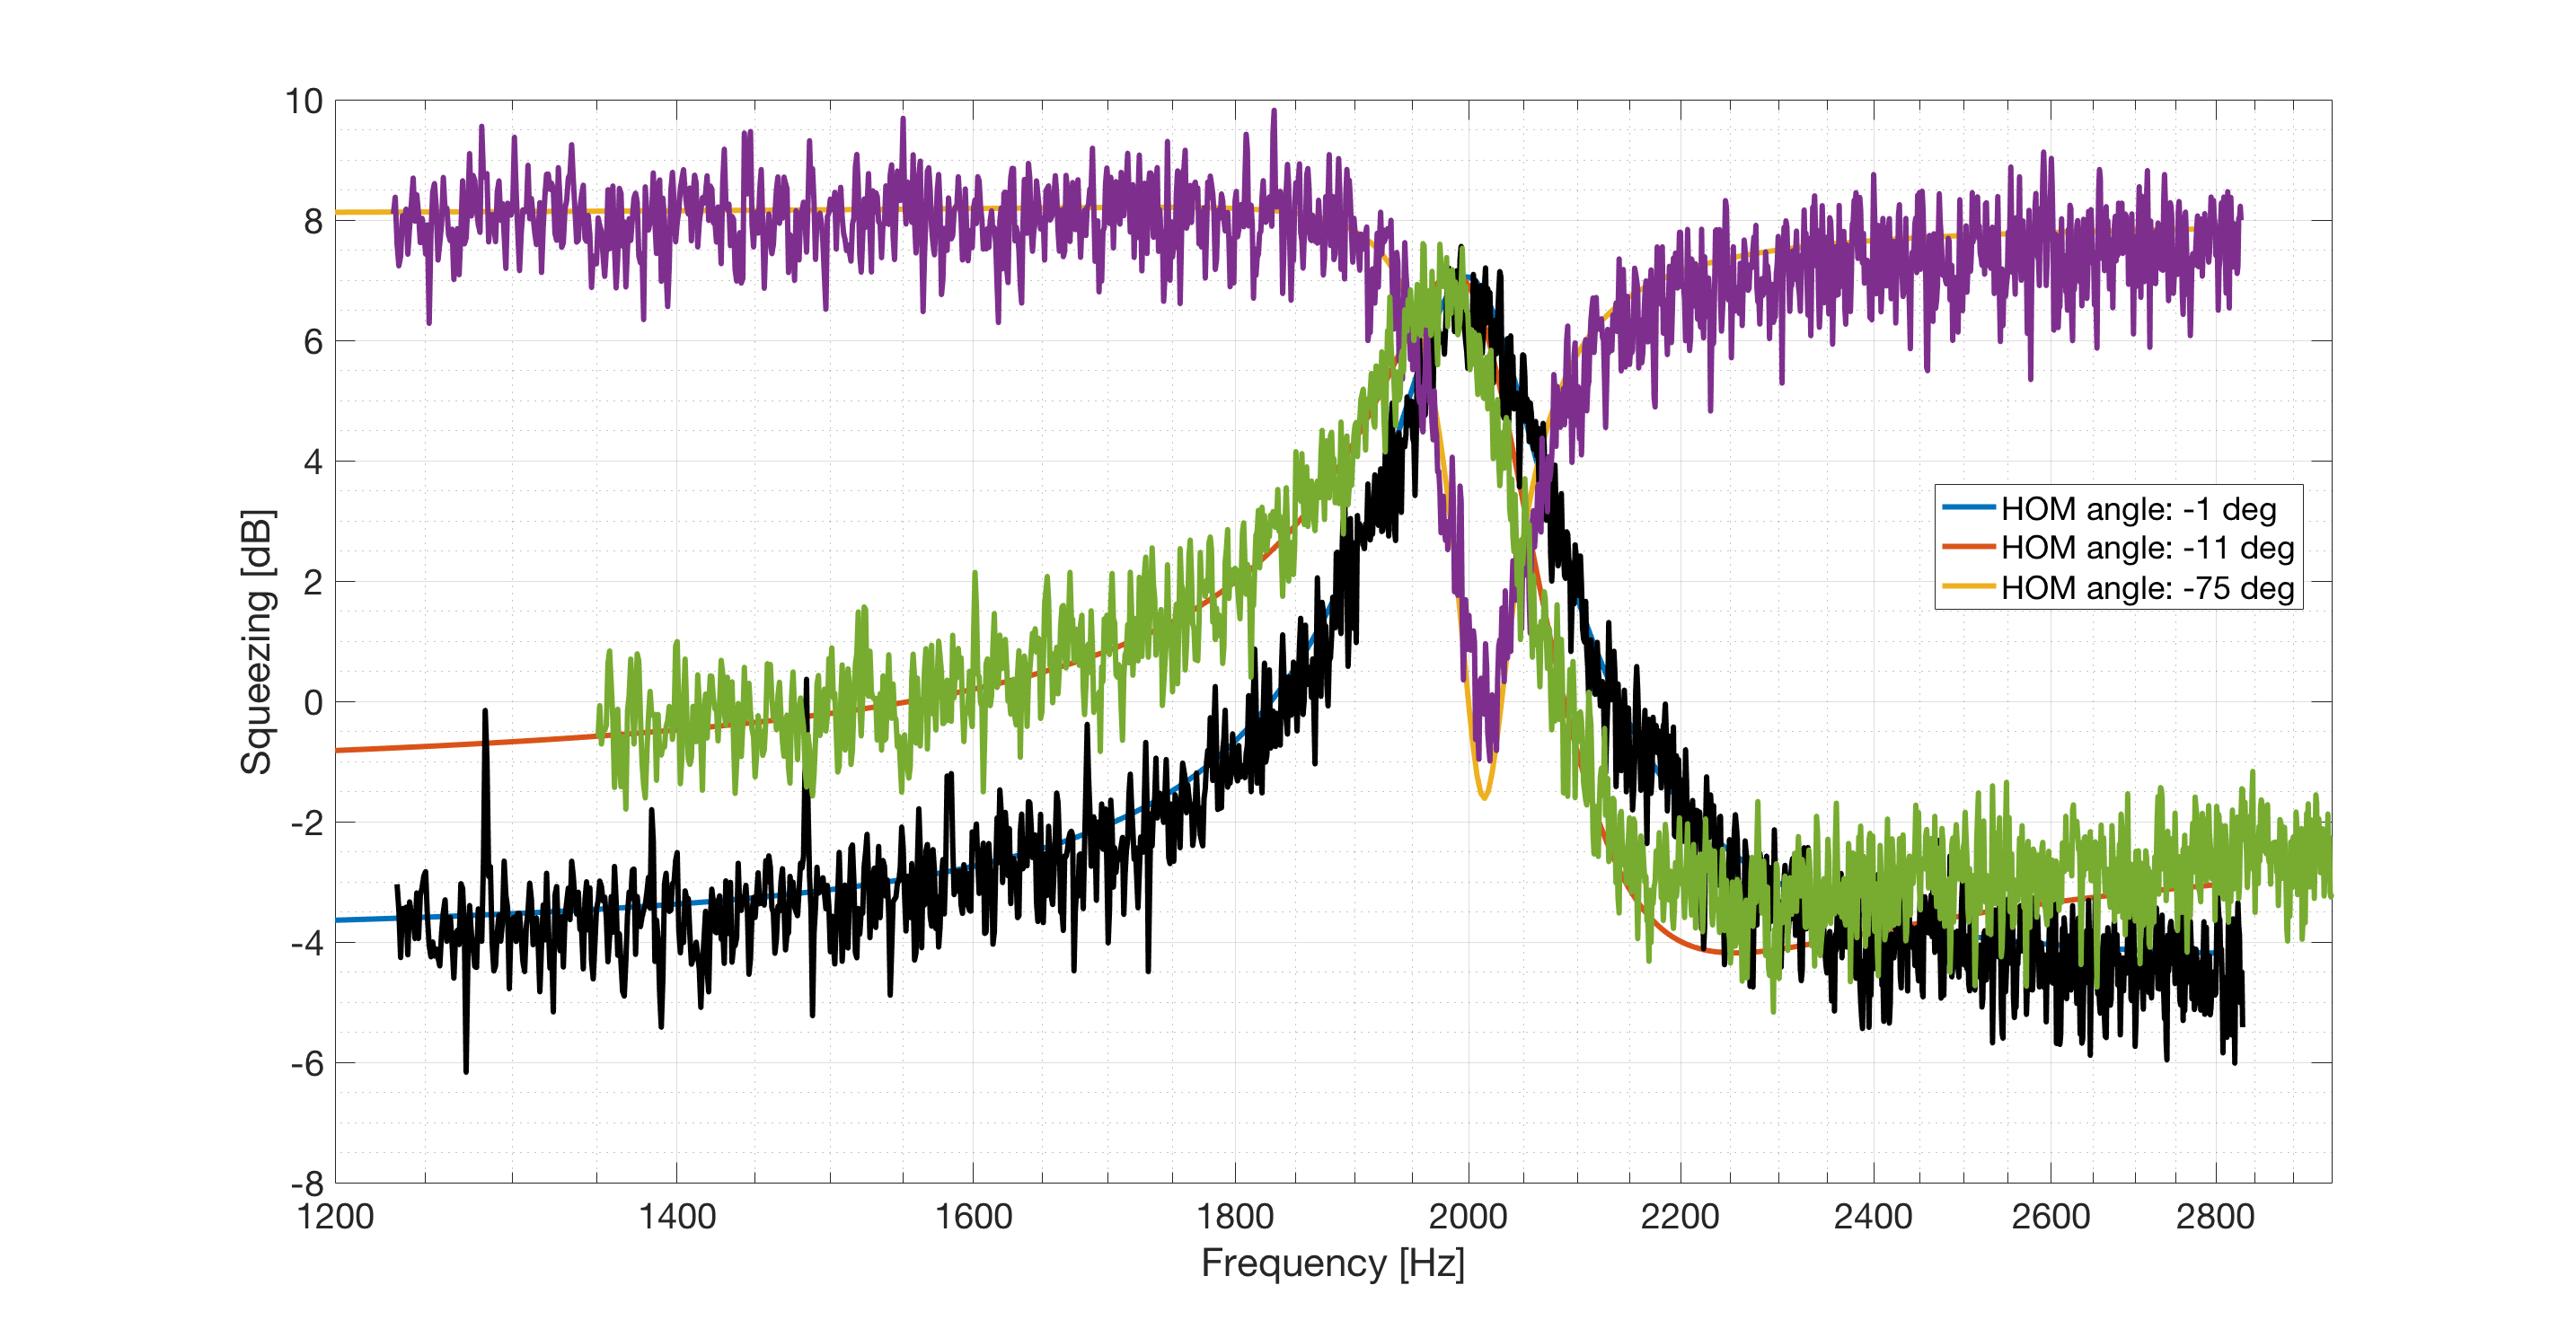
We see anti-squeezing rotates to squeezing @2kHz. But the filter cavity was really unstable.
average: 50 times
Setting of hand-fit parameters:
sqz_dB = 9.5; % produced SQZ
L_rt = 105e-6; % FC losses
L_inj = 0.17; % Injection losses
L_ro = 0.1; % Readout losses
A0 = 0.05; % Squeezed field/filter cavity mode mismatch losses
C0 = 0.03; % Squeezed field/local oscillator mode mismatch losses
ERR_L = 5e-12; % Lock accuracy [m]
ERR_csi = 50e-3; % Phase noise[rad]
phi_Hom = [-1/180*pi, -11/180*pi, -75/180*pi]; % Homodyne angle [rad] (you can input a vector of values)
det = 2e3; % detuning frequency
int = 0.8e3; % frequency range = det+/-int
Setting of shot noise level/detuning error parameters:
semilogx(fd+34, d_a1+133.5,'k','LineWidth',3) %squeezing to anti-squeezing
hold on
semilogx(fd+32, d_a2+133.5,'LineWidth',3) %anti-squeezing to squeezing
hold on
semilogx(fd+150, d_a3+133.5,'LineWidth',3) %intermediate
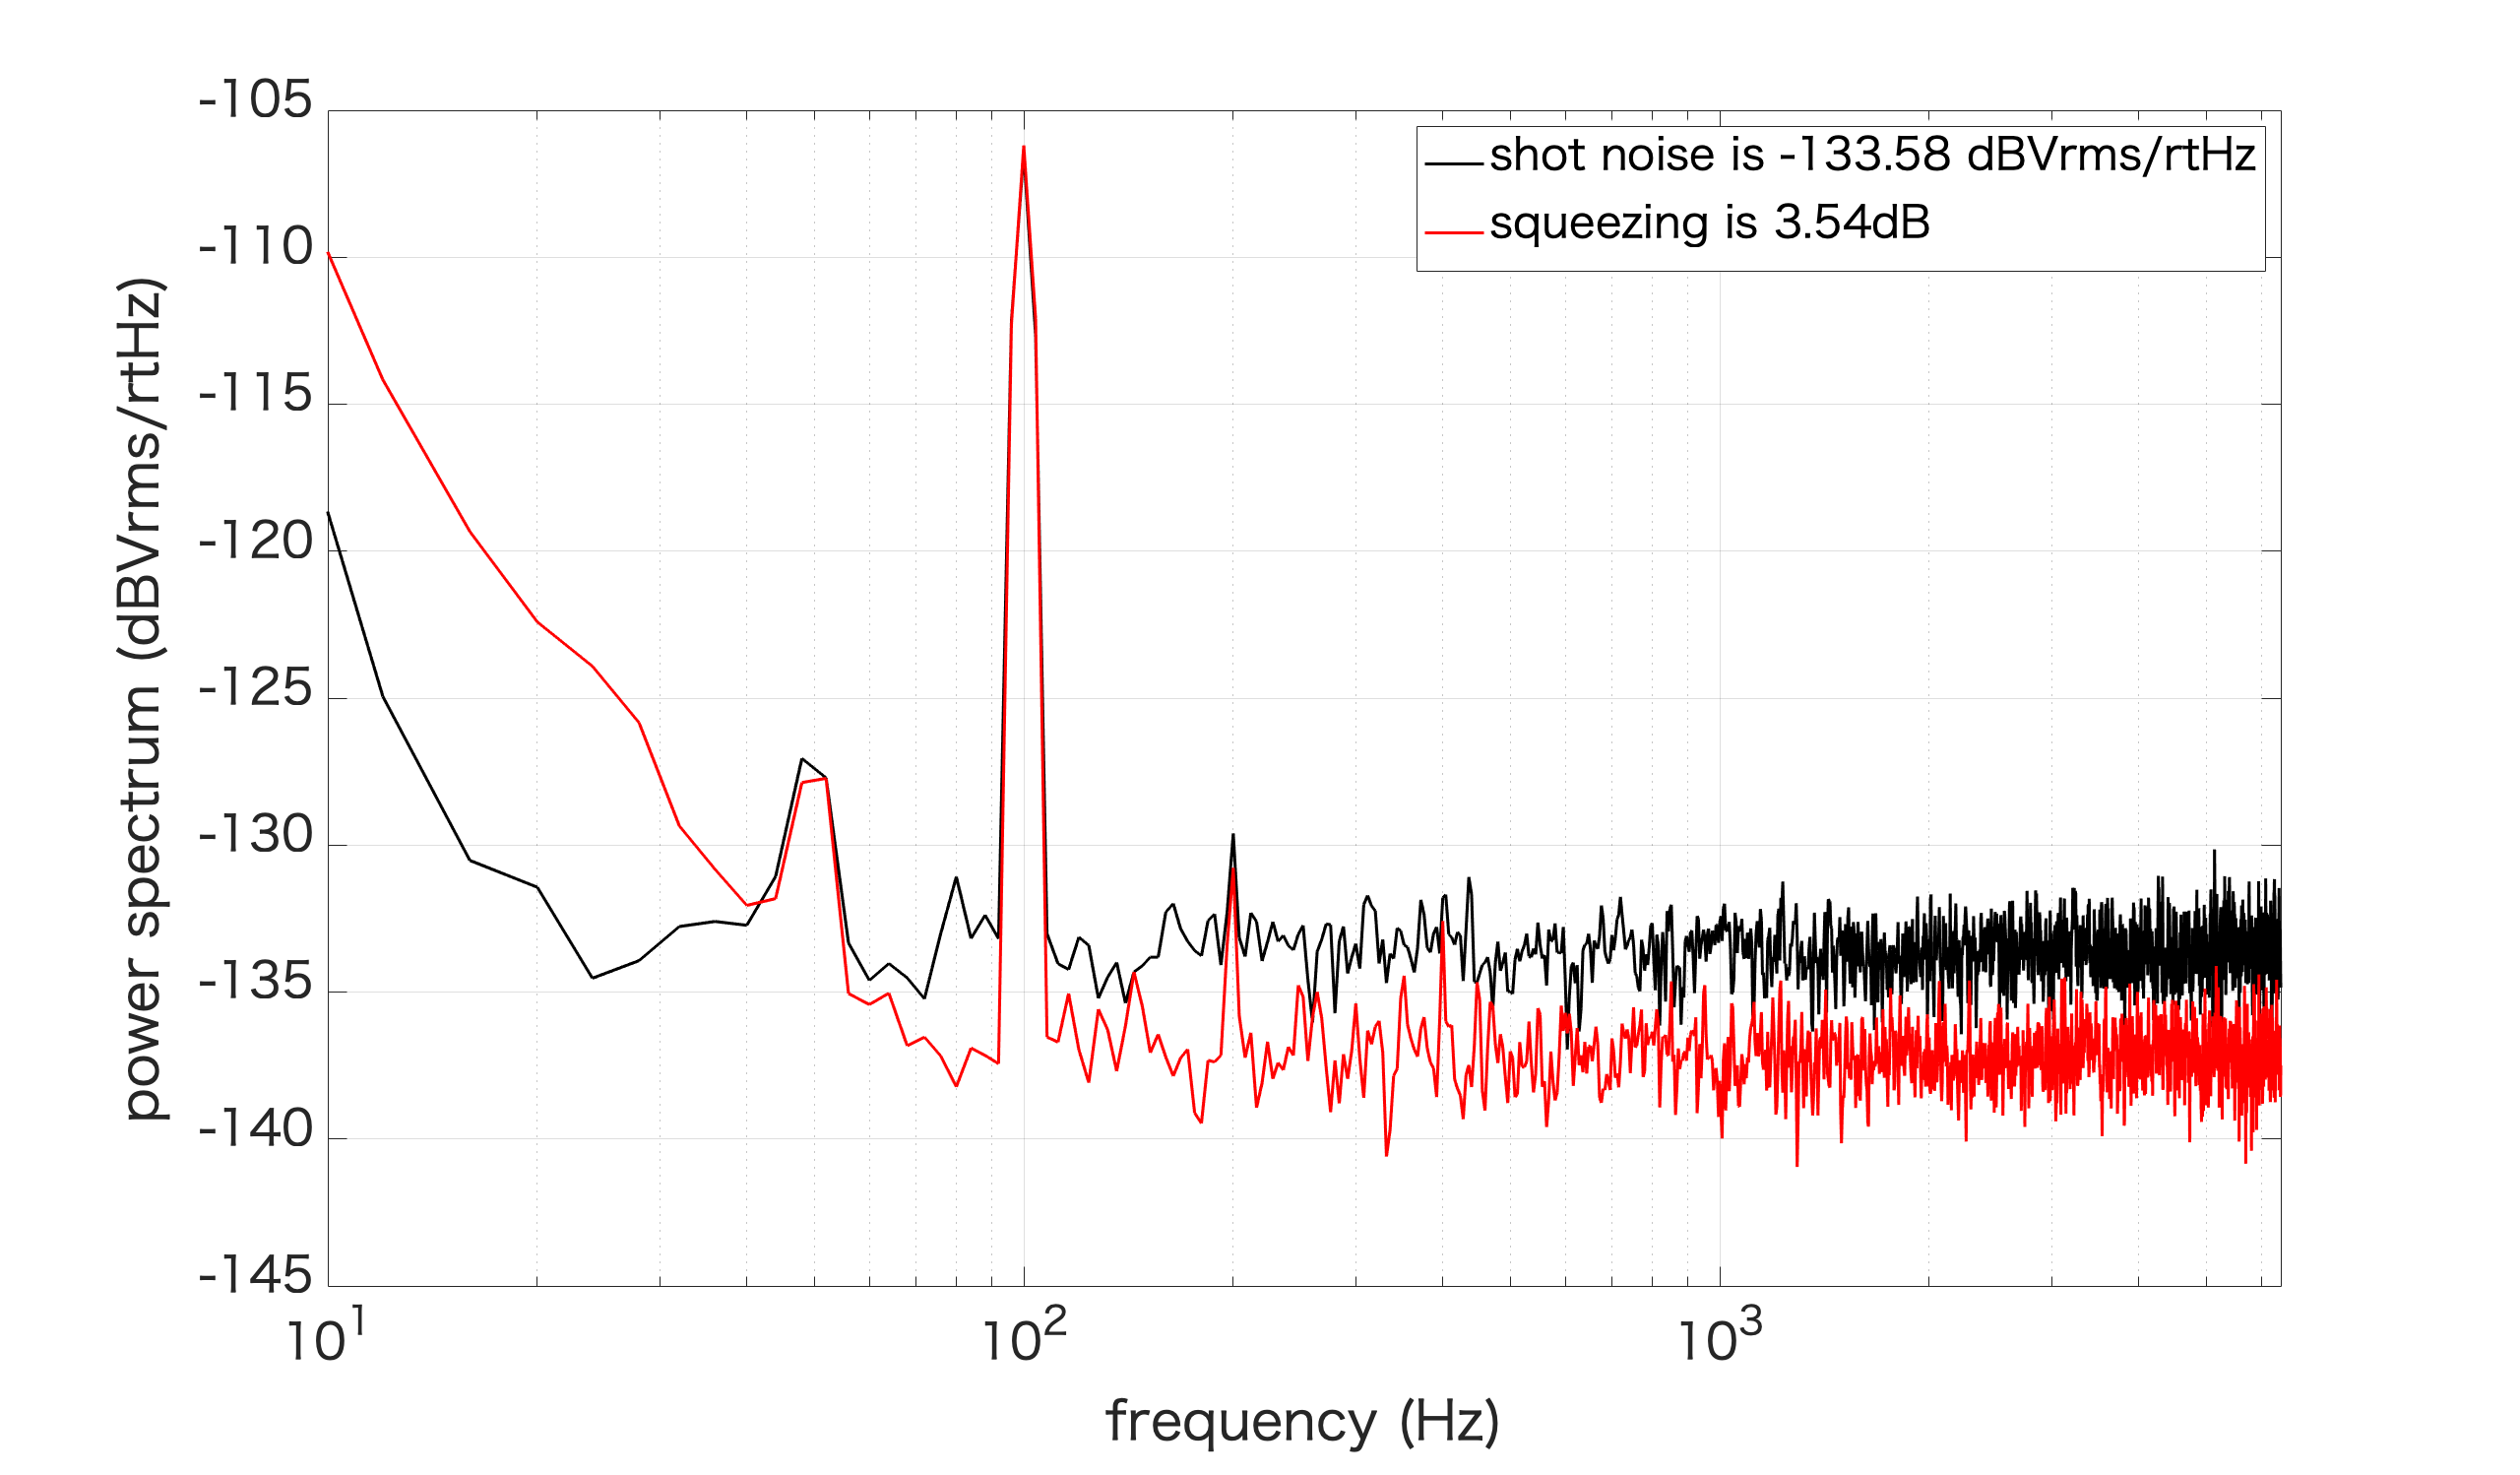
[Aritomi, Yuhang, Yaochin, Eleonora]
First we measured frequency independent squeezing with filter cavity (Pic. 1). We had 3.5dB squeezing down to 80Hz with filter cavity.
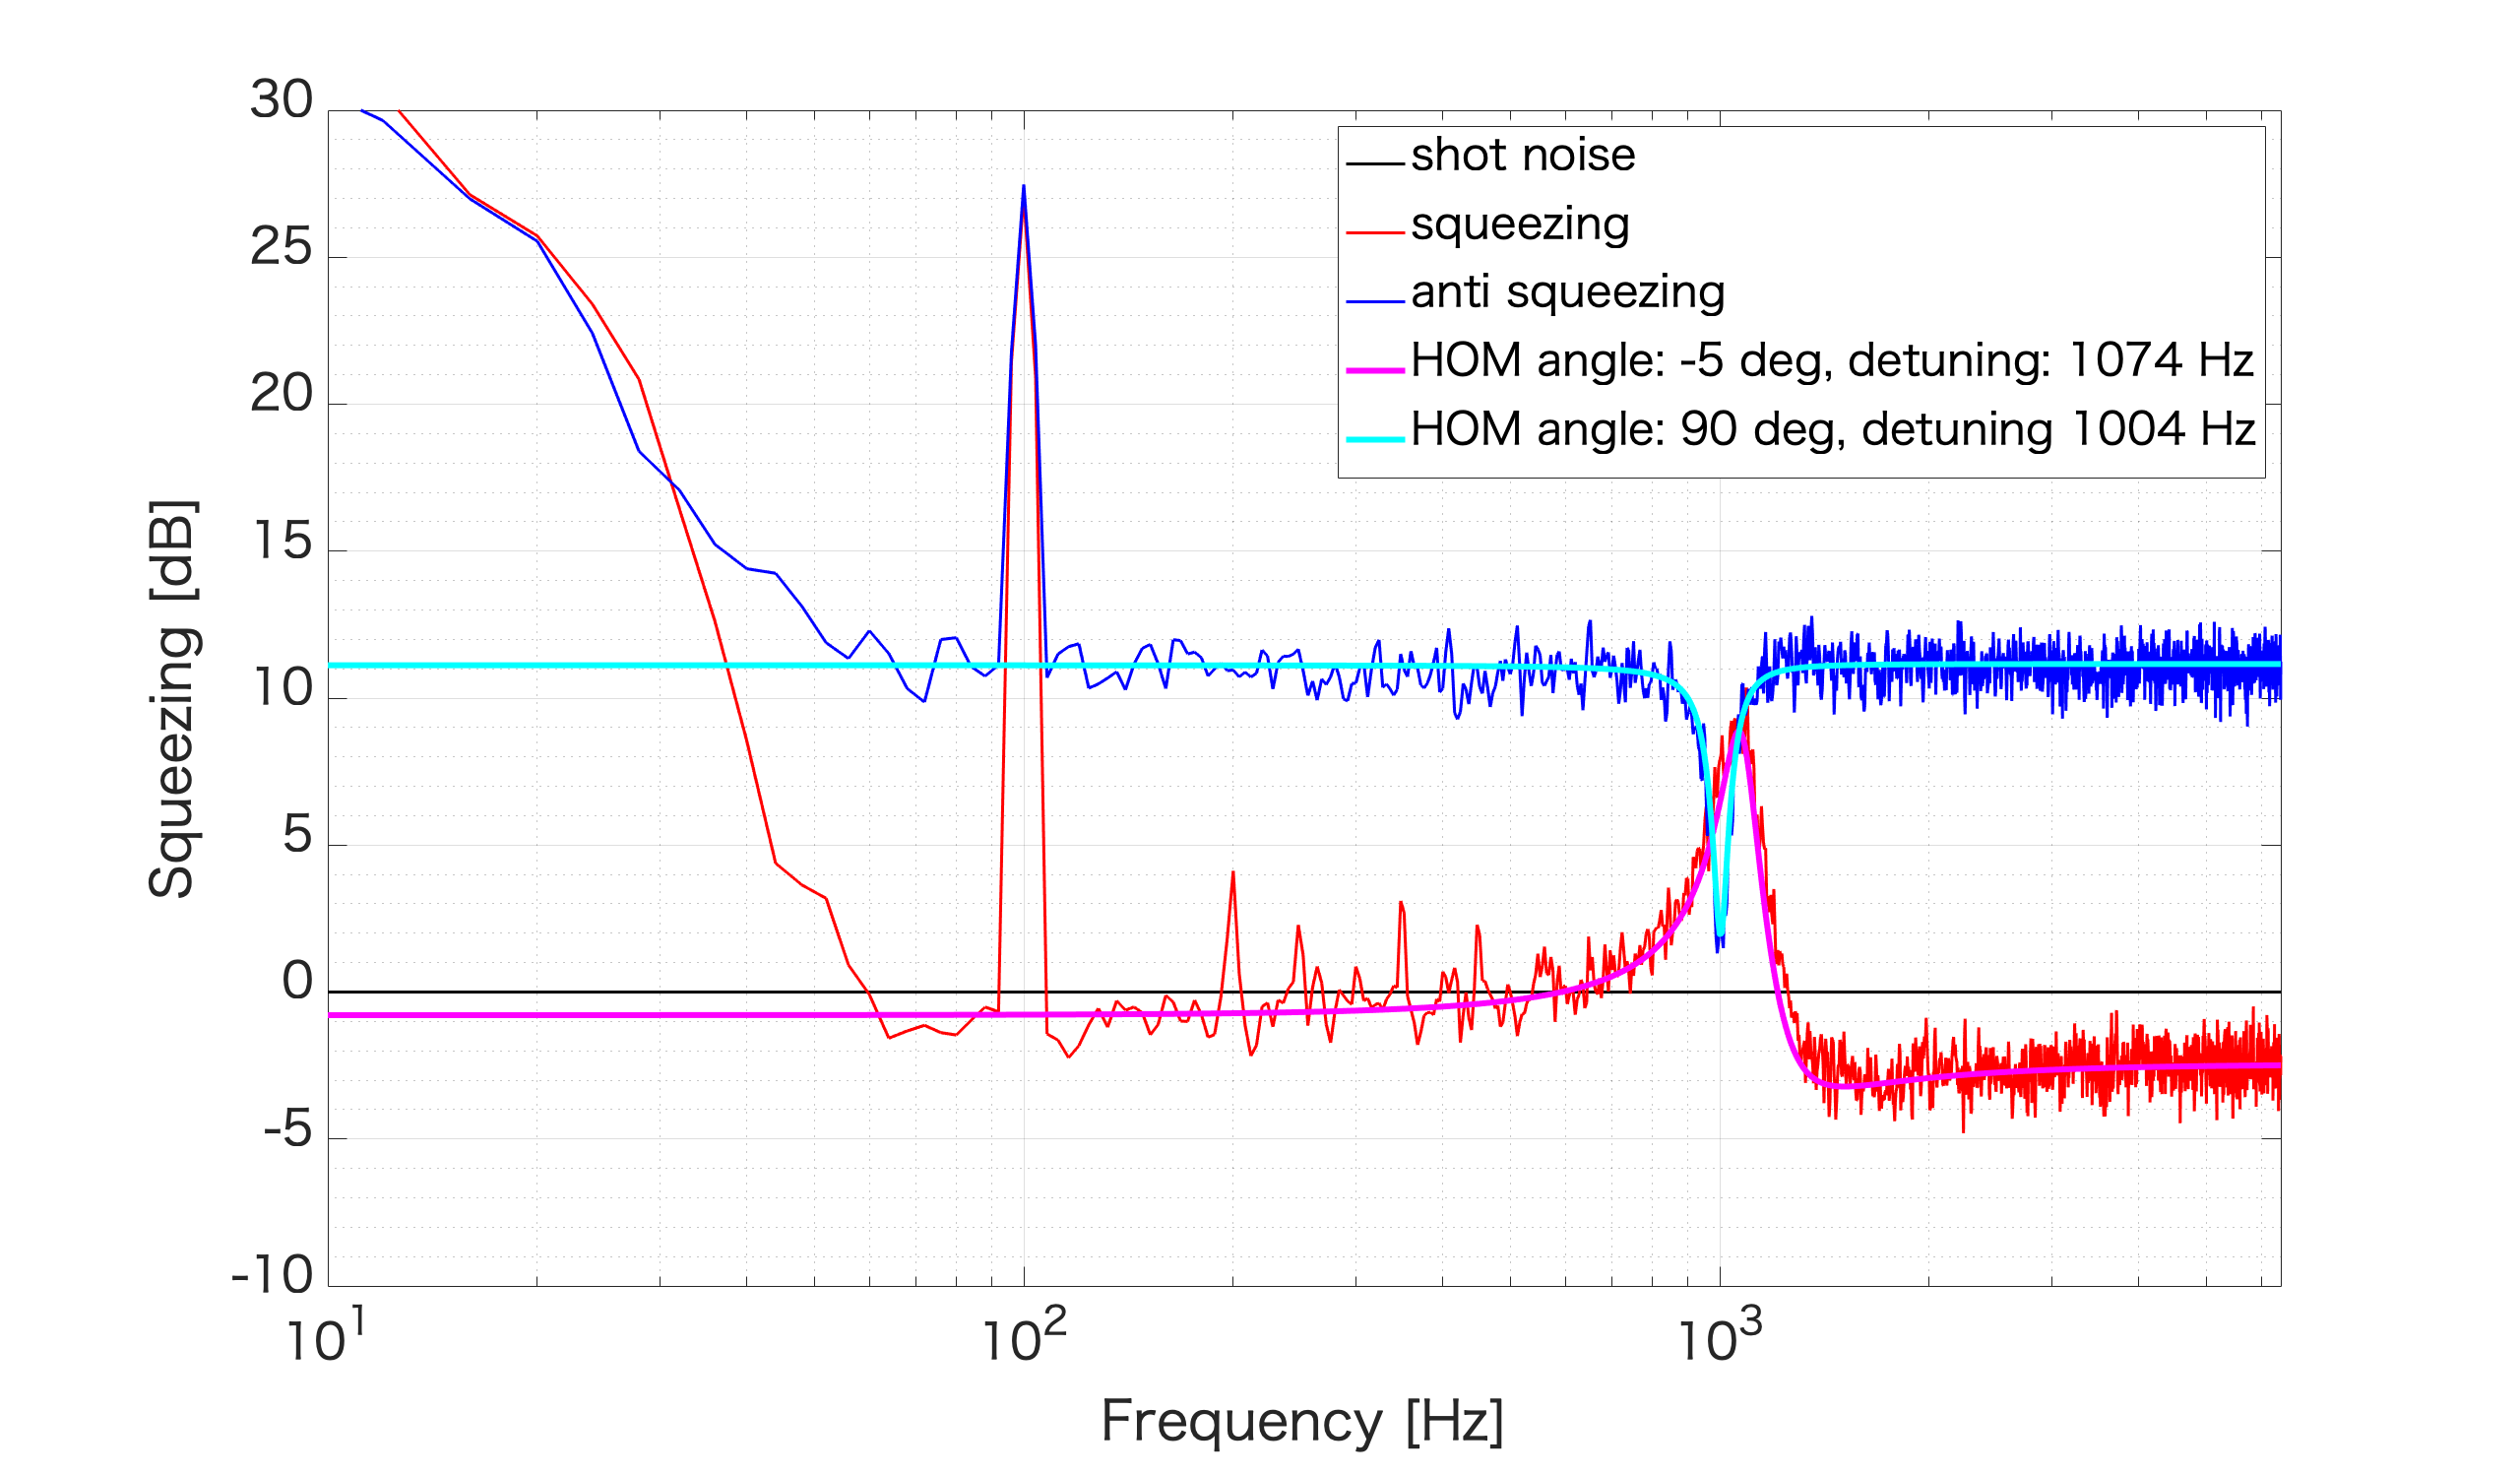
Then we alined BAB to AMC with 1kHz filter cavity detuning and measured FDS (Pic. 2). Fitting parameters are follows. It seems that detuning changed for squeezing and anti squeezing measurement.
sqz_dB = 13; % produced SQZ
L_rt = 100e-6; % FC losses
L_inj = 0.20; % Injection losses
L_ro = 0.11; % Readout losses
A0 = 0.1; % Squeezed field/filter cavity mode mismatch losses
C0 = 0.1; % Squeezed field/local oscillator mode mismatch losses
ERR_L = 5e-12; % Lock accuracy [m]
ERR_csi = 80e-3; % Phase noise[rad]
phi_Hom = [-5/180*pi, pi/2]; % Homodyne angle [rad]
det = [1074 1004]; % detuning frequency [Hz]
cavity_pole = 59.6; % cavity pole (Hz)
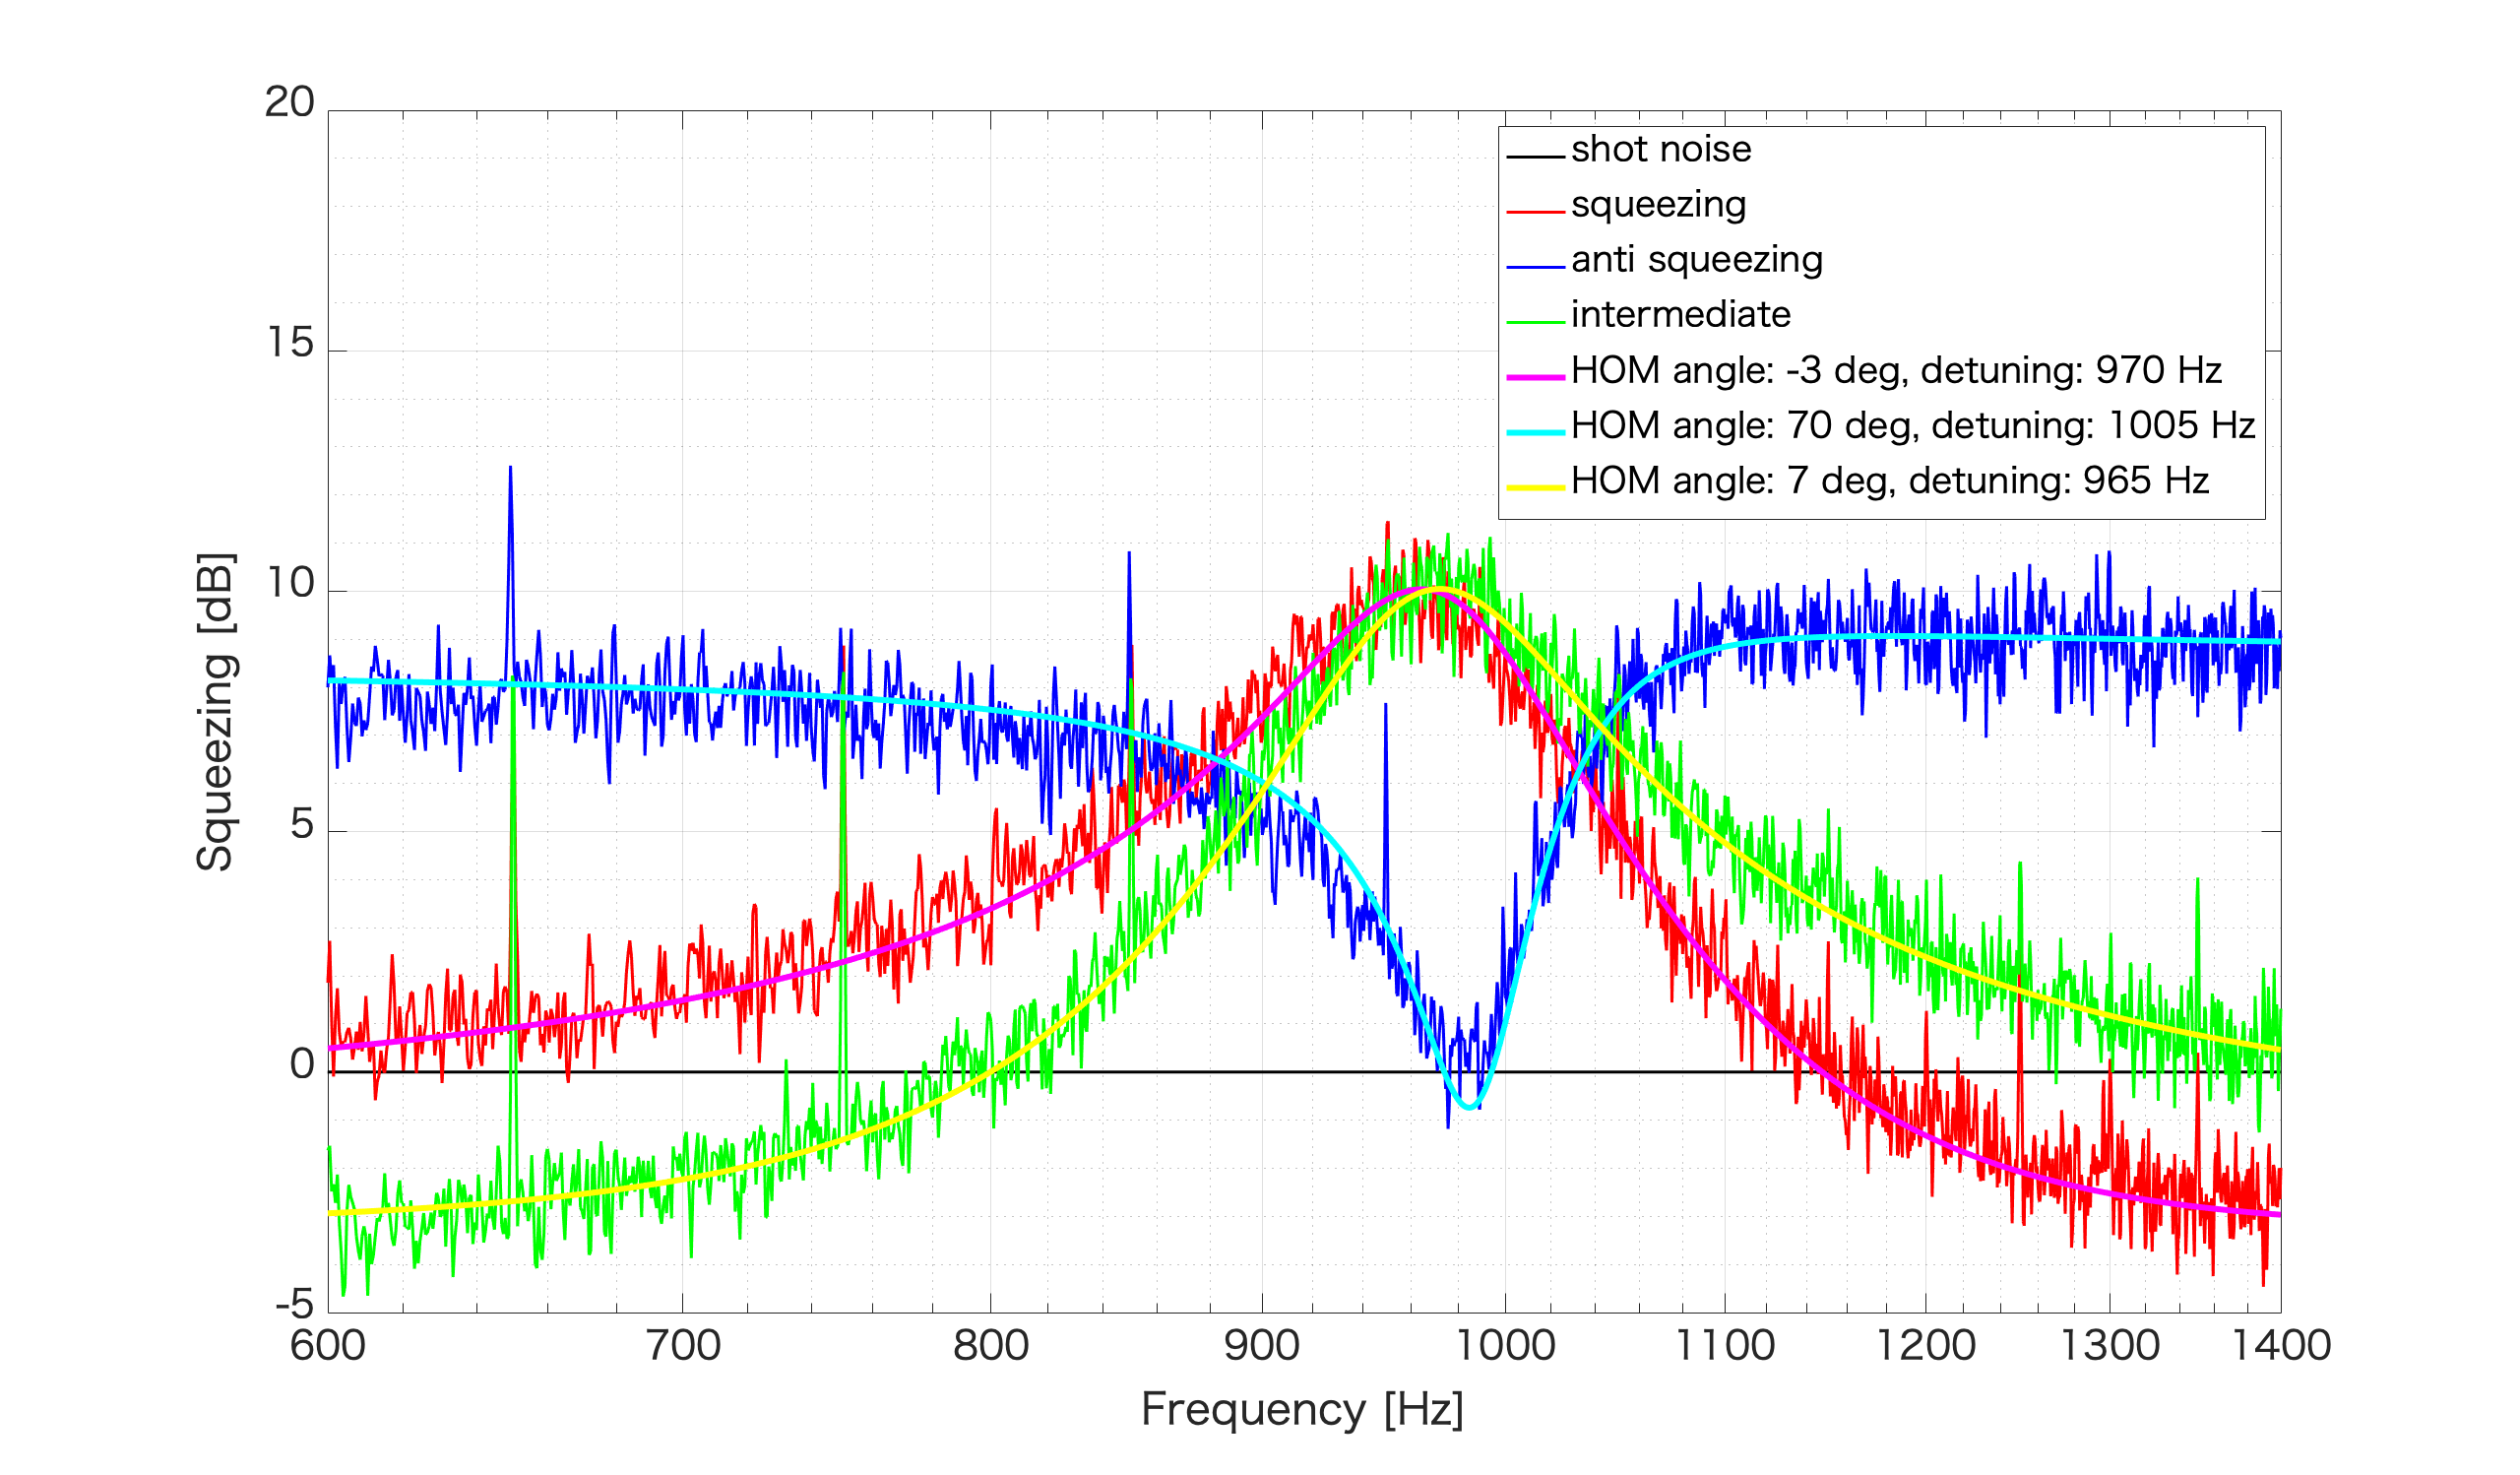
We measured FDS again with smaller frequency span (Pic. 3). Fitting parameters are follows. This time, it seems that produced SQZ also changed in addition to detuning.
sqz_dB = [13.5 11 13.5]; % produced SQZ
L_rt = 100e-6; % FC losses
L_inj = 0.20; % Injection losses
L_ro = 0.11; % Readout losses
A0 = 0.05; % Squeezed field/filter cavity mode mismatch losses
C0 = 0.1; % Squeezed field/local oscillator mode mismatch losses
ERR_L = 5e-12; % Lock accuracy [m]
ERR_csi = 80e-3; % Phase noise[rad]
phi_Hom = [-3/180*pi 70/180*pi 7/180*pi]; % Homodyne angle [rad]
det = [970 1005 965]; % detuning frequency [Hz]
cavity_pole = 59.6; % cavity pole (Hz)
Aritomi, Eleonora, Yaochin, and Yuhang
For the adjustment of OPO/FC matching and FC/LO matching, we always do the following.
1. Send BAB into the filter cavity. Align IR into the filter cavity while filter cavity alignment is kept in the best condition. Check IR 0/1/2 order modes by changing AOM frequency.
2. Align BAB reflection into AMC while the filter cavity is locked.
However, we found that the matching from BAB_ref into AMC is quite different when the filter cavity is locked and detuned. And we know that we measure FDS while FC is detuned, so we decide to align BAB_ref into AMC while FC is detuned. So now the procedure is as follows.
1. Send BAB into the filter cavity. Align IR into the filter cavity while filter cavity alignment is kept in the best condition. Check IR 0/1/2 order modes by changing AOM frequency.
2. Align BAB reflection into AMC while the filter cavity is detuned.
However, we are not very sure why the matching can be so different when FC is locked and detuned. Because I think the BAB_ref should be quite similar in both cases of lock and detuned since we had 94% of matching from OPO/FC. I put the reason for my thought as following. Please correct me if there is something wrong.
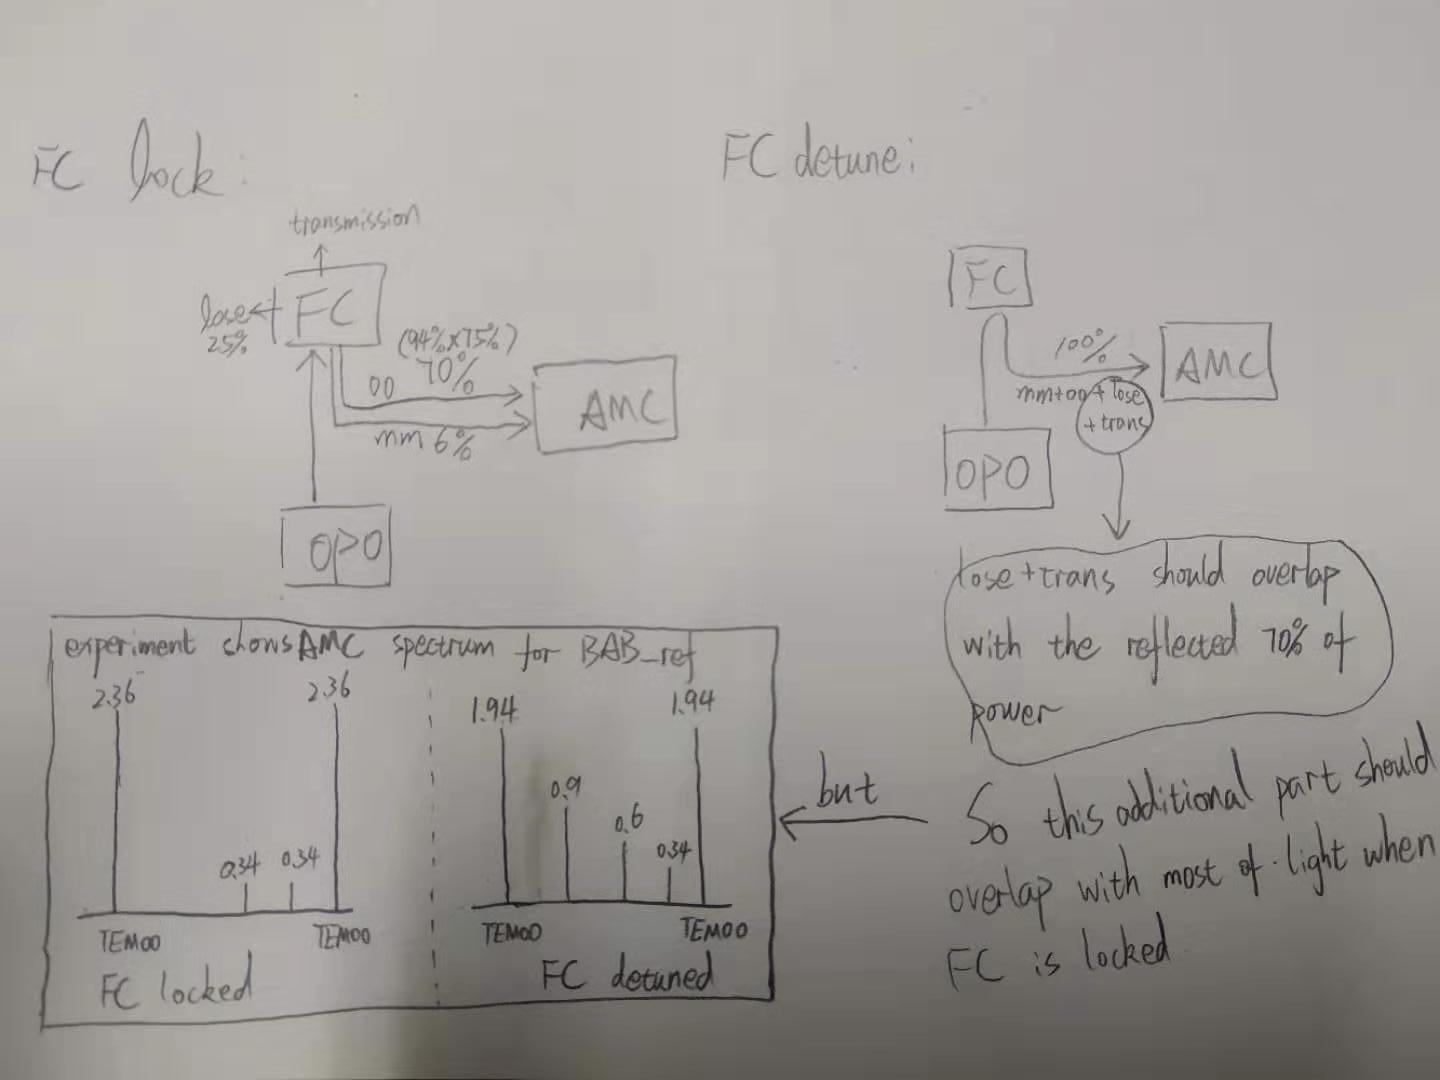
The main effect causing degradation of the overlap between LO and reflected beam form FC when it is ON and OFF resonance is the relative phase change between TEM 00 (resonating the cavity) and HOM (not resoanting). Raffaele did a quick calculation to show this and the numbers he found are in rough agreement with those we observed. I attached a pdf with a similar calulation and a plot that shows the overlap degradation as a function of the not coupled power into FC.
Yao-Chin and Yuhang
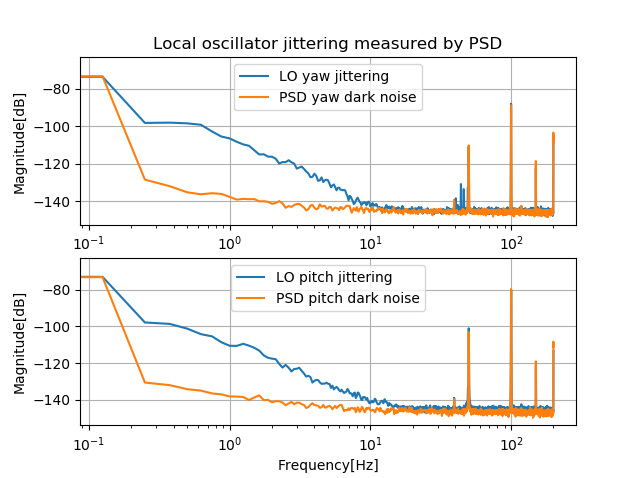
When IRMC locking, we monitored yaw & pitch of LO light jittering by position sensitive detector(PSD) as shown in fig 1. PSD was put before alignment mode cavity(AMC). We also measured yaw & pitch of PSD dark noise.
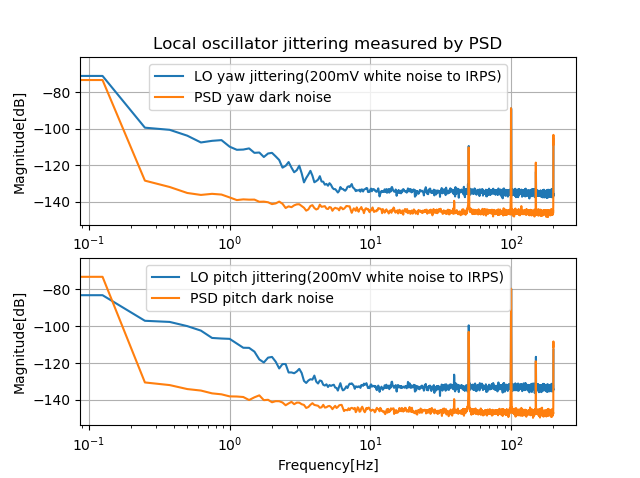
In addition, we sent 200mV Vpp of random noise to IR phase shifter(IRPS) and measured again yaw & pitch of LO light jittering as shown in fig 2. Magnitude value increased more obviously above 60Hz than without random noise situation.
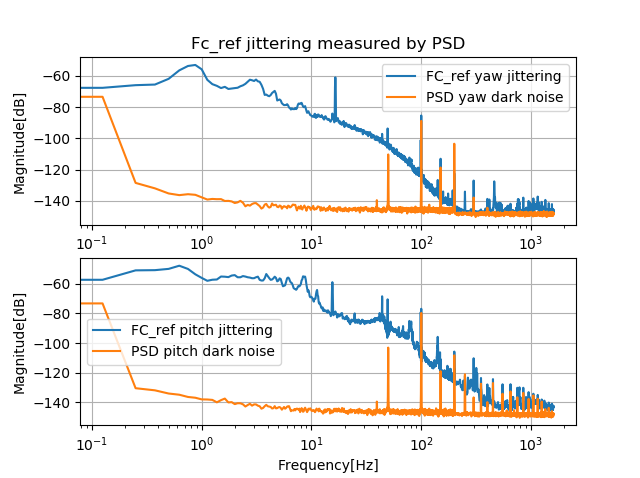
When BAB light sent to filter cavity, we monitored yaw & pitch of reflect light by PSD as shown in fig 3. Because suspension mirror jittering, The jittering magnitude of low frequency range (<200Hz for yaw, <500Hz for pitch) is huge.
Simon, Pengbo
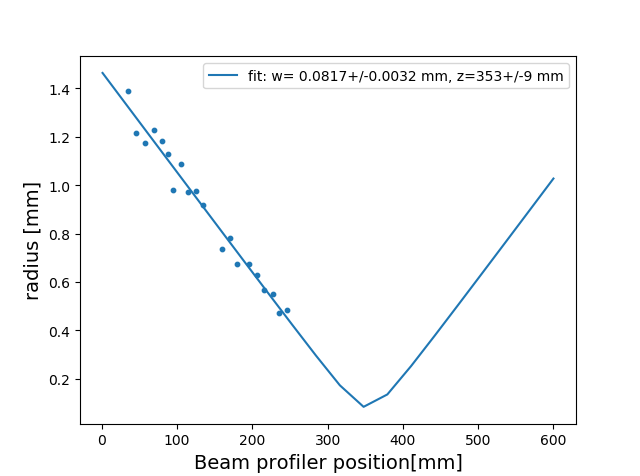
We finished the measurement of the beam profile using the beam profiler.
The beam profile could not be measured at the waist due to the space limits, and the results may be not that accurate.
But as can be seen from the attachment, the diameter of the waist is 81 mum roughly, which didn't offset very much compared with the result before.
I designed a glueing jig for fused silica mirrors.
There is a through hole for putting a mirror and its holder.
A space aroung the center is in order to prevent sticking the jig to the mirror due to the leaking glue.
I will ask Sato-san to check the design.
sqz_dB = 12.5; % produced SQZ
L_rt = 100e-6; % FC losses
L_inj = 0.20; % Injection losses
L_ro = 0.11; % Readout losses
A0 = 0.1; % Squeezed field/filter cavity mode mismatch losses
C0 = 0.1; % Squeezed field/local oscillator mode mismatch losses
ERR_L = 5e-12; % Lock accuracy [m]
ERR_csi = 80e-3; % Phase noise[rad]
phi_Hom = [0, pi/2*105/90]; % Homodyne angle [rad] (you can input a vector of values)
det = 360; % detuning frequency
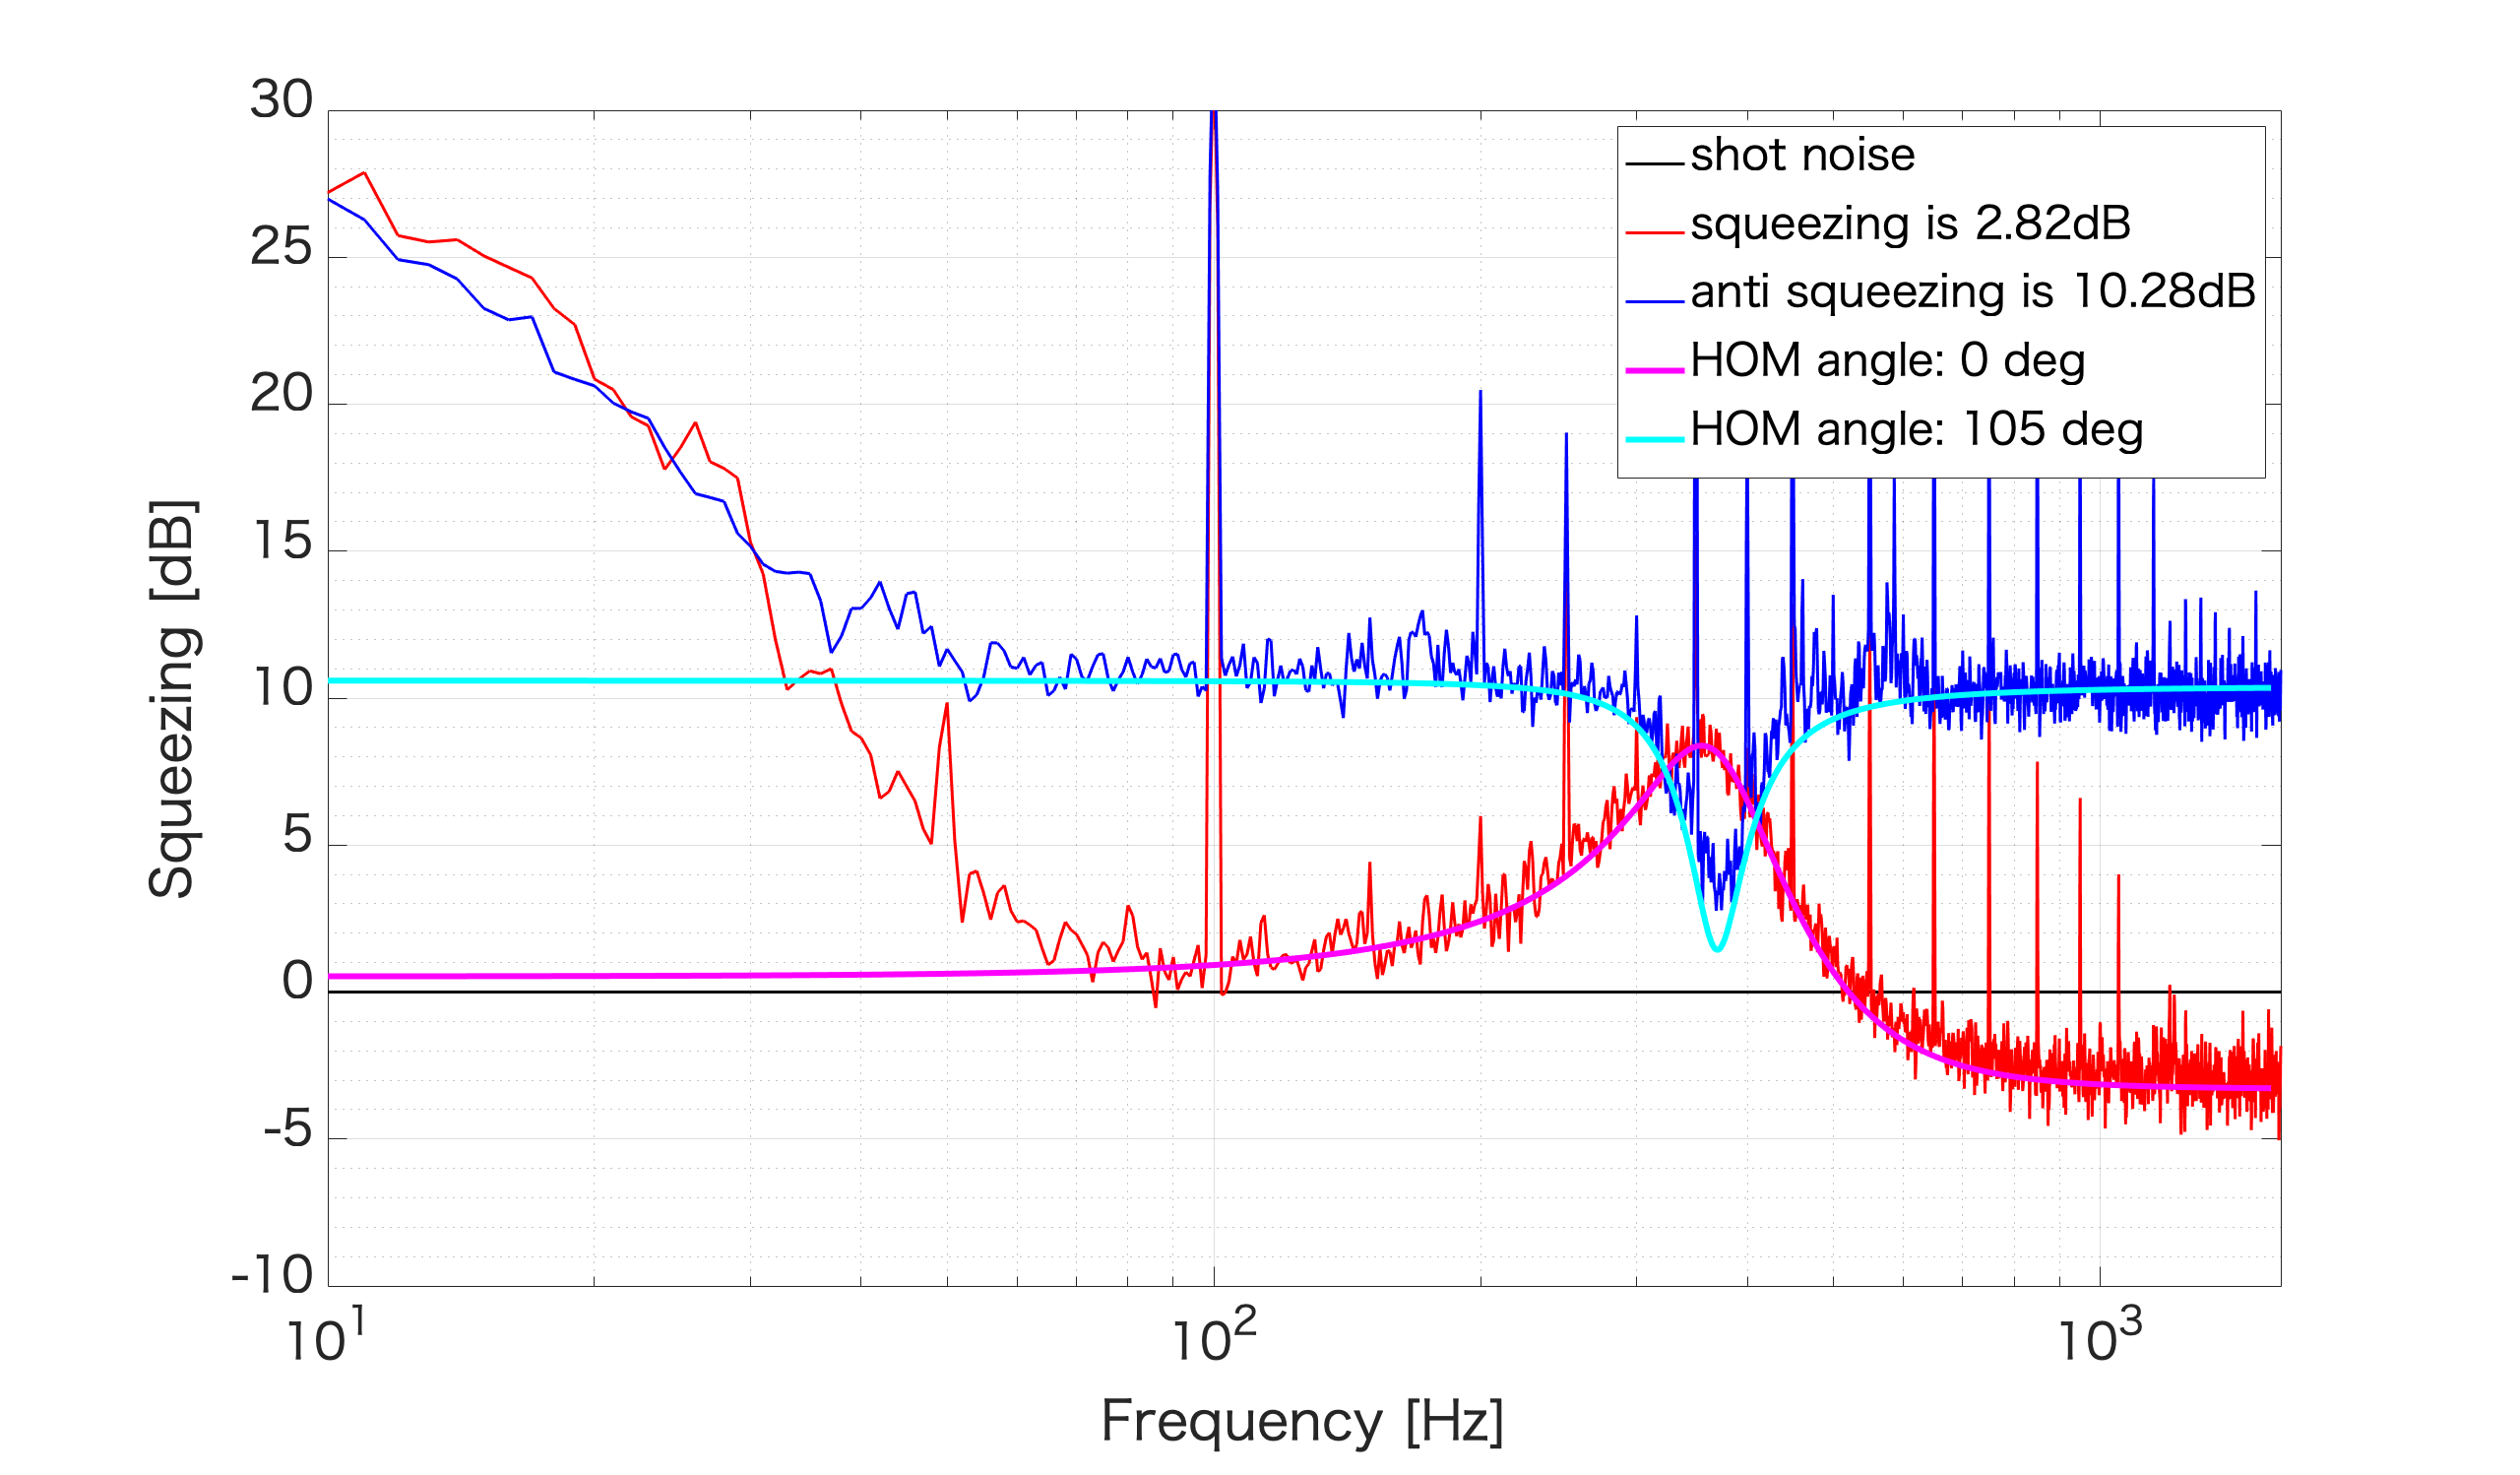
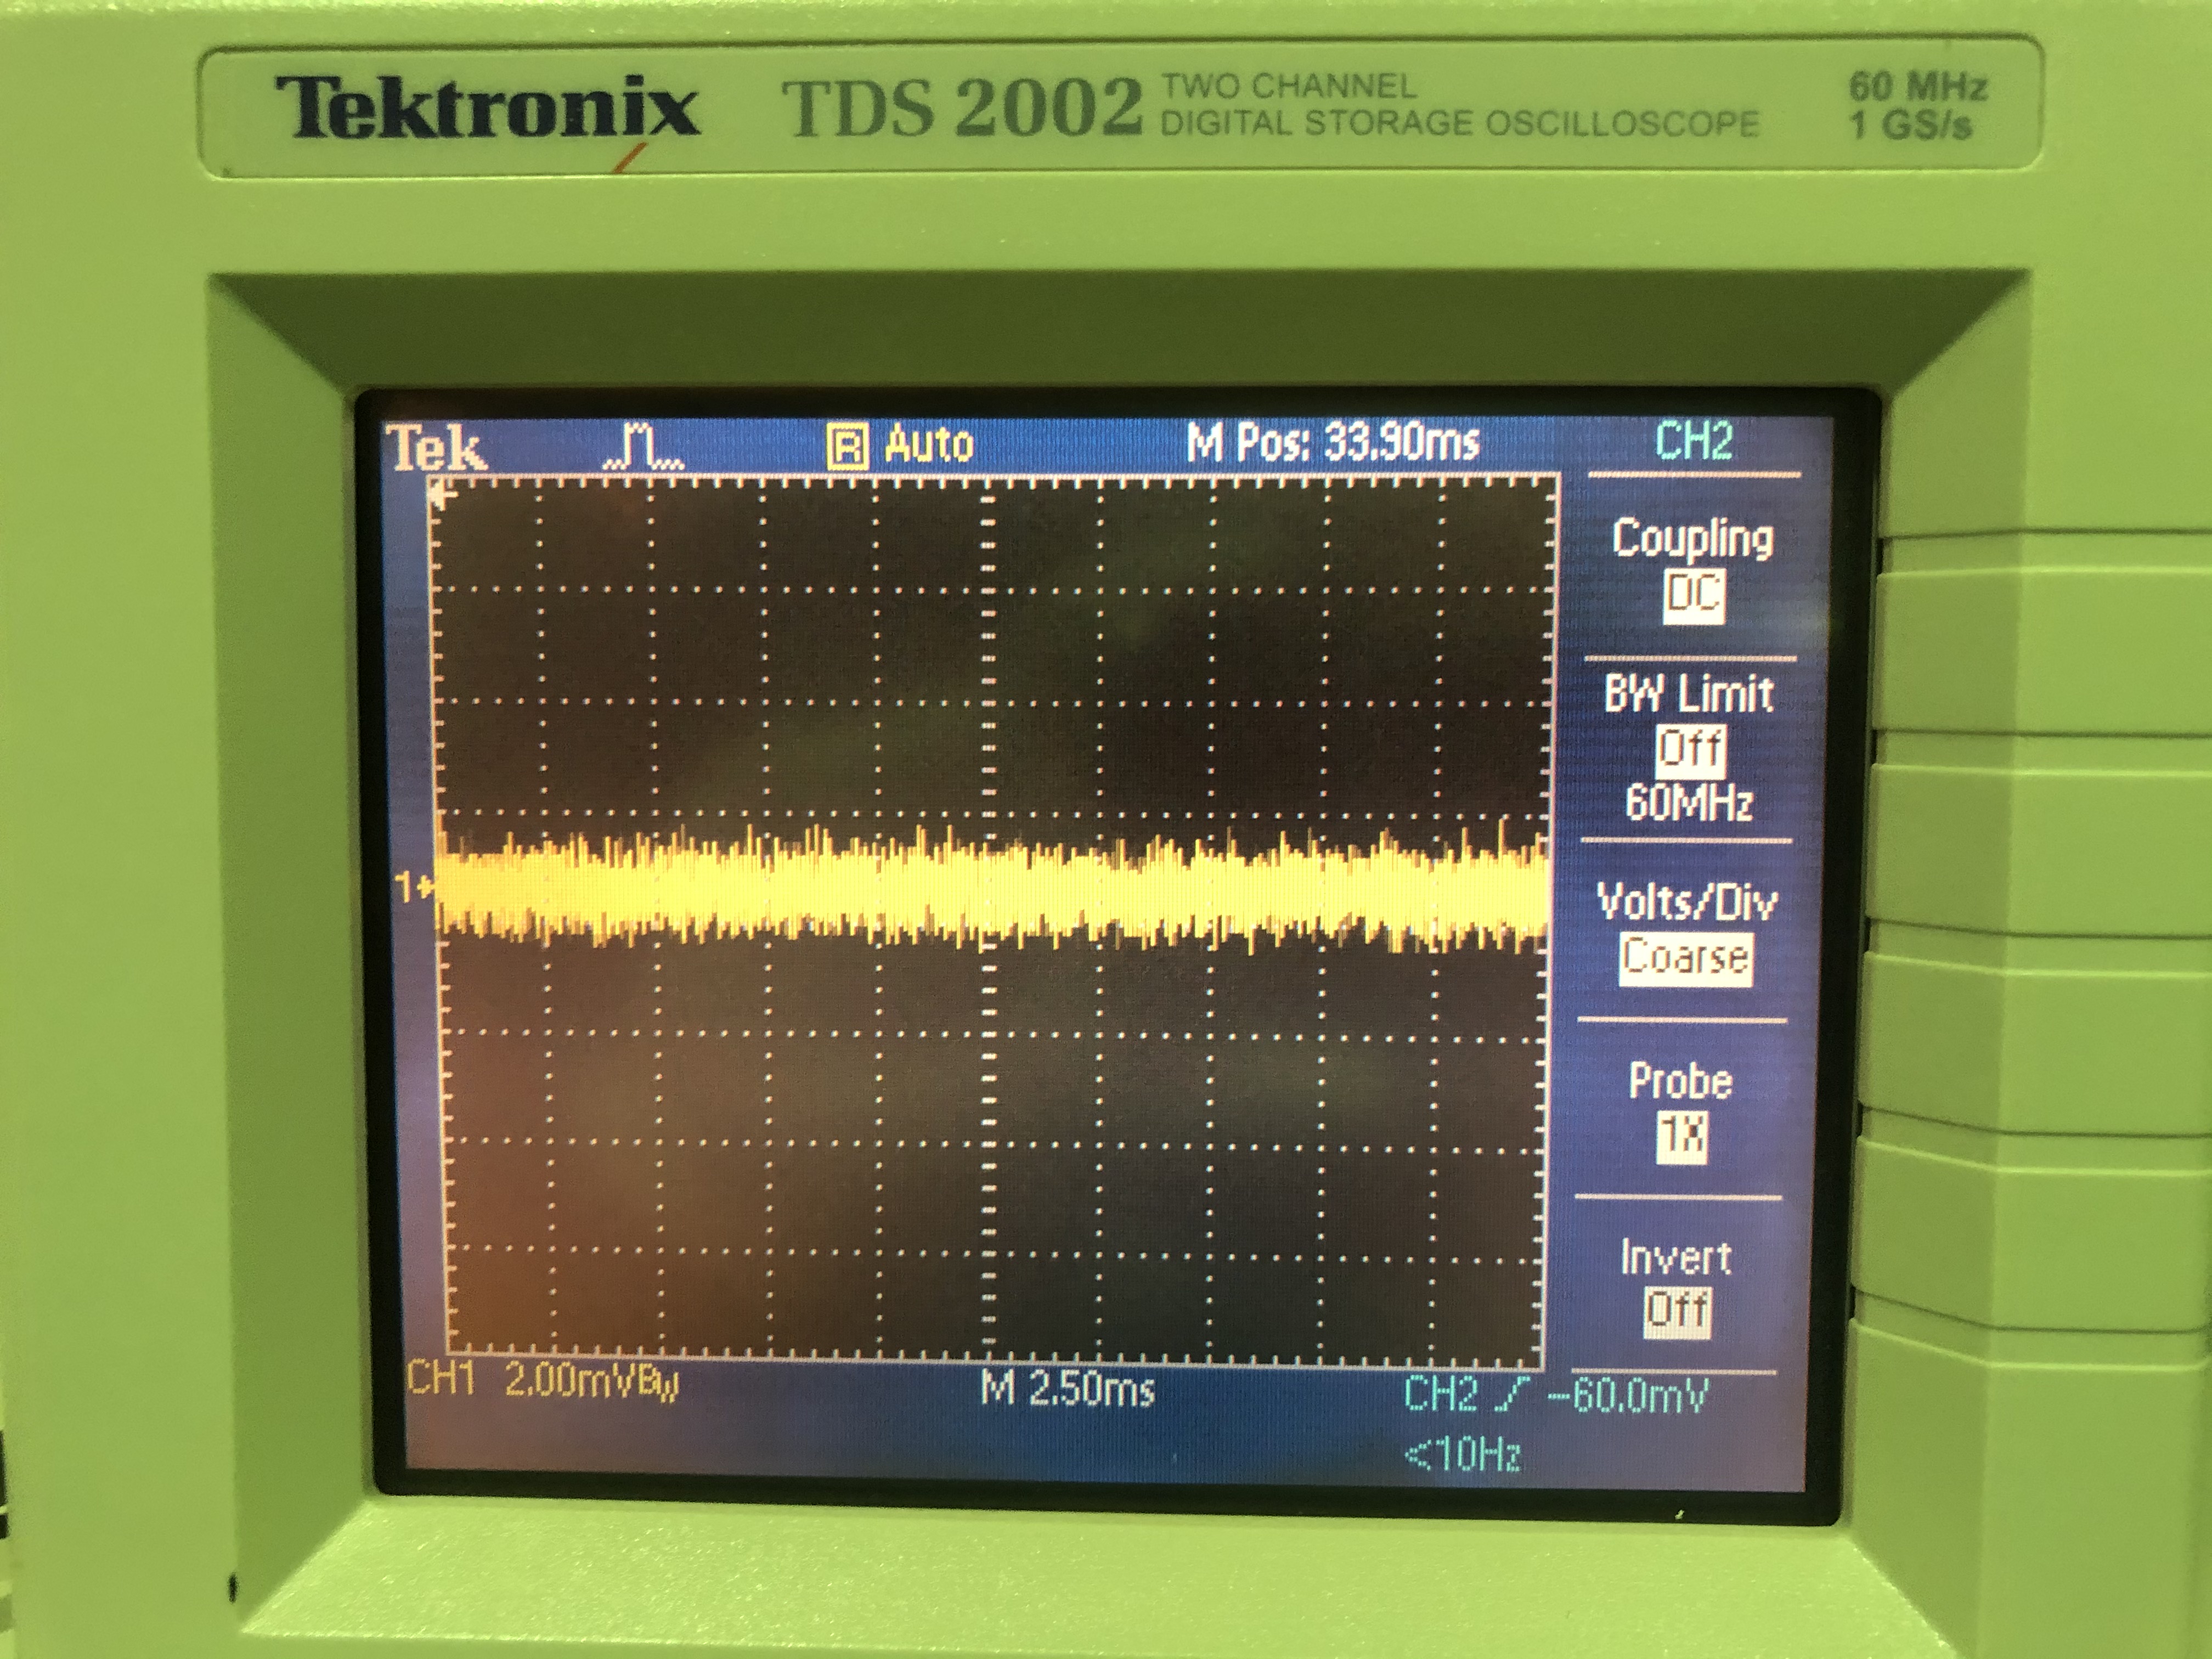
Yao-Chin and Yuhang
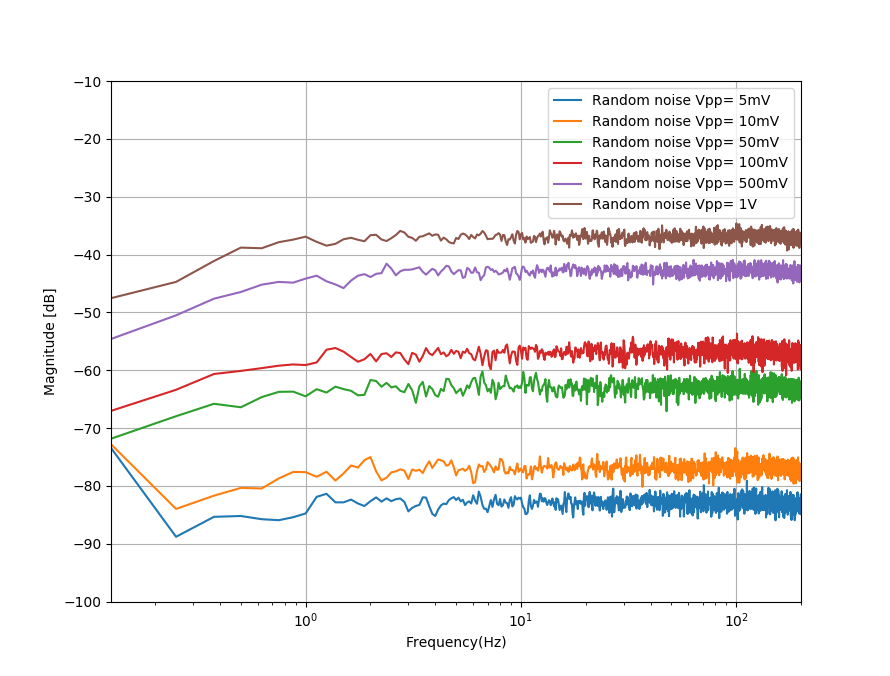
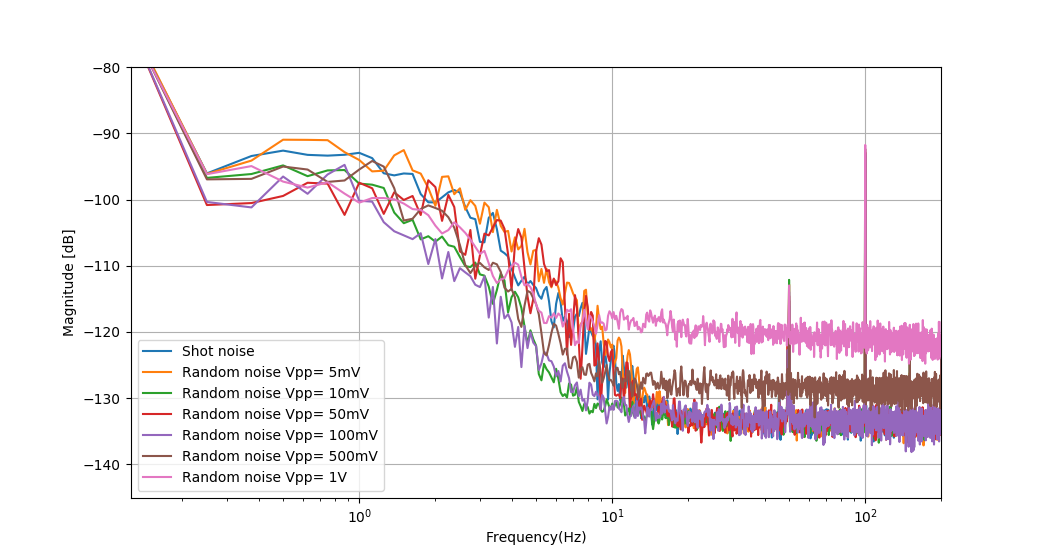
When IRMC locking and only LO light hit into homodyne detector, we aligned LO light to arrive dc balance signal of homodyne shown in fig 1 and measured shot noise using analyzer (Aglient 35670A). Using low frequency, which range from 125mHz to 200Hz, random noise from analyzer source sent to high voltage amplifier (Gain: x15) of IR phase shifter(CC2). With different Vpp values of random noise (its spectrum shown in fig 2), we measured the RF spectrums of homodyne detector. Below 100mV Vpp, the spectrums are similar from 20Hz to 200Hz range shown in fig 3. The magnitude value of shot noise increased when above 500mV Vpp of random noise.
|
Vpp of random noise (mV) |
Average value (dB) |
| 0 | -133.40 |
| 5 | -133.34 |
| 10 | -133.40 |
| 50 | -133.34 |
| 100 | -133.29 |
| 500 | -128.40 |
| 1000 | -120.98 |
Note: We average spectrum magnitude value from 20Hz to 200Hz.
Pengbo, Simon
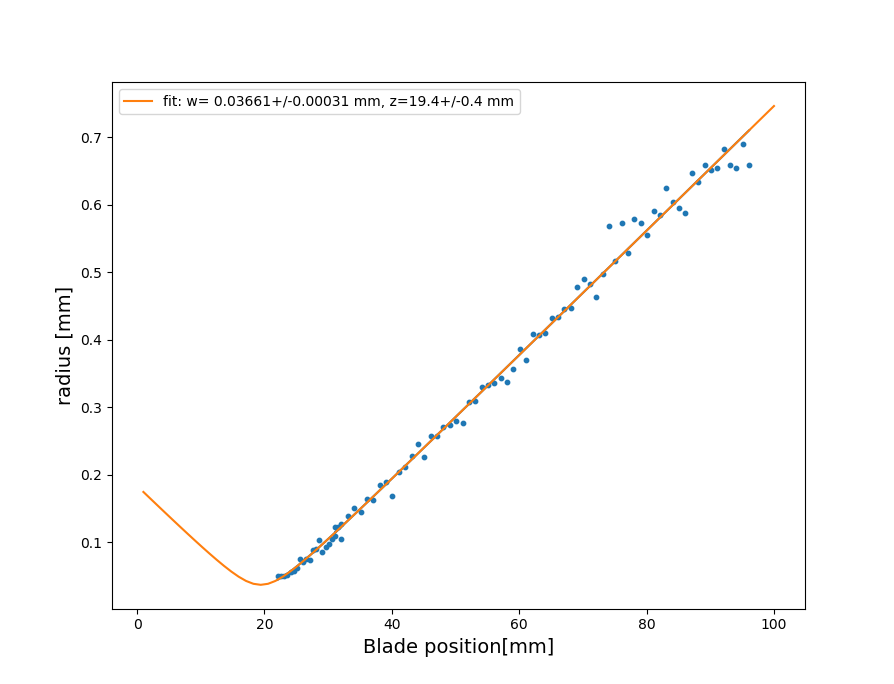
We finished the measurements of the beam-profile after the telescope.
The horizontal profile could not be measured directly at the waist (as we put the blade too much on the sensor-side). However, the fit with a Gaussian diffraction development gives a good result in terms of the expected waist diameter of 70 mum (~ 72 mum from the fit, see attached picture).
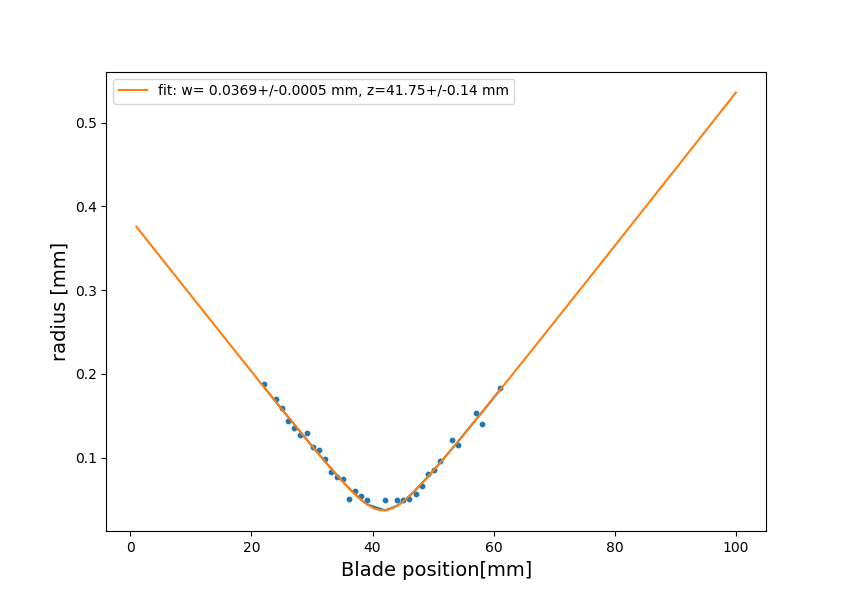
For the vertical measurements, we put the blade ~2cm closer to the pump-beam side and started another run. This time (see the second figure attached) we could cross the beam's waist in the expected position which is in correlation with the horizontal measurements. Also here, the distribution has been fitted and the diameter estimated to be ~74 mum at the waist, also in agreement with the horizontal measurements.
Eleonora, Raffaele, Yaochin and Yuhang
Yesterday night we came to TAMA and improved especially the matching and alignment from OPOtra to filter cavity. We moved the lens position and also tried to align a bit the steering mirror. After this work, the matching level is estimated as following
TEM00: 460
TEM10: 108
LG10: 108
offset: 100
So the mis-matching level is about 5%
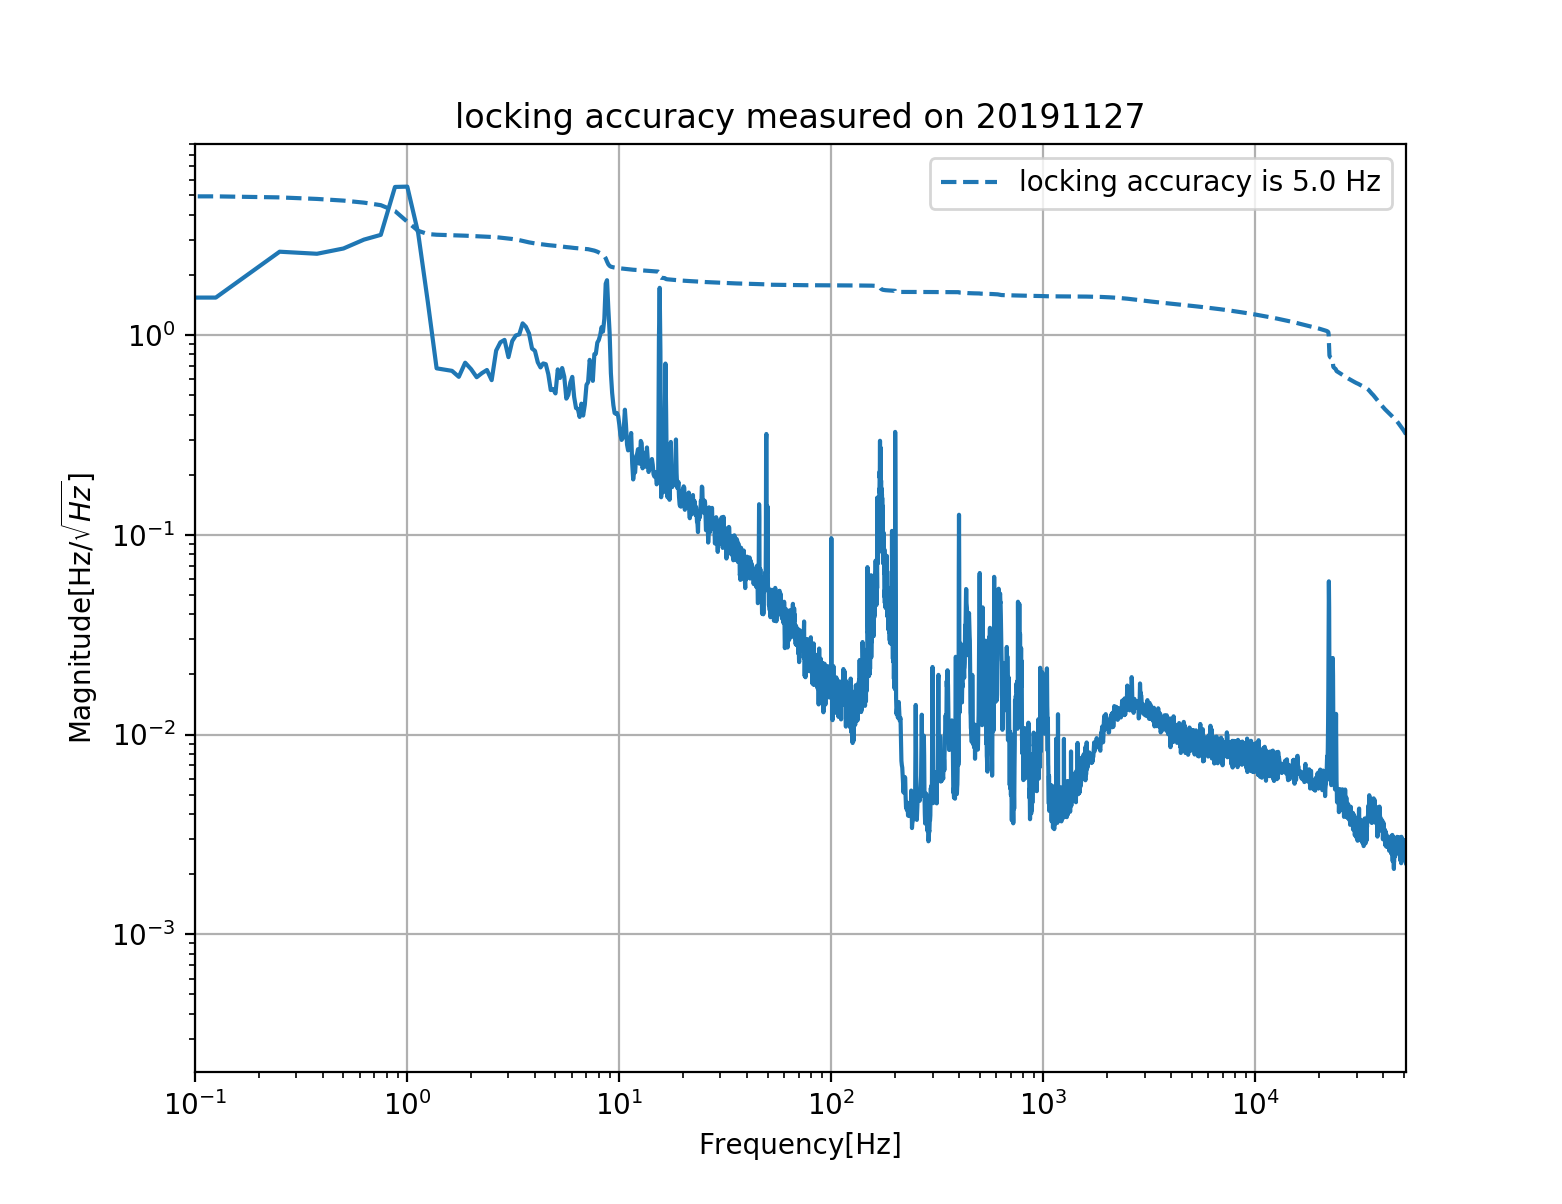
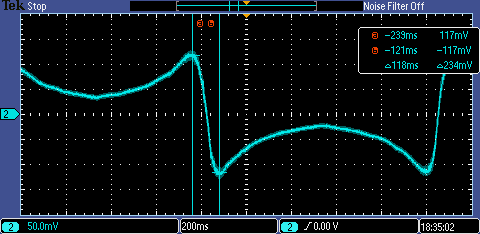
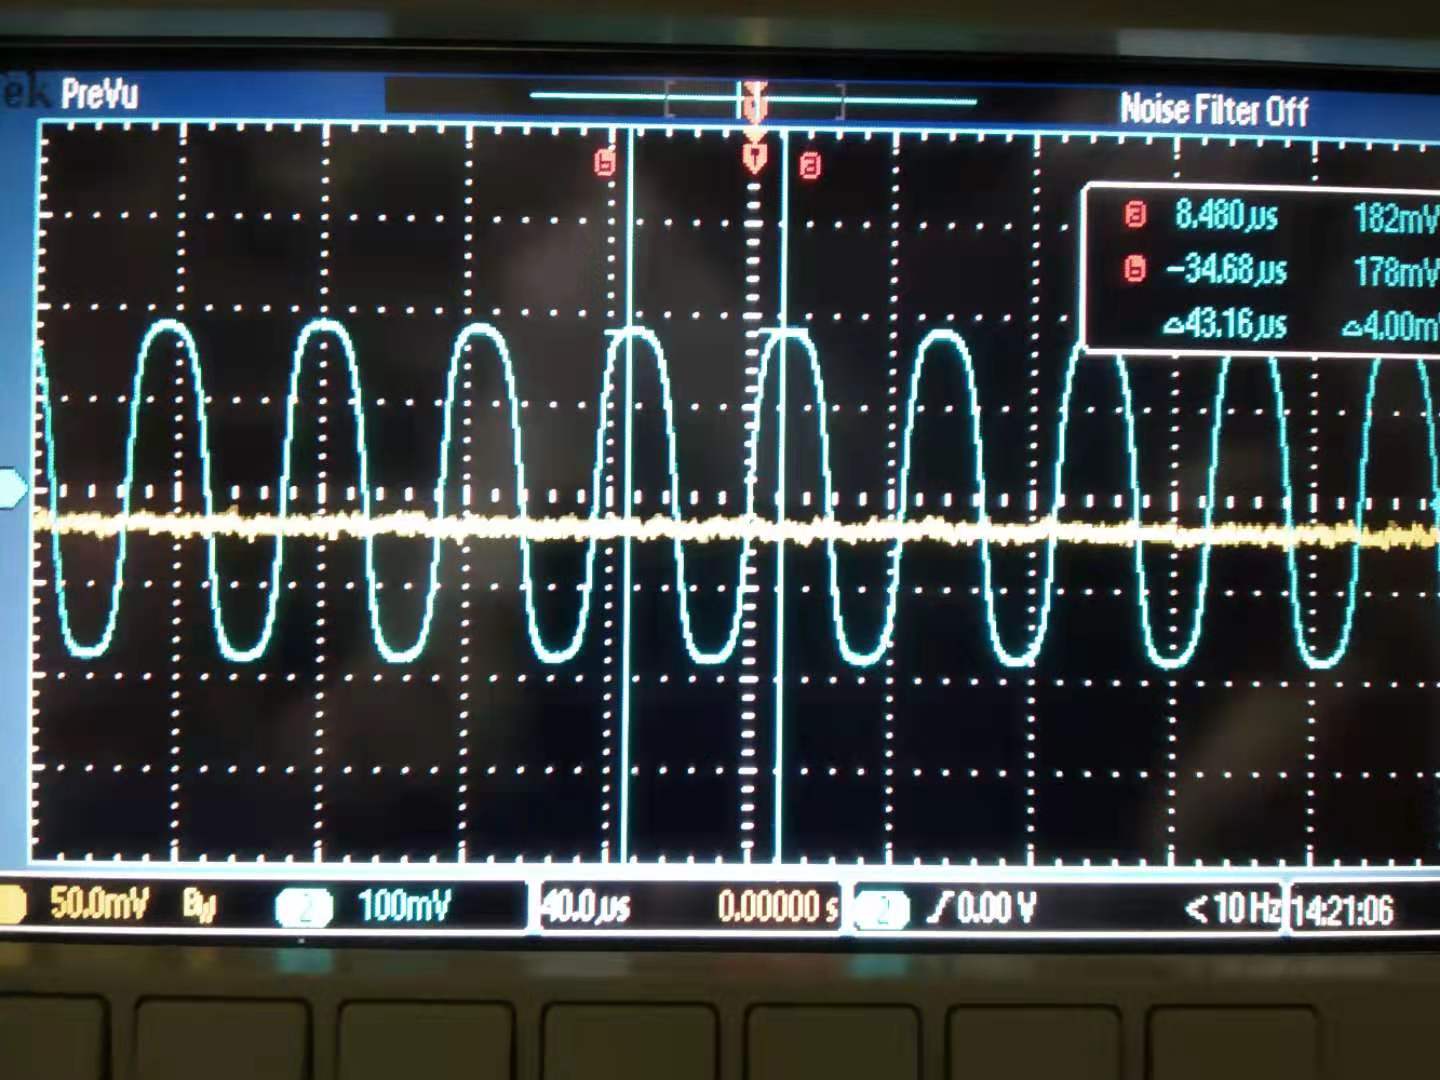
This matching level is better than the measurement of locking accuracy of last time. And we think the matching level will also influence the locking accuracy. So we characterize the locking accuracy again. This time we used the same setting as last time. The AOM was scanned with a modulated sine wave. The modulation is 2000Hz/s. We measured the PDH signal and use it for calibration. The measured PDH signal pk-pk is 234mV with a seperation of 118ms.
So the calibration is 2000/(2*234/118) Hz/V
We measured the demodulated BAB reflection spectrum, the locking accuracy is integrated as 5Hz. But now we have some new peaks.
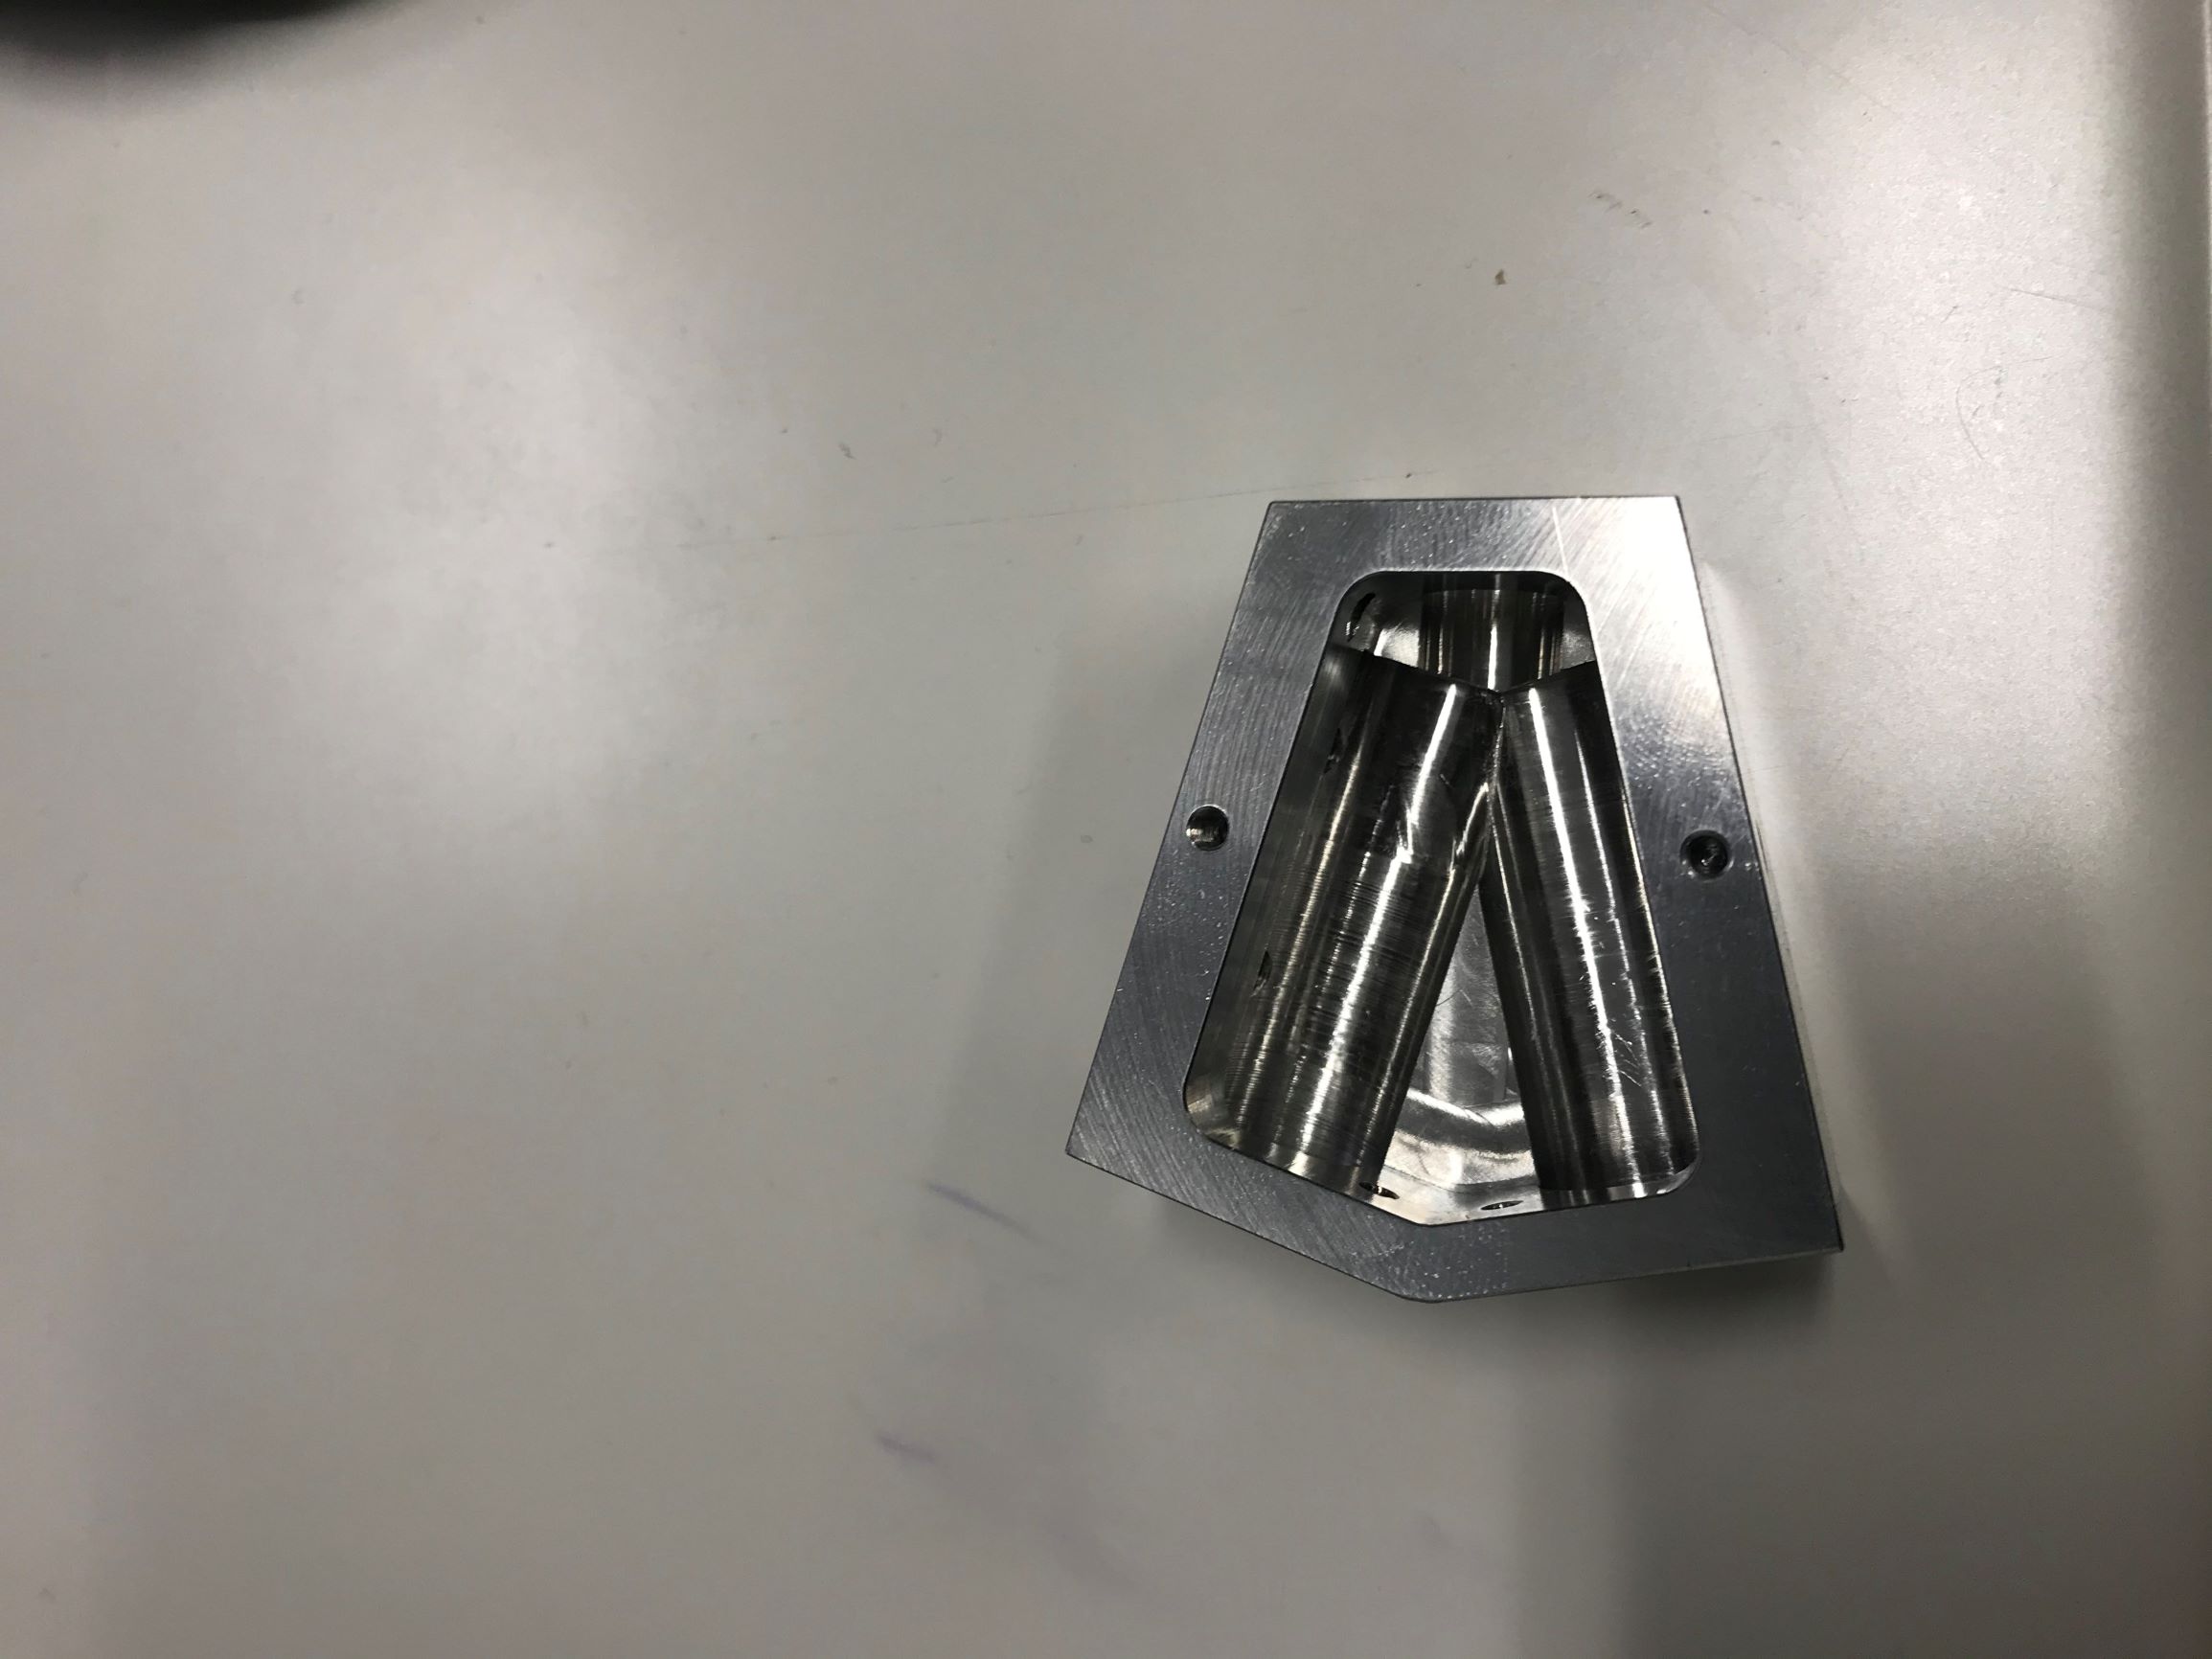
Today, the spacer for cryogenic cavity was delivered and I did brief inspection of it with half inch flat mirror.
I just checked whether the reflected beam can pass through the output hole of the spacer or not.
The reflected beam could pass through, but there is a undesirable feature due to my mistake of design.
Fortunately it can be easily removed by an additional machining.
I will ask the company to do it.
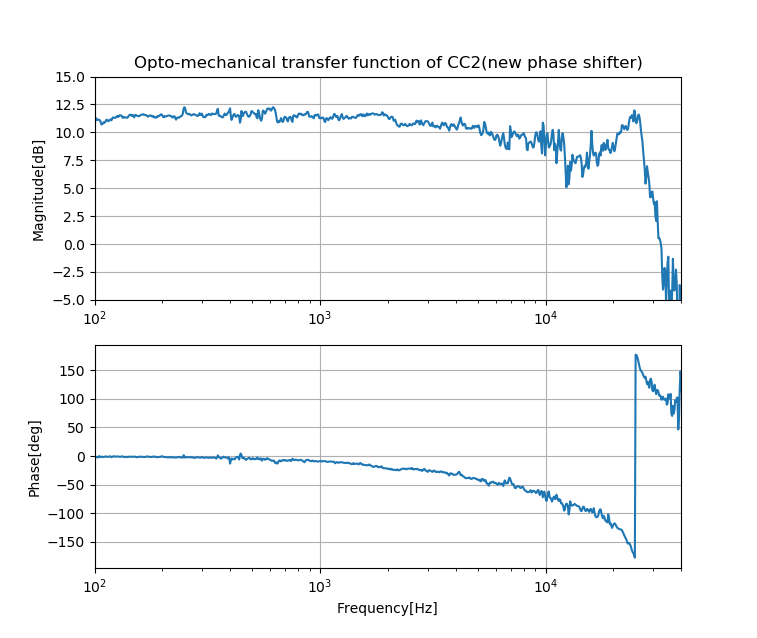
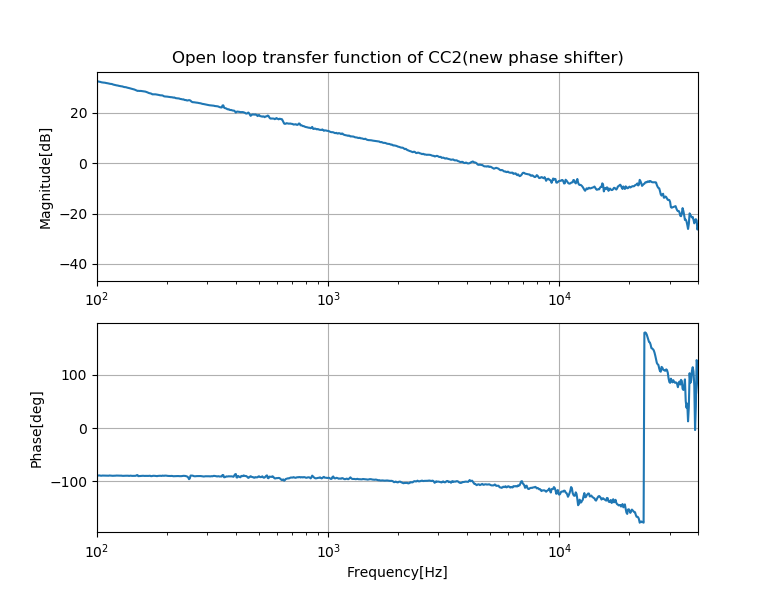
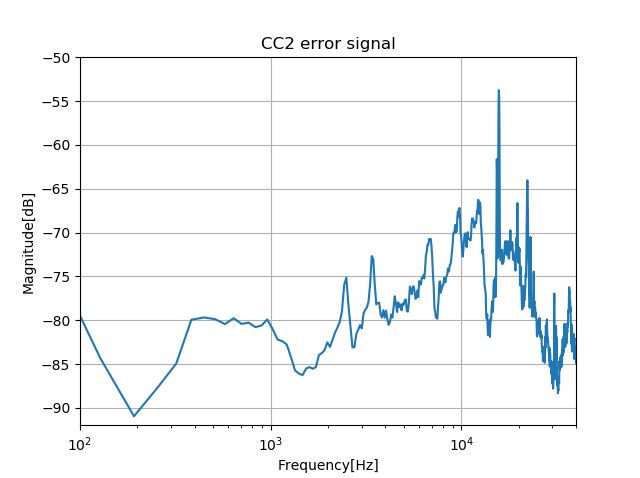
The measurement of CC2 loop opto-mechanical transfer function, CC2 open loop tranfer function and CC2 error signal spectrum is attached as attachement.
The good news is that the OMTF is very flat.
The first obvious oscillation we could find is ~23kHz(the last attachement). While we could see from the error singal spectrum, we have two narrow peaks at ~15.5kHz and ~22kHz.
Aritomi, Eleonora, Yaochin and Yuhang
We found that fc tra is more than 3000 counts. And this is more than we had, so we did the following check. And it shows that the more green power seems to be from a higher conversion efficiency of SHG.
green before EOM 268mW
before AOM 48.4mW
before MZ 198mW
AOM frequency 109.03575MHz
AOM amplitude 2.5dbm (then go through zhl-2 amplifier to AOM)
[Aritomi, Yuhang, Yaochin, Eleonora, Matteo, Raffaele]
First we aligned IR into filter cavity. Current mode matching is around 95.8%.
| Mode | IR transmission |
| TEM00 | 400 |
| HG10 | 112 |
| HG01 | 105 |
| offset | 102 |
Then we succeeded in locking CC2 with filter cavity with new phase shifter. This time CC2 testmass feedback worked well and CC2 correction signal and IRMC reflection became more stable. Gain of testmass feedback is -2.
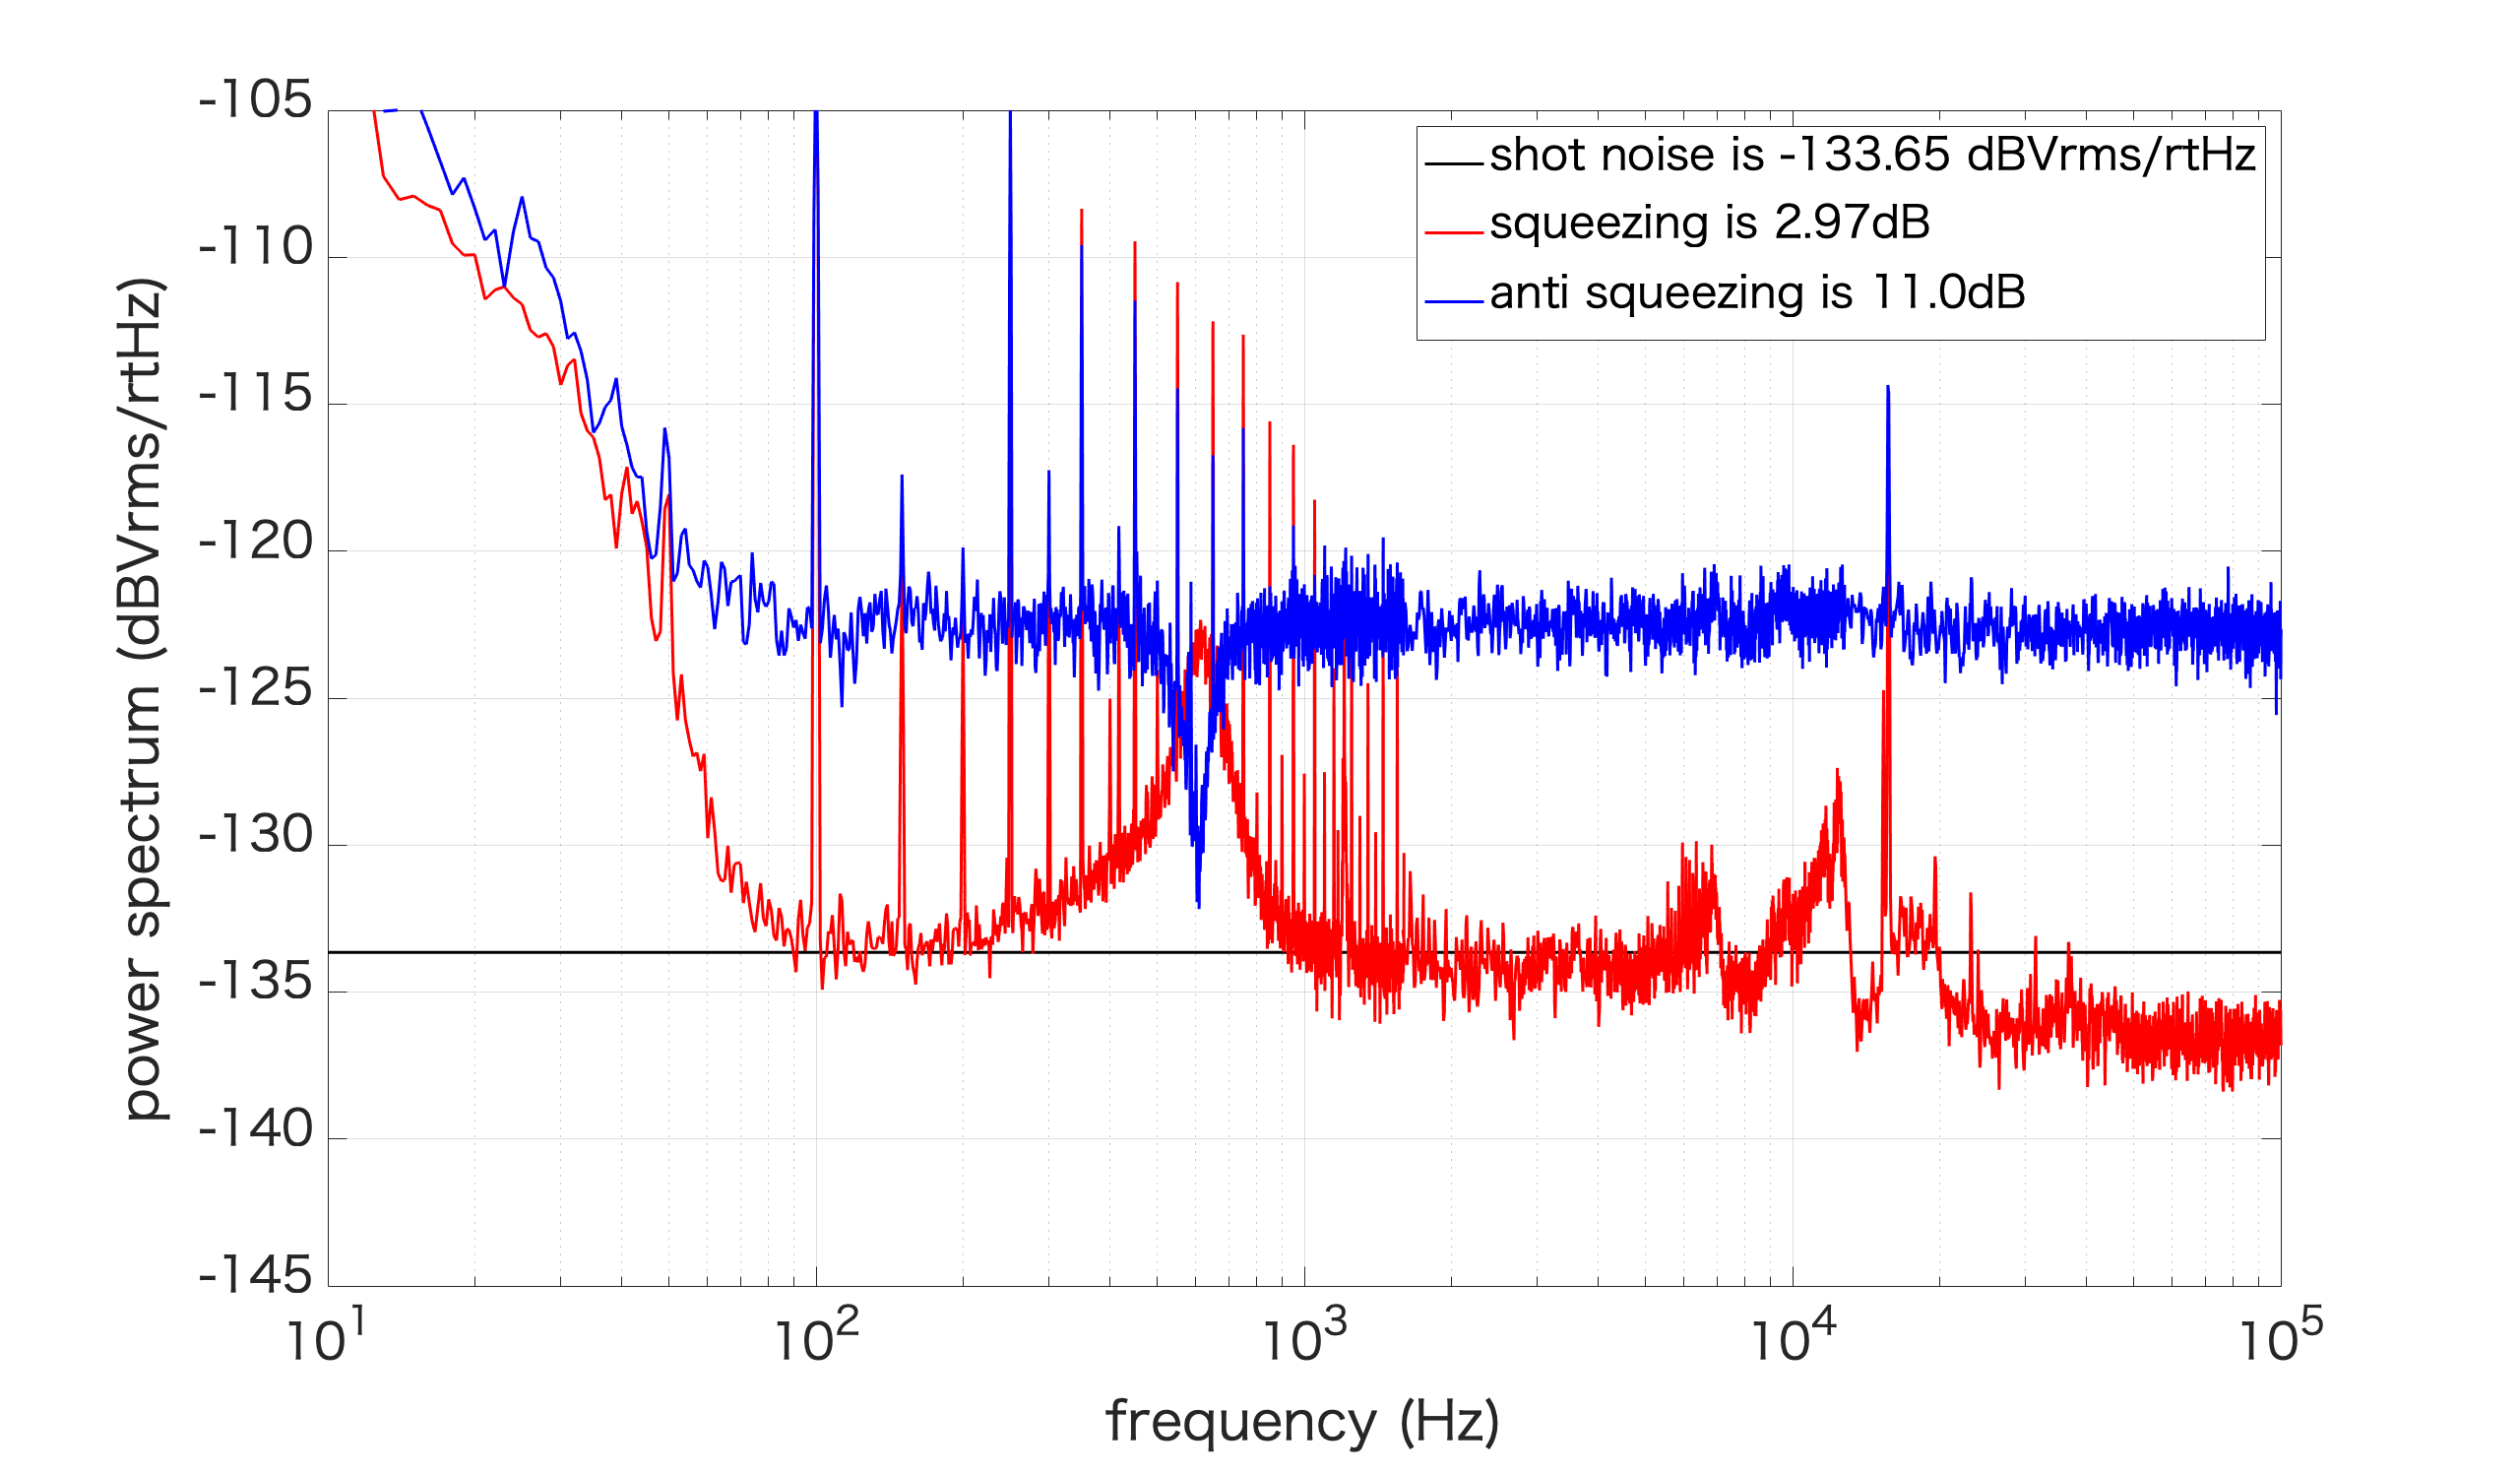
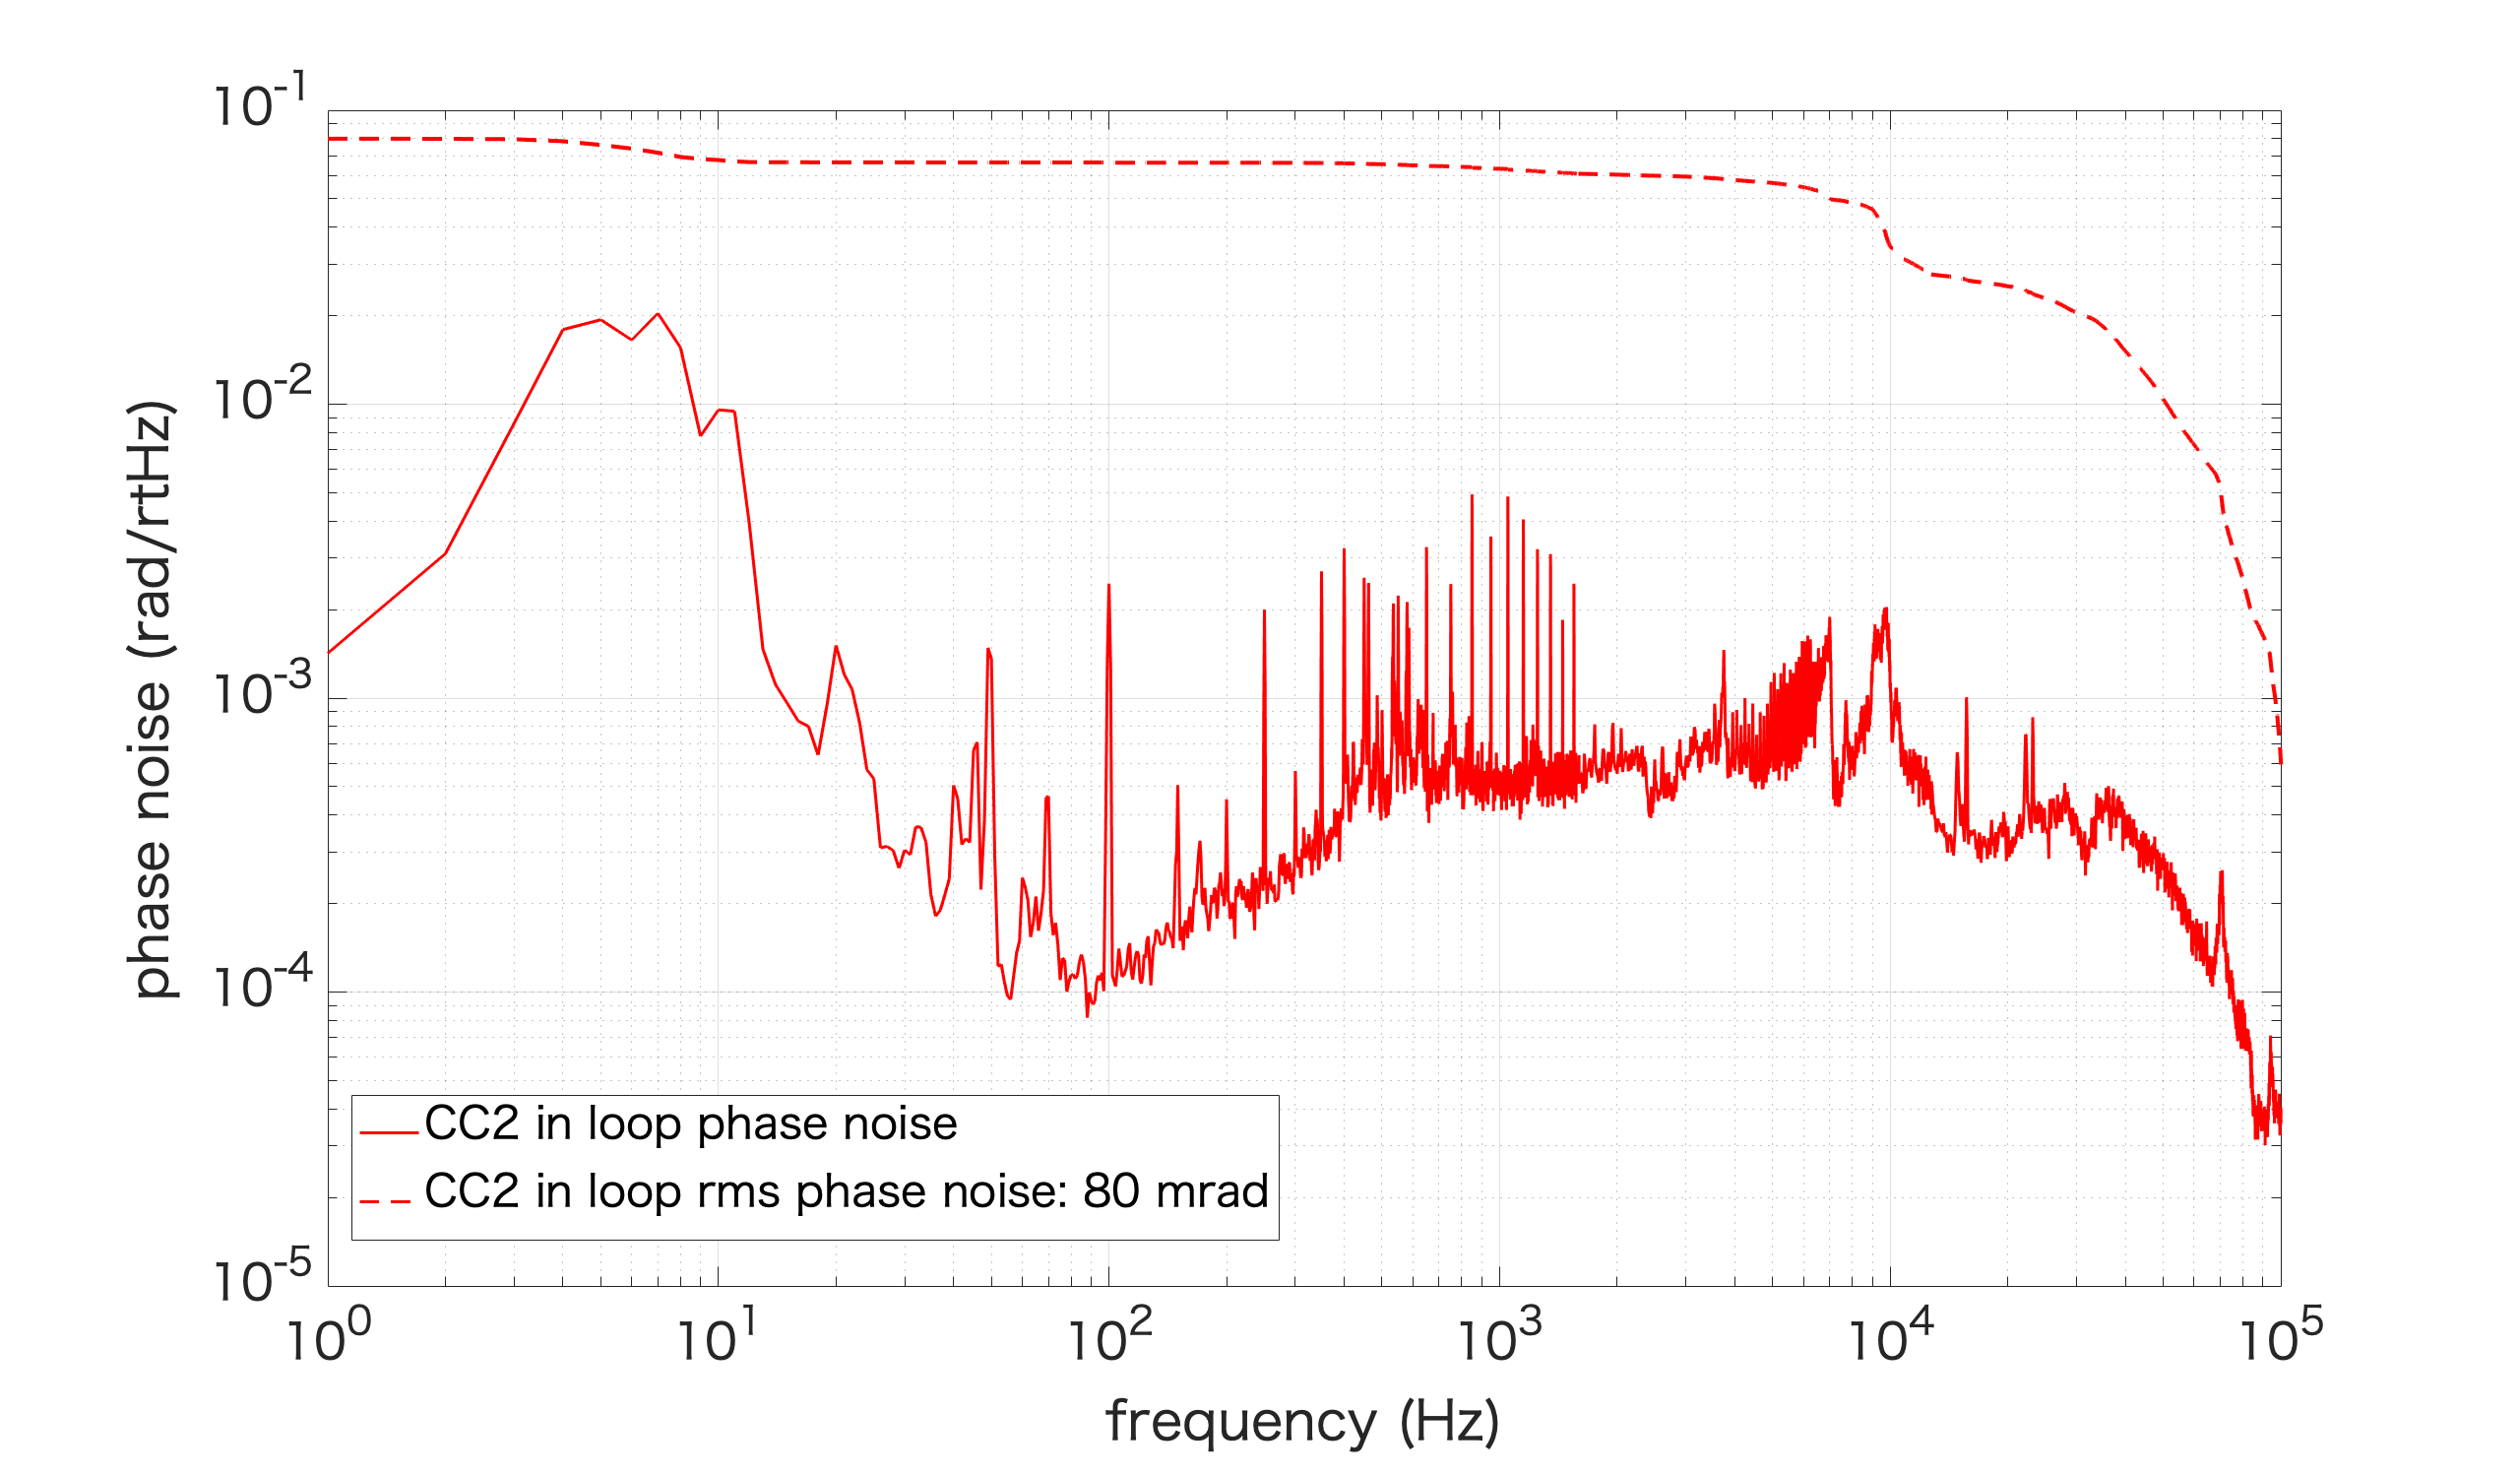
We measured FDS at 600Hz and CC2 phase noise (Pic.1,2). CC2 demodulation phase is as follows. CC2 error signal is 76mVpp. At high frequency, we had 3dB squeezing, but the spectrum was not clean. Below 100Hz, there was large bump.
| CC2 demodulation phase for SQZ (deg) | CC2 demodulation phase for ASQZ (deg) | |
| FDS | 70 | 100 |
| FIS | 95 |
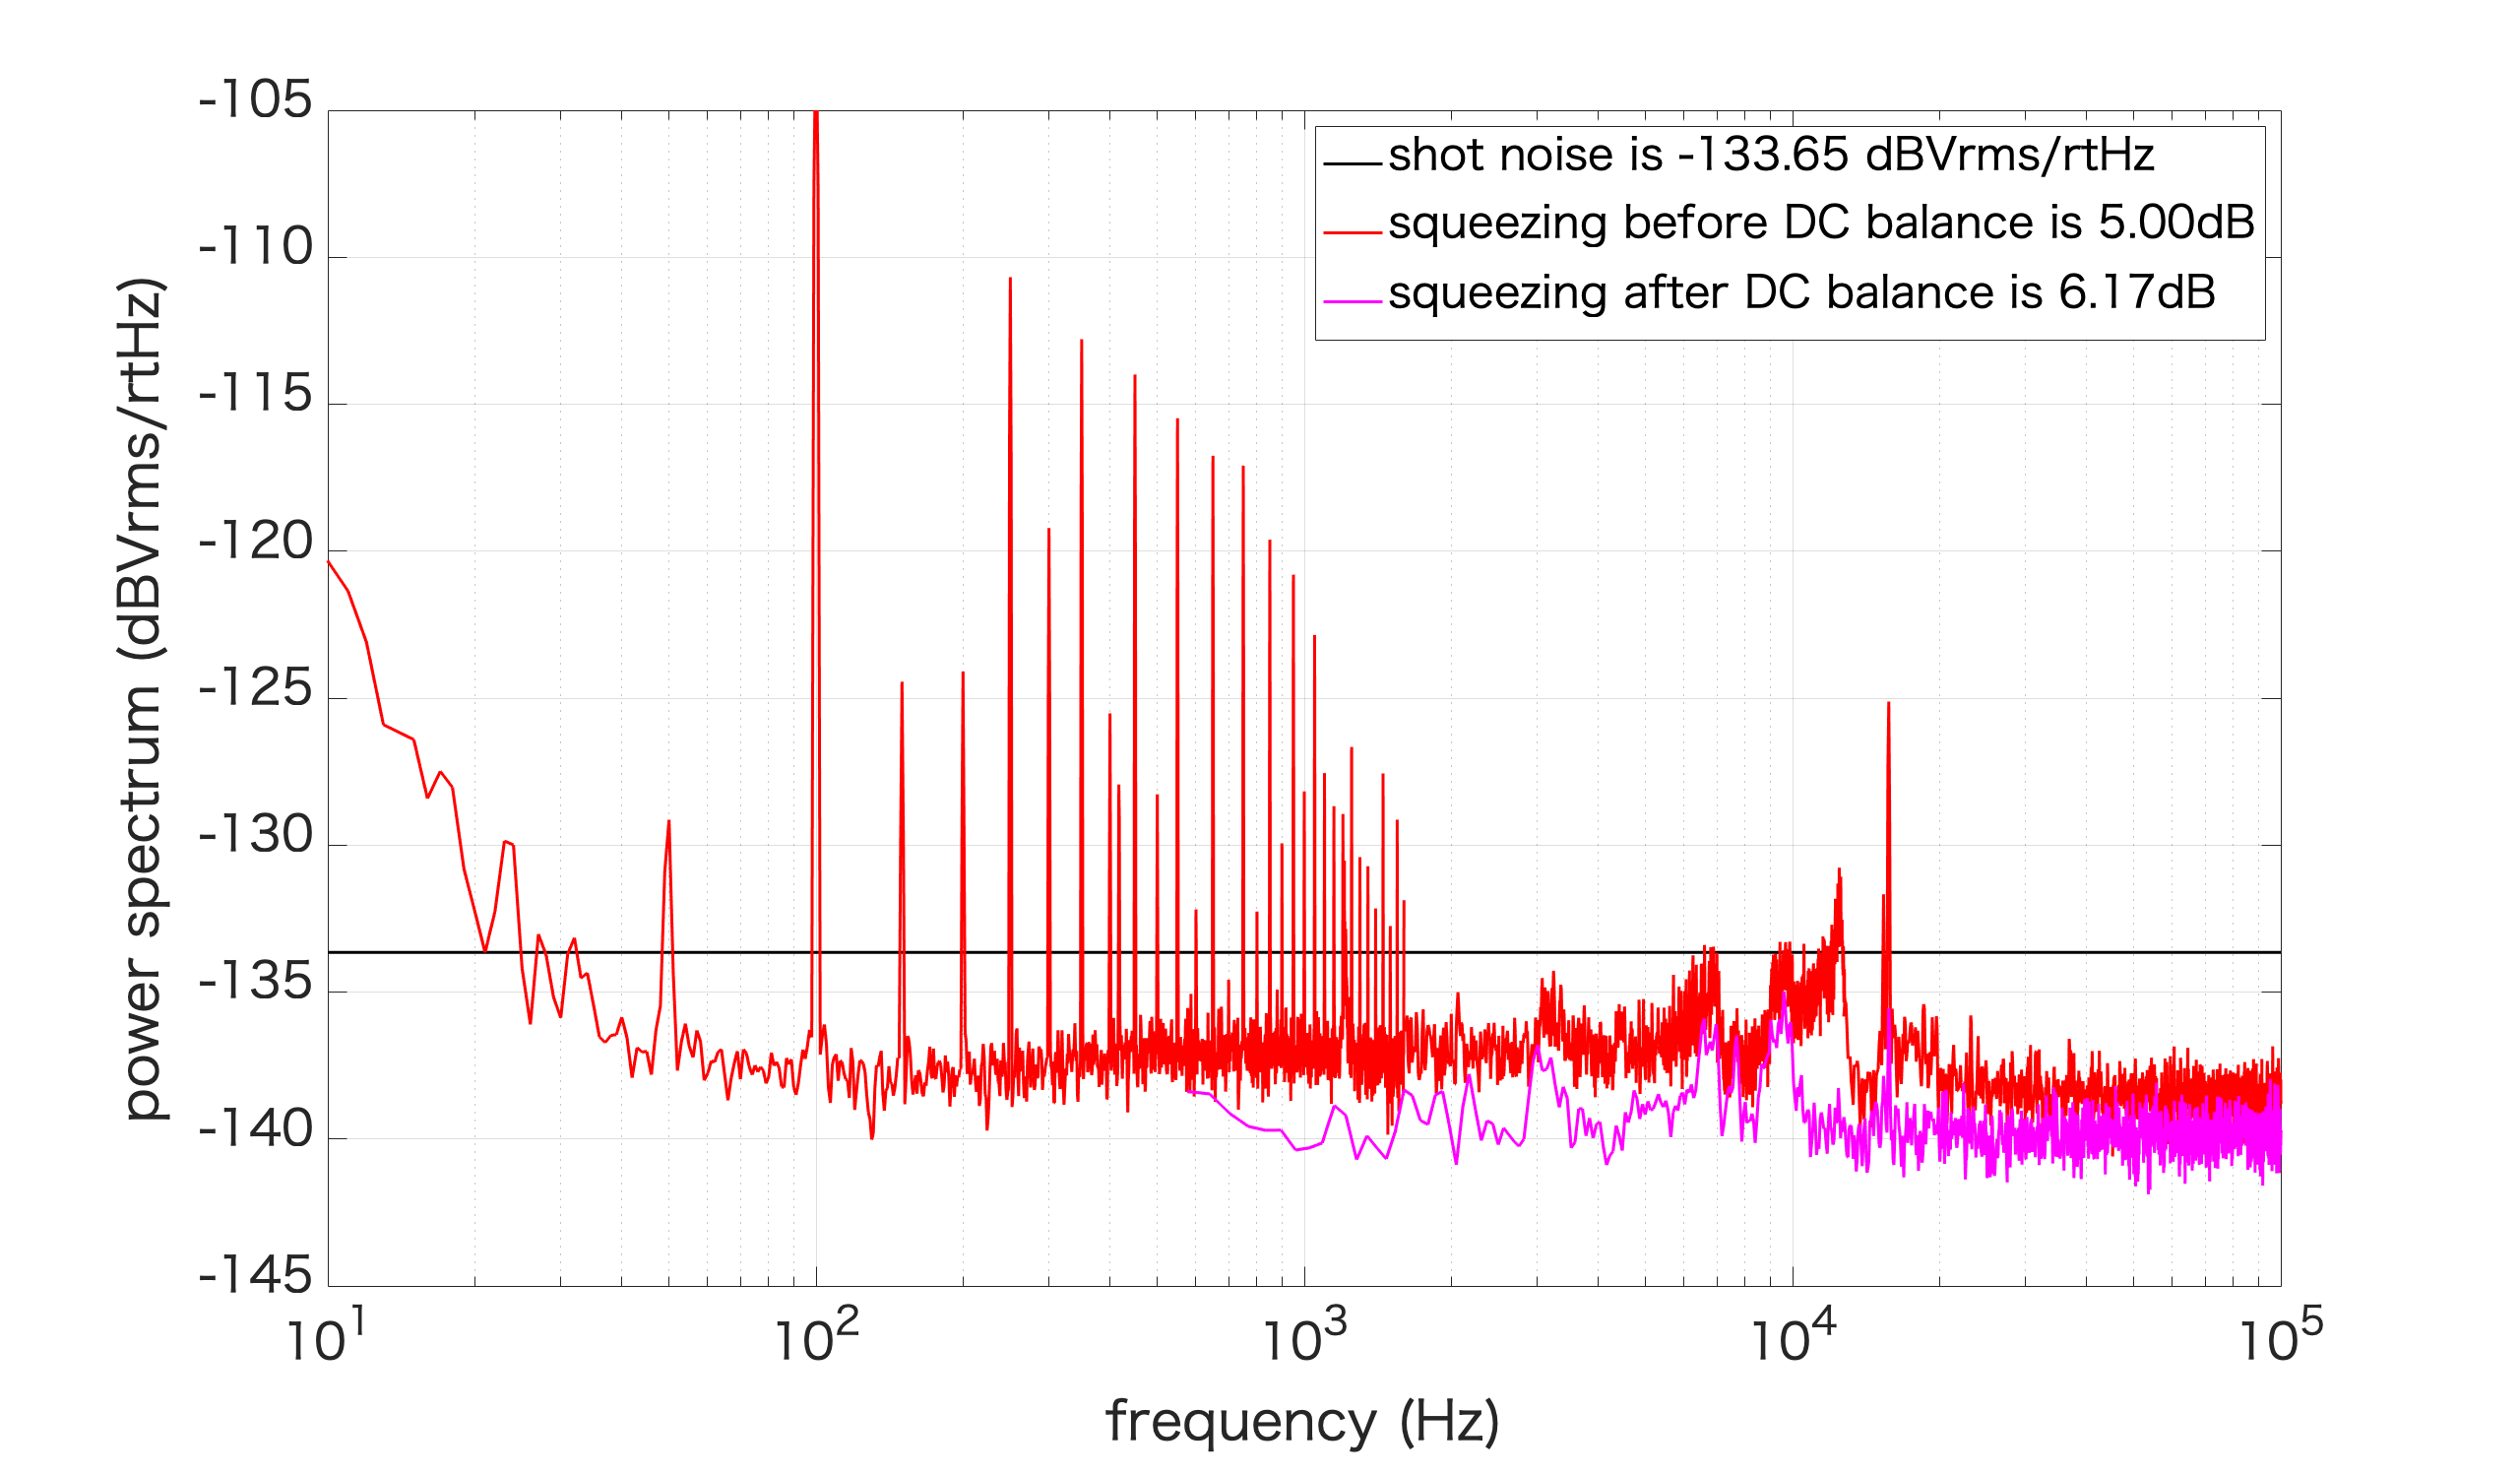
After this measurement, we found that DC balance of LO was bad. We measured frequency independent squeezing before/after DC balance (Pic.3). After DC balance, squeezing spectrum and squeezing level got better, but still not clean as before.
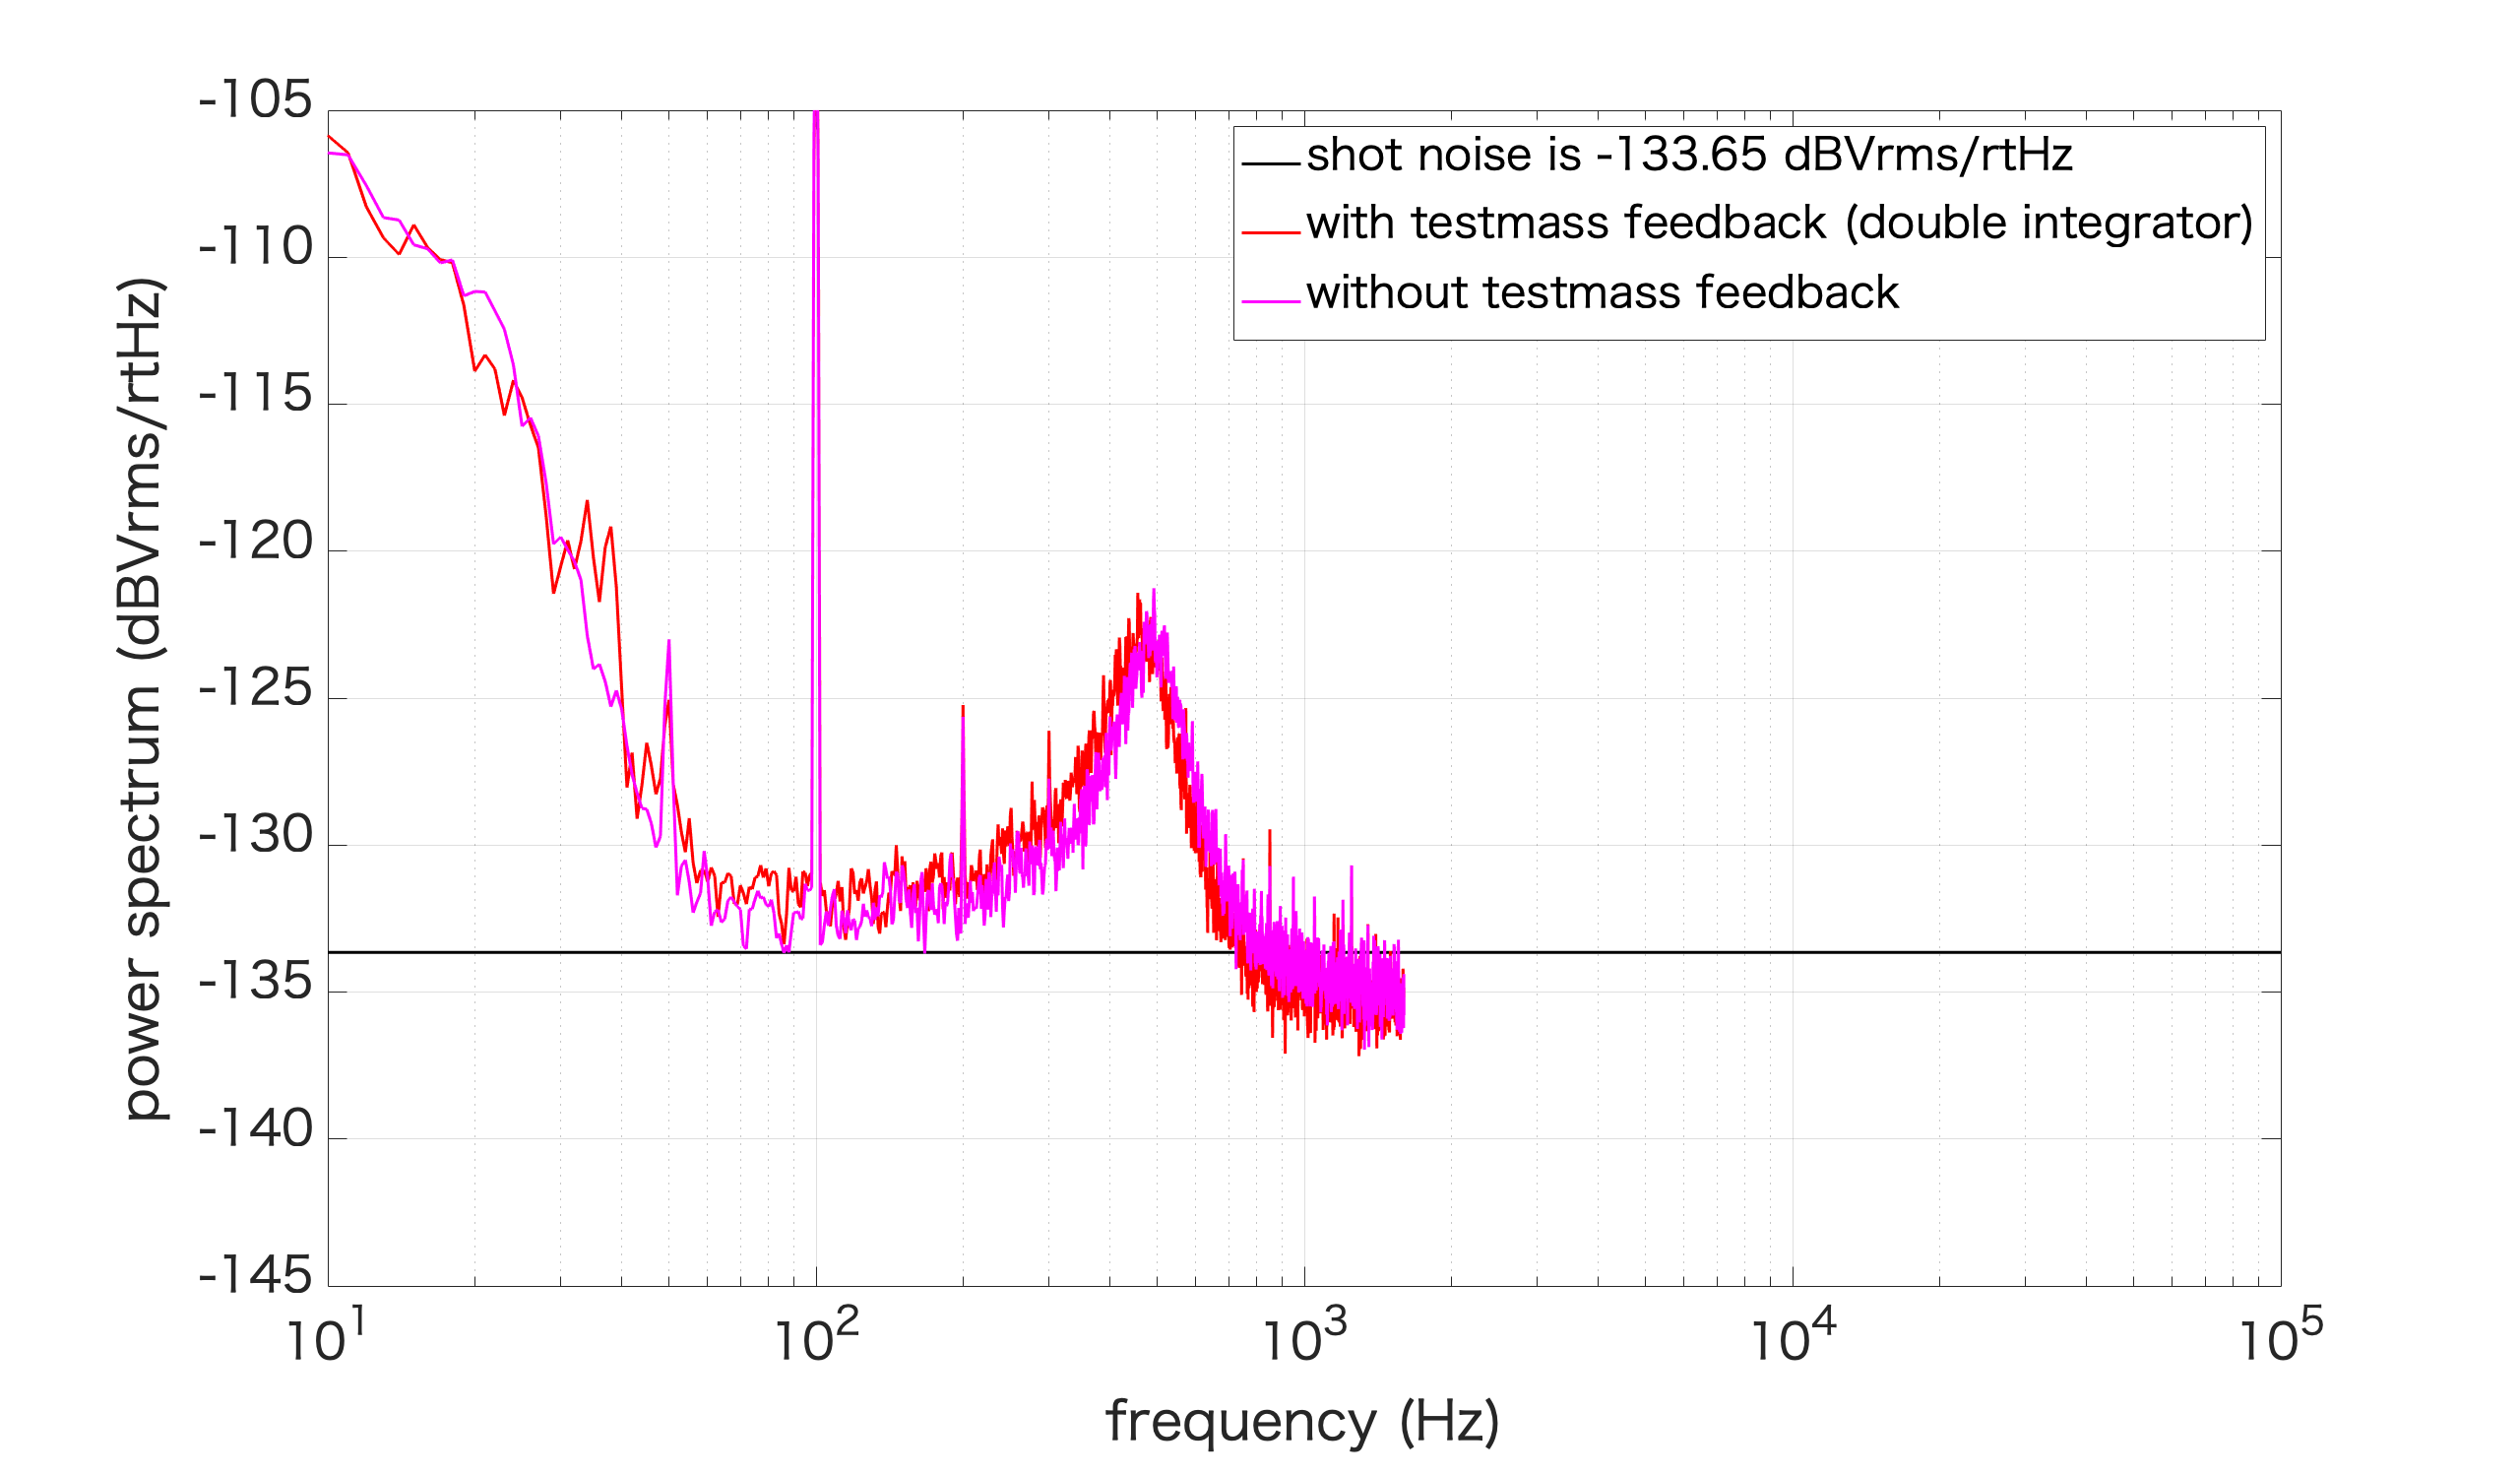
Then we measured FDS again with/without testmass feedback (Pic.4). Low frequency bump became lower down to 60Hz and it doesn't change with/without testmass feedback. It seems that DC balance improved low frequency bump.
I roughly investigated the transmittance of fused silica mirrors which will be used for input and output couplers.
I measured transmitted beam power for 2 of 4 mirrors.
The trasmitted power was 1.8uW for both of them with respect to 10mW incoming power.
This value corresponds to T=0.018% and R=99.982% assuming no loss in mirrors.
Then the finesse can be estimated as 1.7*104.
This value is reasonable since the designed finesse was 1.5*104.
I gonna construct FP cavity with these mirrors and try to lock TEM00.