NAOJ GW Elog Logbook 3.2

[Aritomi, Yaochin]
We removed old faraday and aligned IR to filter cavity. Current mode matching is 86% as follows.
| Mode | IR transmission |
| TEM00 | 2700 |
| IG31 | 112 |
| yaw+pitch | 250 |
| HG20(yaw) | 130 |
| IG20 | 300 |
| offset | 94 |
We found that IR transmission with parametric amplification is more stable than before as attached movie. We also know that IR transmission is stable without parametric amplification. So IR fluctuation is related to parametric amplification and replacement of faraday. We suspect that IR fluctuation we had before came from back reflection although we have two faradays. Isolation ratio of new/old faraday is almost same (38dB), but new faraday is closer to OPO and this may reduce back reflection from optics between old and new faraday.
We'll make GR and IR overlap next week.

[Aritomi, Yaochin]
We measured loss of new faraday. We made BAB top on resonance of OPO by hand. Loss of new faraday and HWP and f = 100 mm lens is 3% as follows.
| position | BAB power (uW) |
| before faraday and f = 100 mm lens | 395 |
| after faraday and HWP | 383 |
We also measured loss between PBS and PR chamber. Loss between PBS and PR chamber is 1.3%.
| position | BAB power (uW) |
| before PBS | 389 |
| after PBS | 388 |
| before PR chamber | 384 |
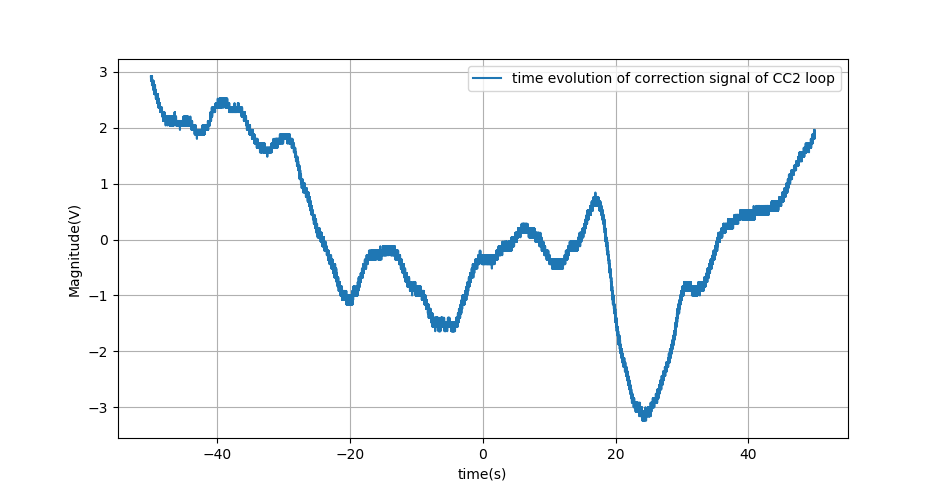
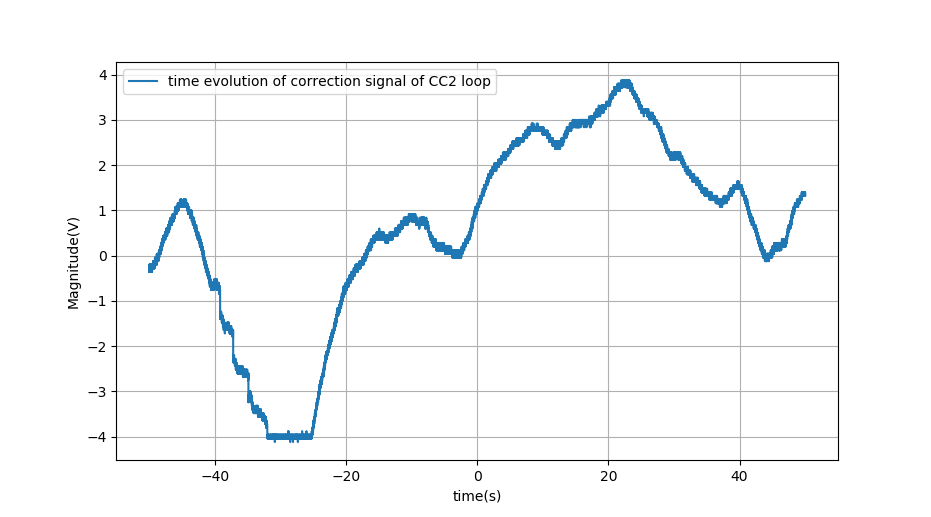
I attach a video of CC2 loop correction signal when squeezing is reflected by Input mirror.
It seems that the high frequency oscillation (from suspension pitch, due to beam miscentering on suspendend optic?) are not large enough to saturate the actuator, but probably 1 Hz pendulum motion does.
Would an increase of a factor 3 in piezo correction that we could gain by exploiting the whole piezo dynamic be enough to avoid CC2 unlock?
Why the correction saturates when it becomes negative and not when it becomes positive?
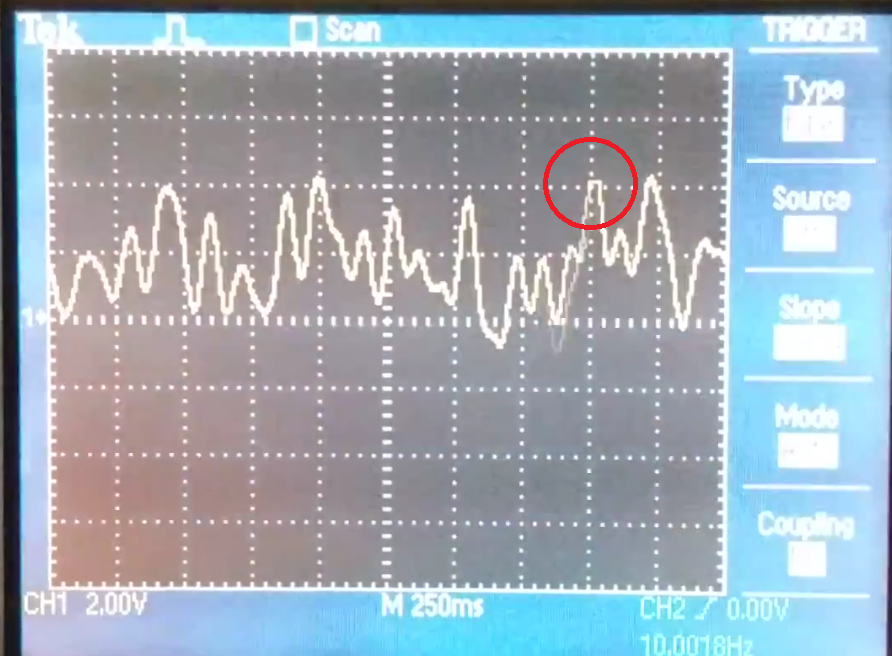
Aritomi, Yaochin and Yuhang
As suggested by Matteo, we checked the correction of the CC2 loop. The check is done before we replace the new Faraday isolator.
Actually, this correction signal surprised me because it evolves in very low frequency and the correction is quite large. I took two segments of time, in the second segment, we see the correction signal even saturates.
Simon, Pengbo
Today we covered both side of the sample OSTM (Sigma koki) with the first contact, and then put it on the sample holder.
After that, we started the polarization measurement of the KAGRA #7 sample. First, we found an arrow on the barrel and some dirty marks on one side, so we used optical tissues with alcohol to clean it. Then, we put the sample on the holder with the arrow at the top, and start the p-polarization map.
Aritomi, Yaochin and Yuhang
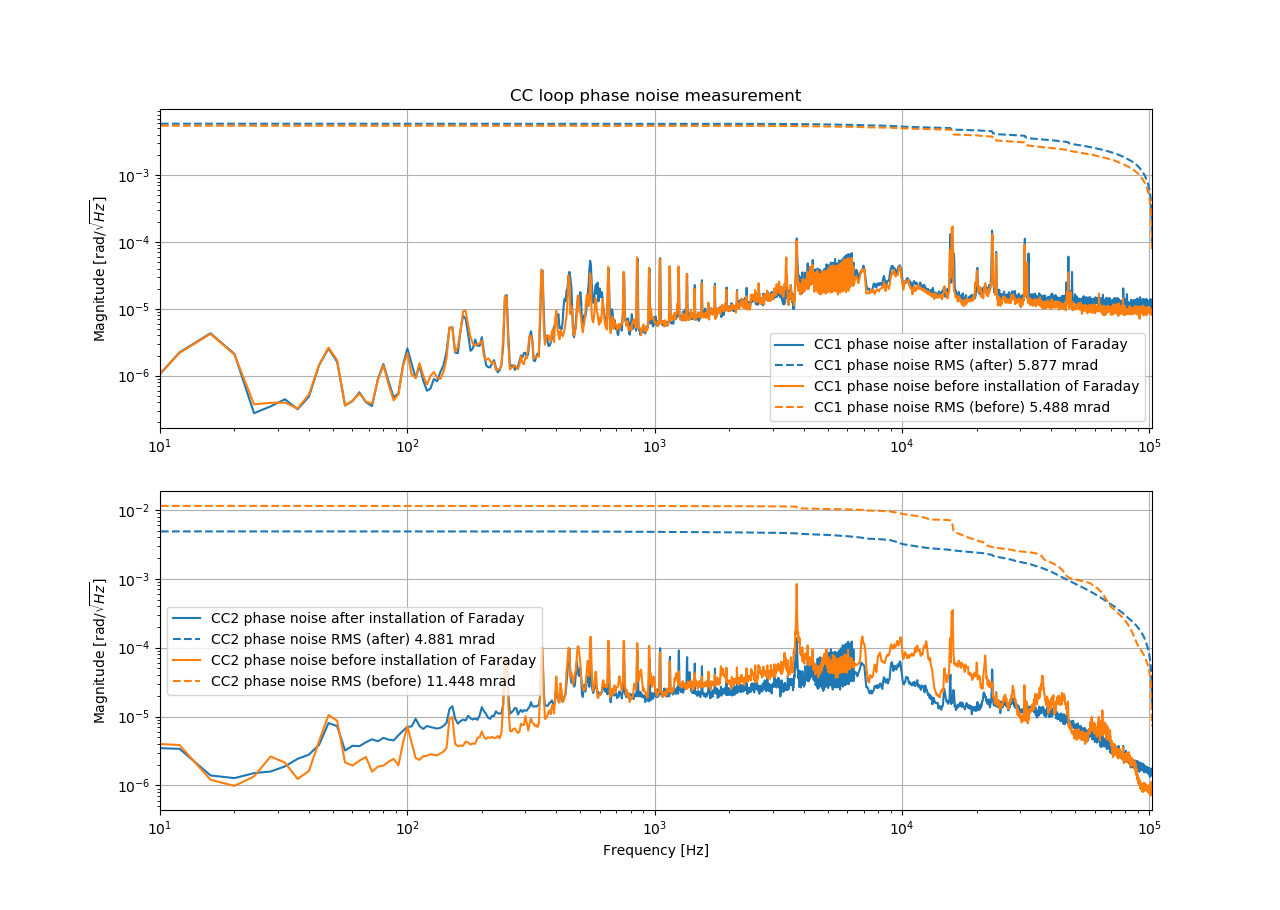
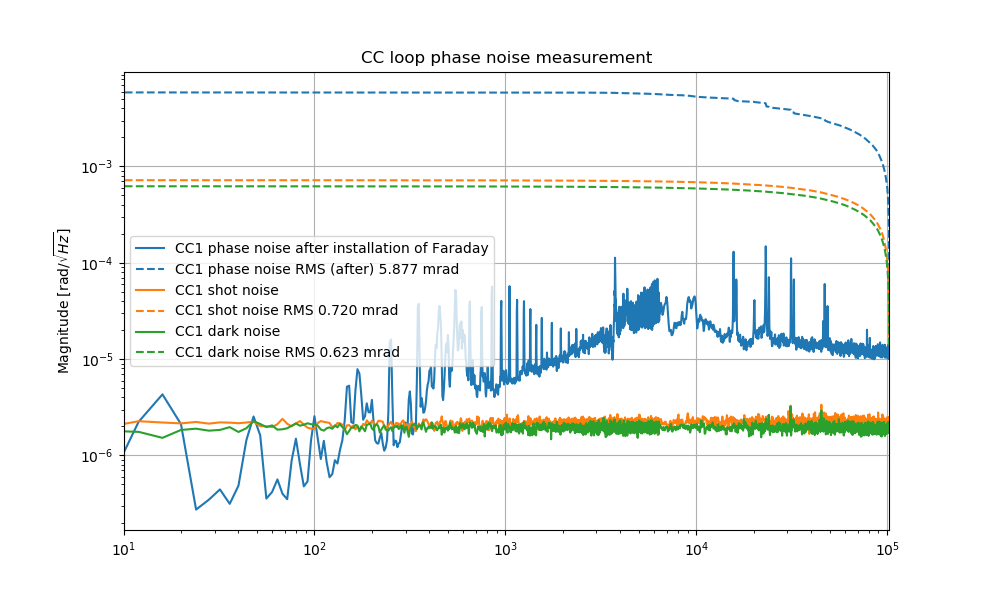
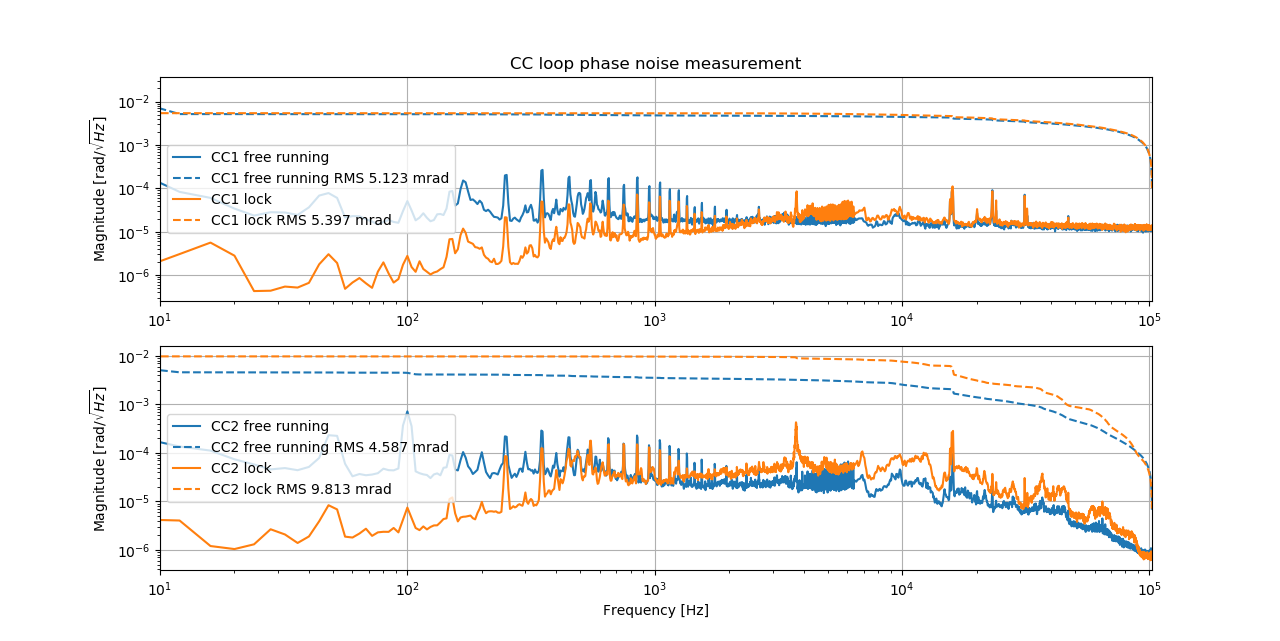
To see the effect of better isolation on phase noise, we measured the CC loop phase noise just before and after the replacement of the Faraday isolator.
The result is shown in the attached figure 1. From this measurement, we could see the CC2 loop phase noise is reduced by more than a factor of 2.
In entry 1432, we measured once the phase noise and PD dark noise. From that entry, we could that dark noise is very close to the phase noise level in the kHz region. We want to confirm the situation, so we did the measurement of dark noise and shot noise again. The dark noise is measured when there is no light arriving at PD, all the others are the same(including demodulator, RF amplifier). The shot noise is measured when there is light arriving at PD, but we made sure OPO is locked at the same time. Because if we don't lock OPO, the light arriving CC1 PD has some frequency component. Also, all the others are the same setting for the measurement of shot noise(including demodulator and RF amplifier).
The result of CC1 phase noise and dark/shot noise comparison is attached in the second figure. We could see that this time, phase noise is at least 5 times higher than dark/shot noise above 300Hz. I checked the code I wrote for entry 1432's measurement, and I found the measurement of dark noise is consistent with the nowadays measurement. This proves that the CC1 phase noise is larger than before. Why the phase noise is higher now is still unknown.
Pengbo, Simon
Yesterday, we started mapping the birefingence distribution of the (yet) unknown Shinkosha substrate which turned out to have coated surfaces (apparently both HR and AR).
As reported already, due to this issue, we cannot do a quantized analysis regarding the polarization angle.
Therefore, I present here just the ratio of the S and P polarized fields which should resemble the basic distribution in any case.
As can be seen, we have a very structured map which looks like the spider-web structure we know already from Shinkosha#7 sample. In addition, we got a lot of spots with some exaggerated measurement values. Those are most likely due to the coatings and represent defects.
According to the spec sheet, the diffraction efficiency of AOM is 87.7% at 1060nm and 500um beam diameter with 1.50W RF power.
This morning, I tweaked the STMs to increase the diffracted beam power.
However the diffraction efficiency was about 50%.
I'm suspecting the beam diameter is so small that the efficiency is low.
Since I have another double-pass AOM, I will input larger diameter beam to another AOM and see the effect of beam diameter on efficiency.
Also I will check the RF power.
This entry is just a log of Today's work.
I am revising the design of folded cavity spacer.
The company will come to NAOJ on next Tuesday and I will order the spacer with final design.
After that I will upload the drawings on GWSPwiki.
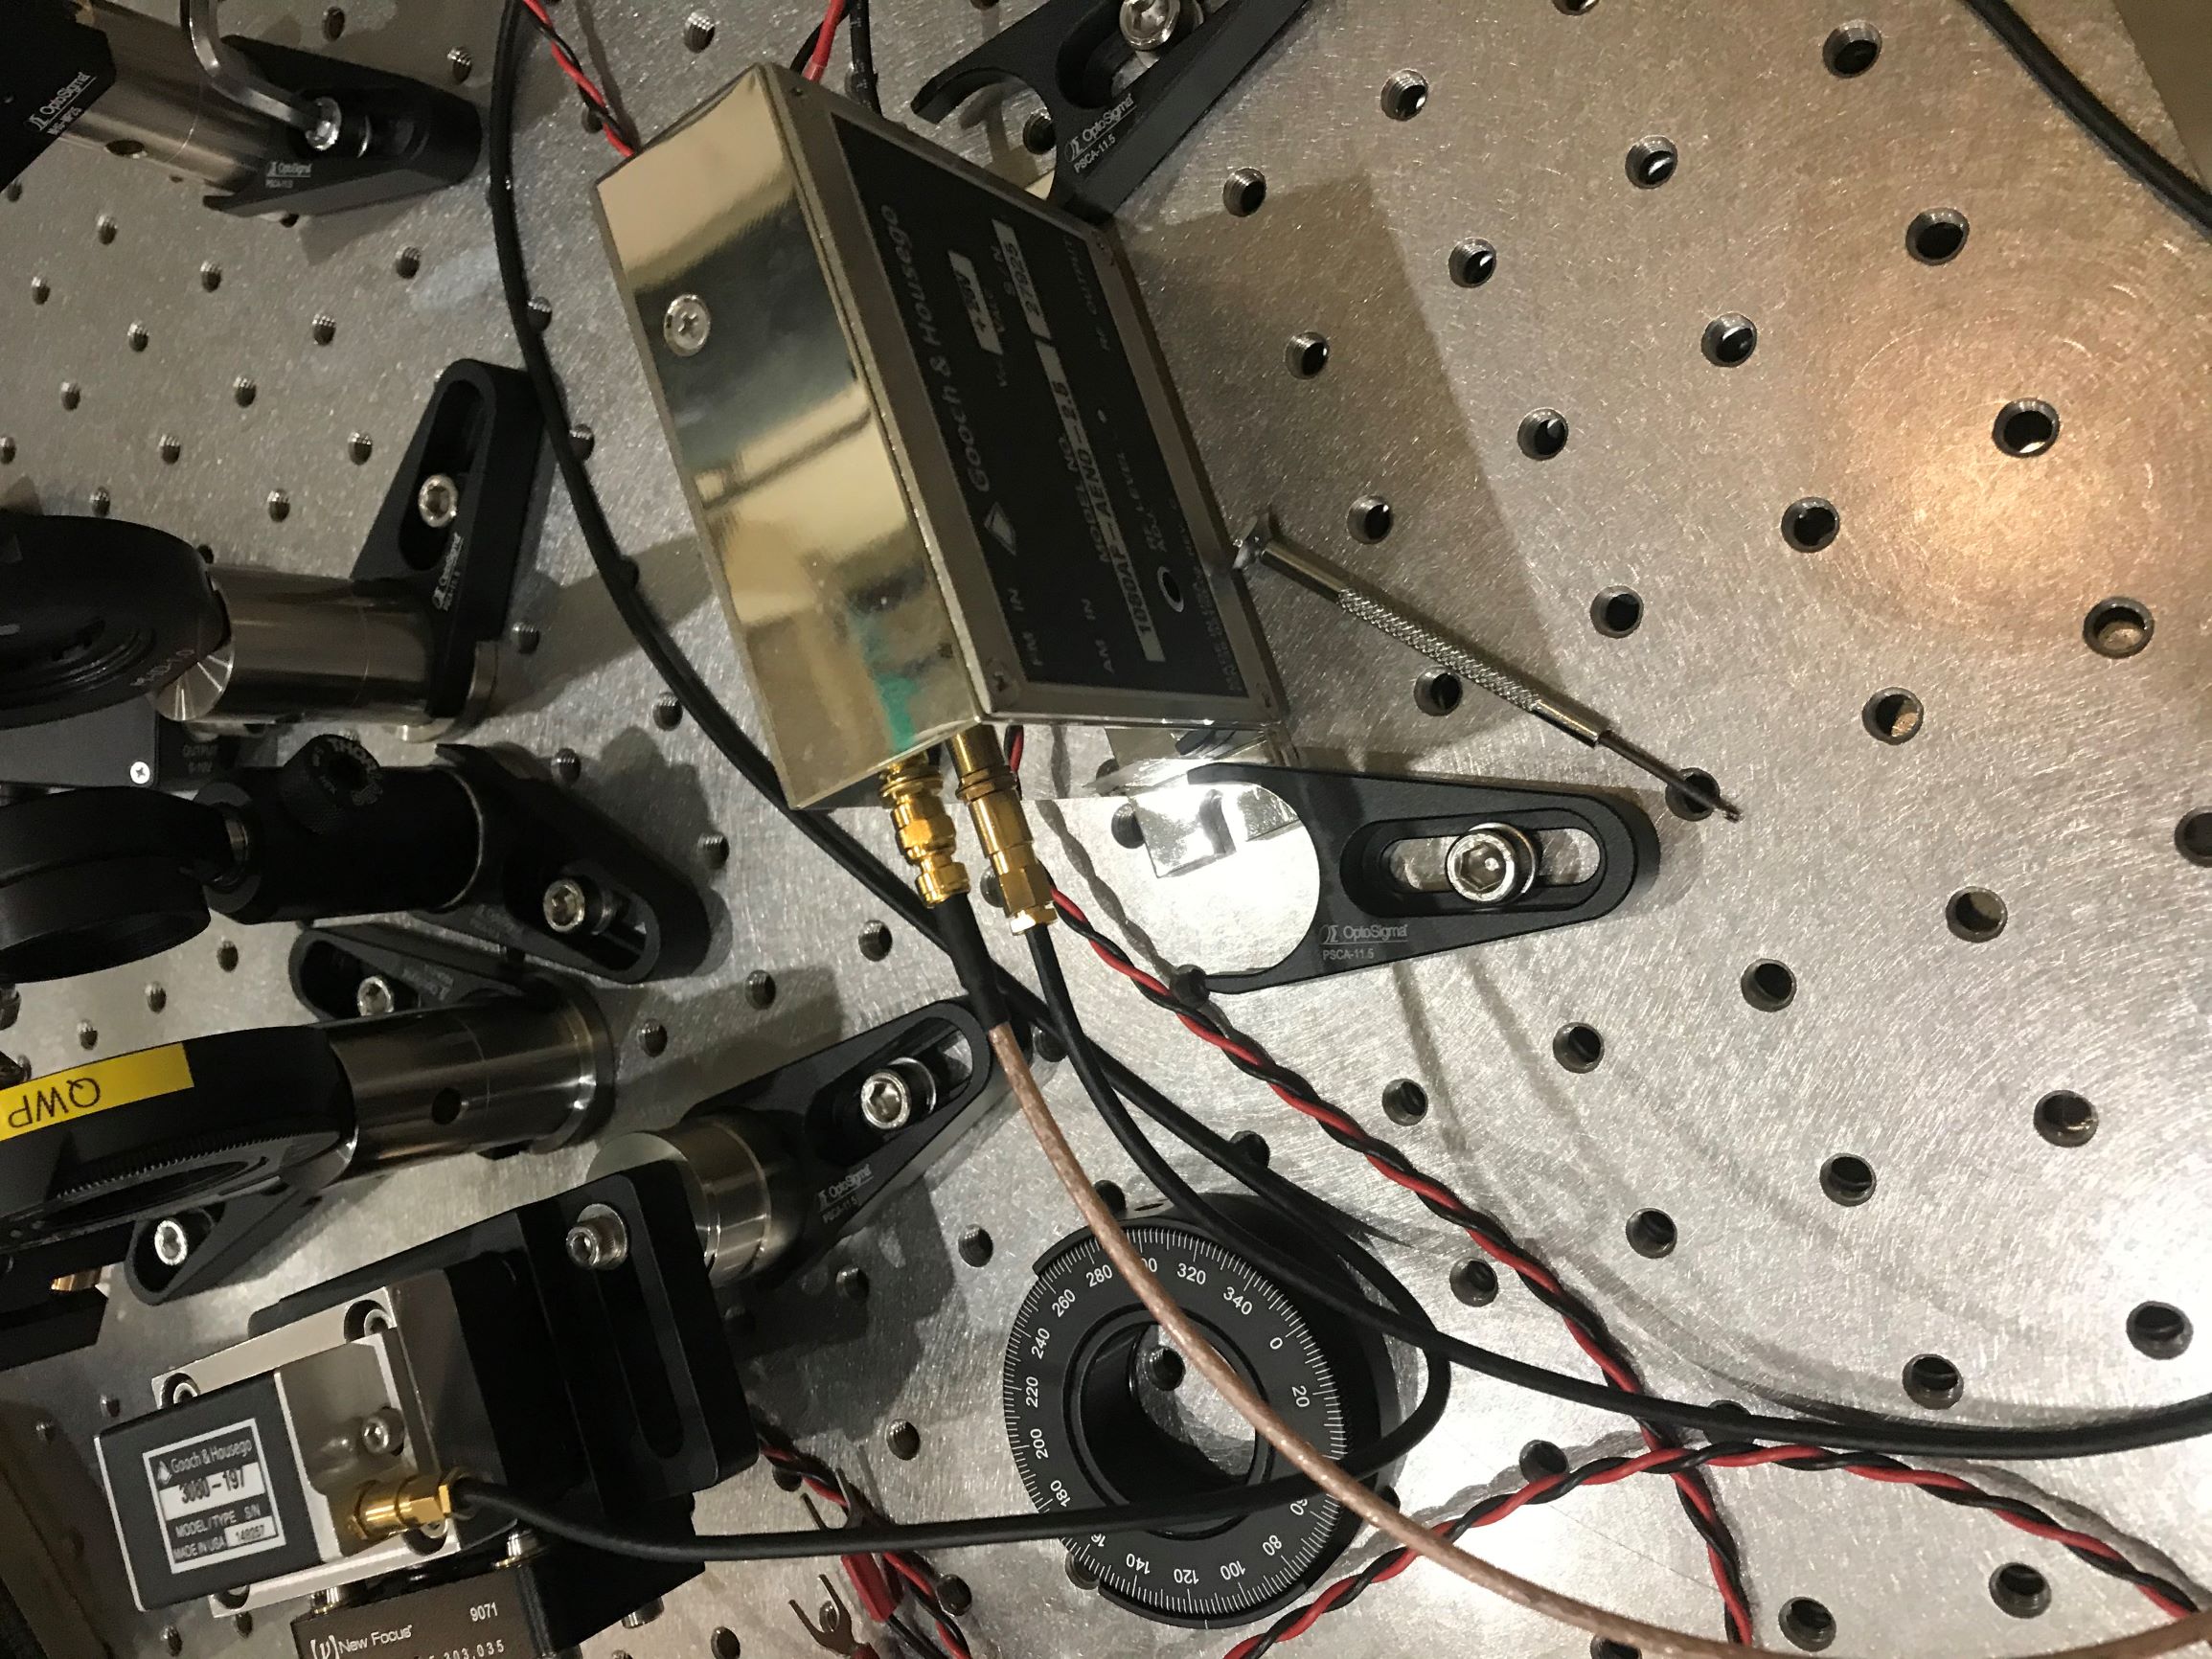
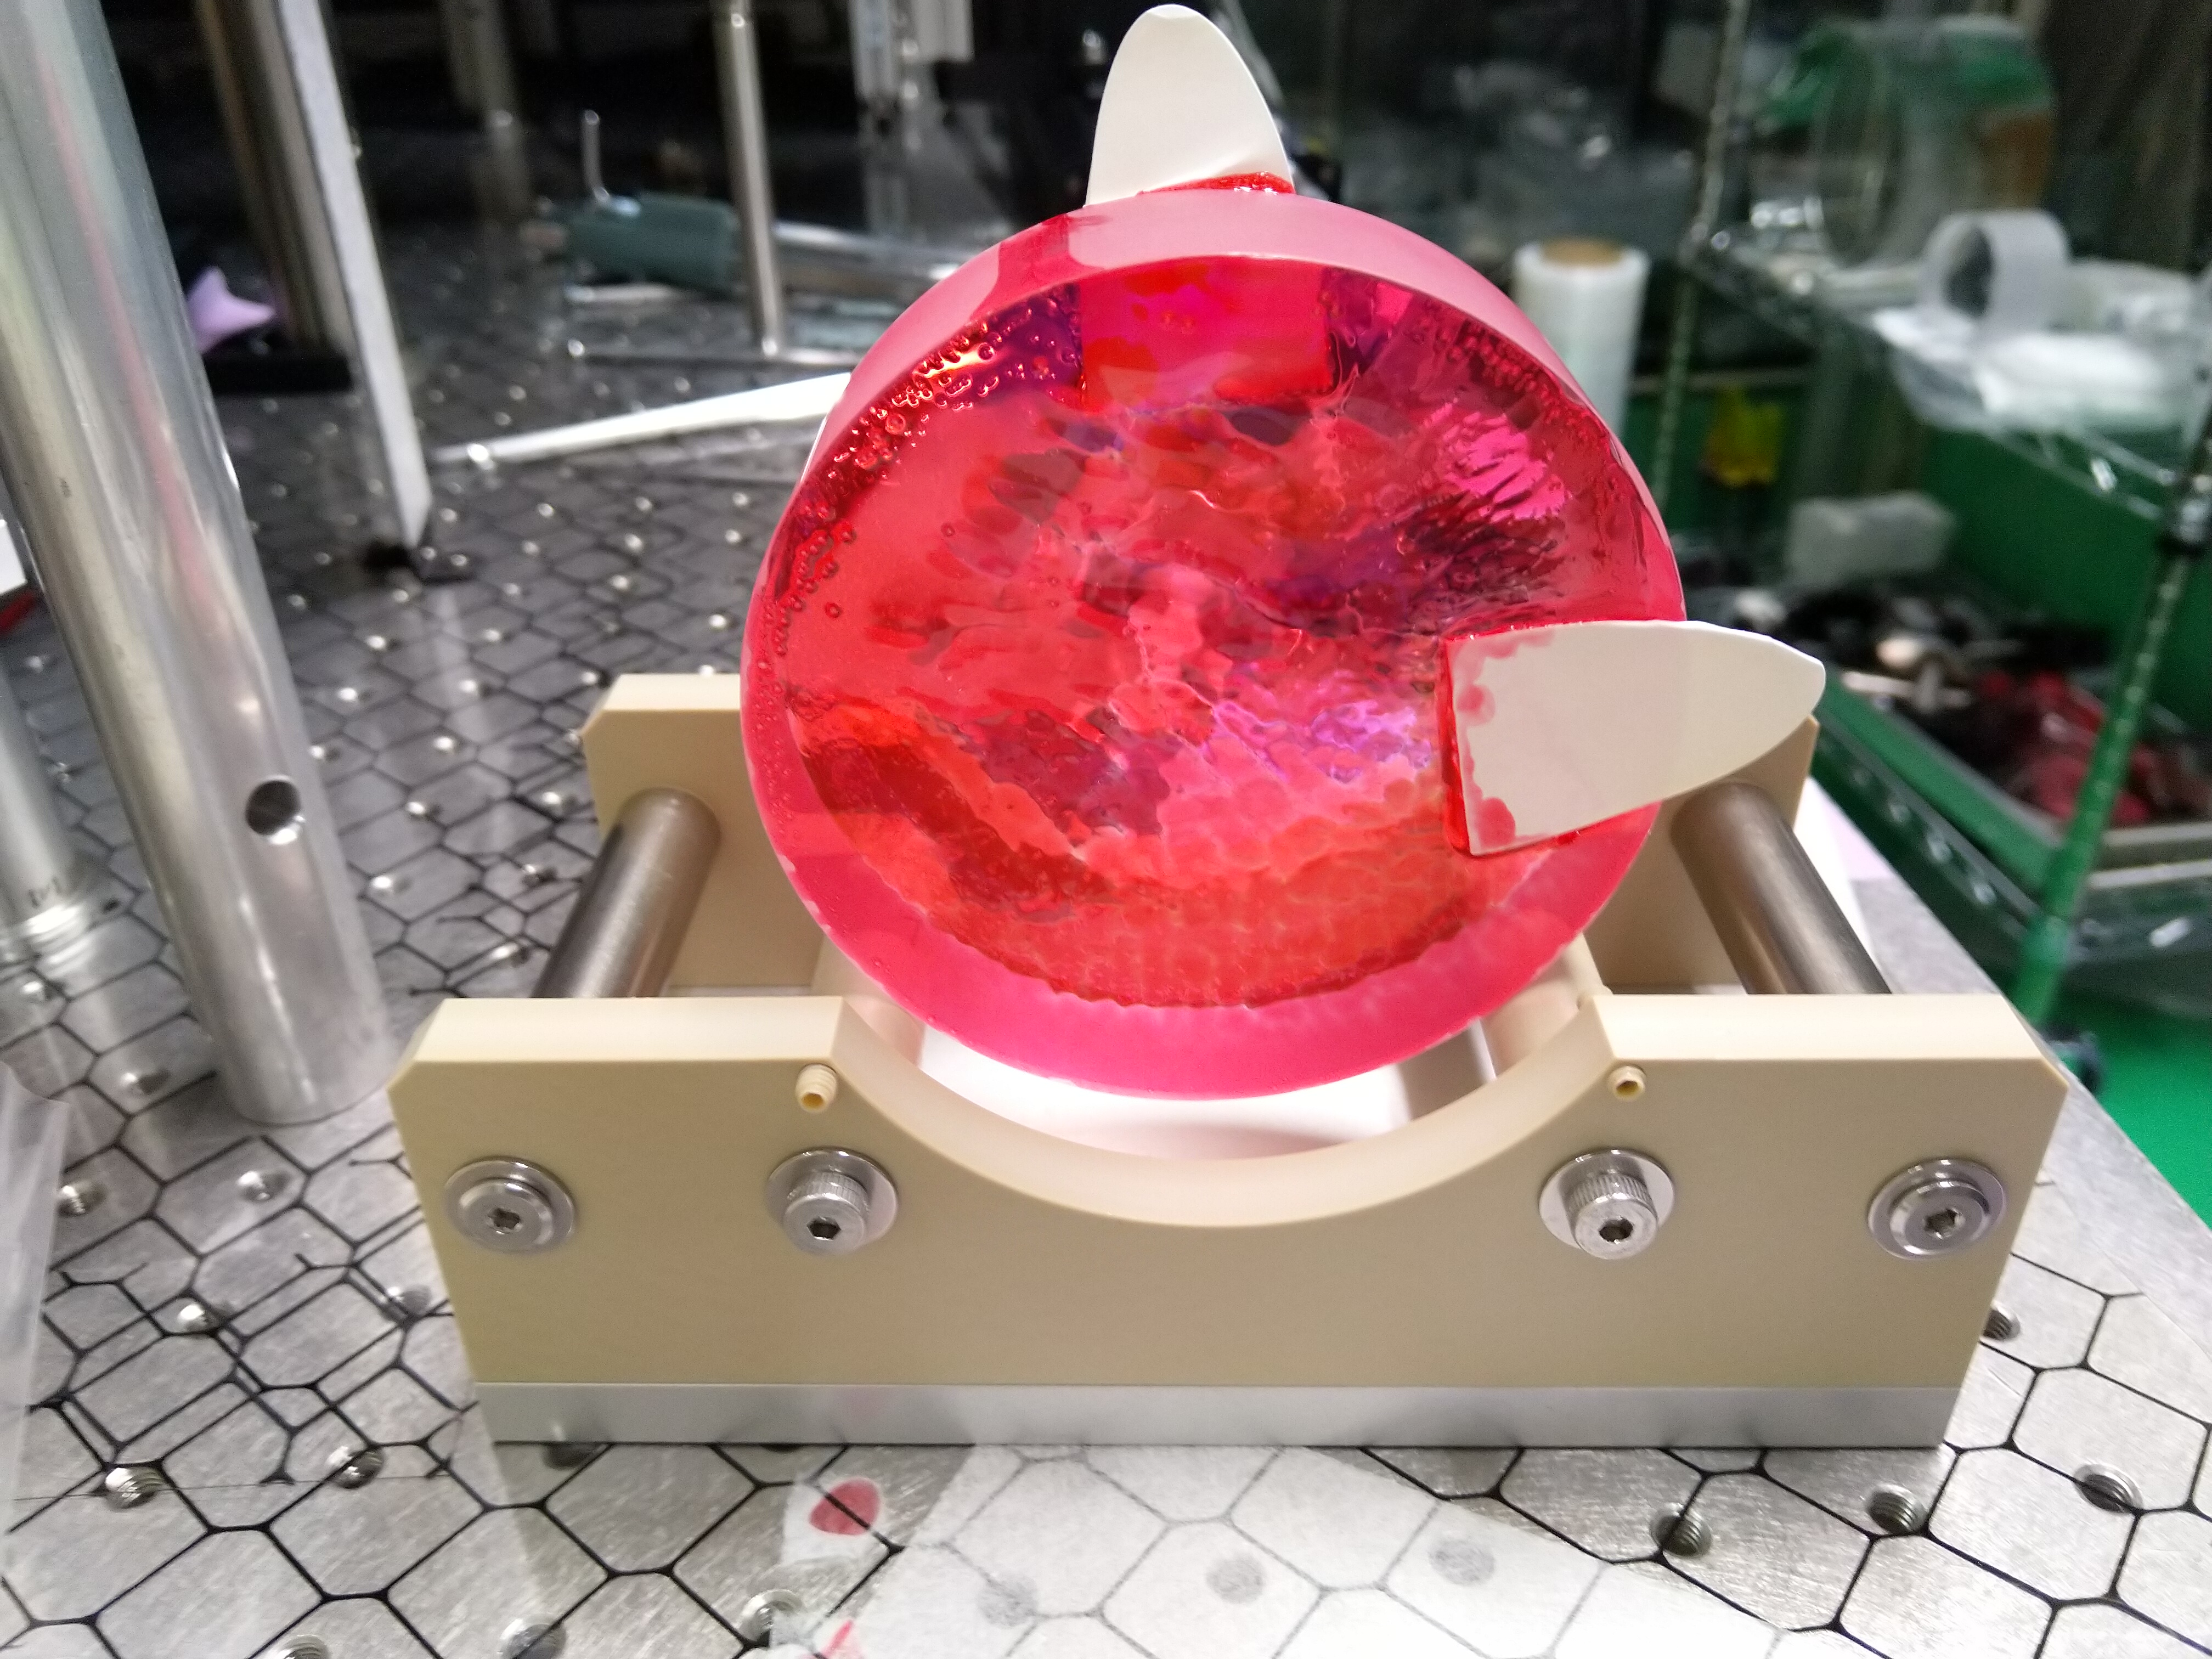
[Aritomi, Yuhang and Yao-Chin]
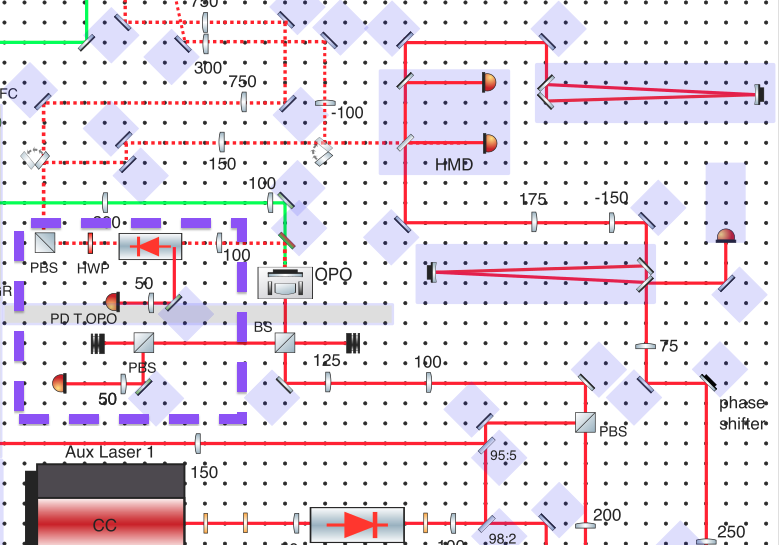
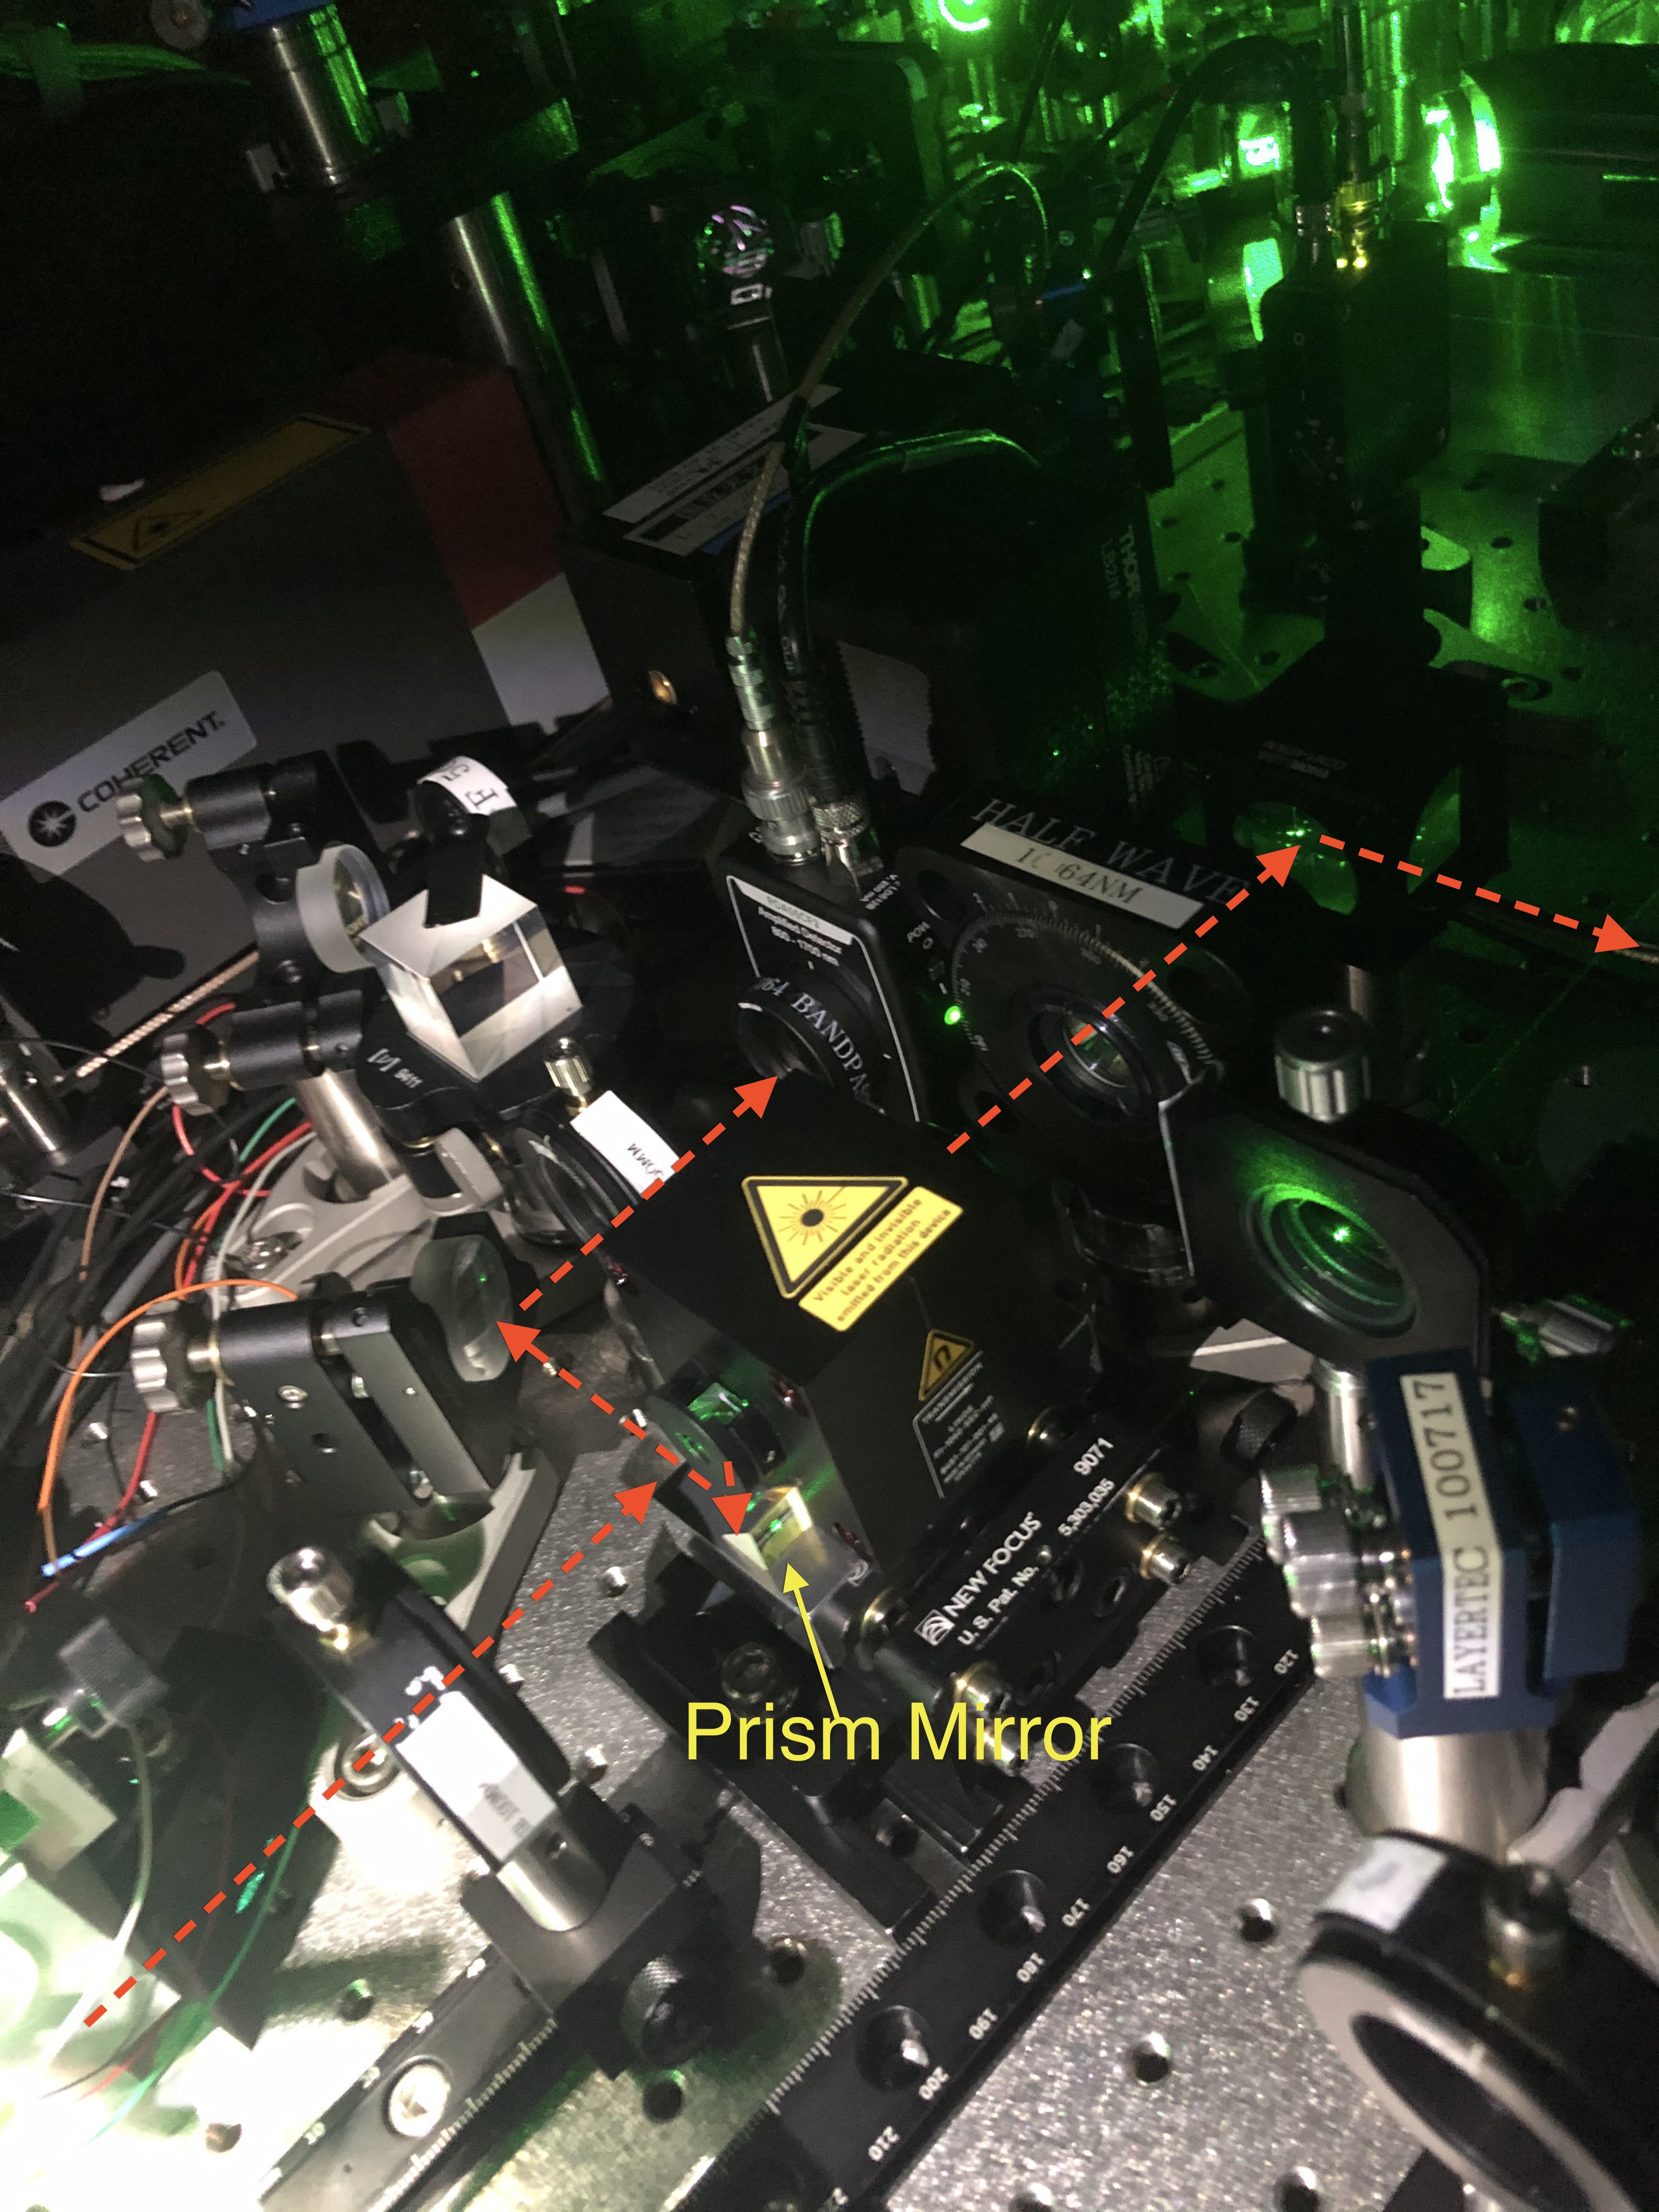
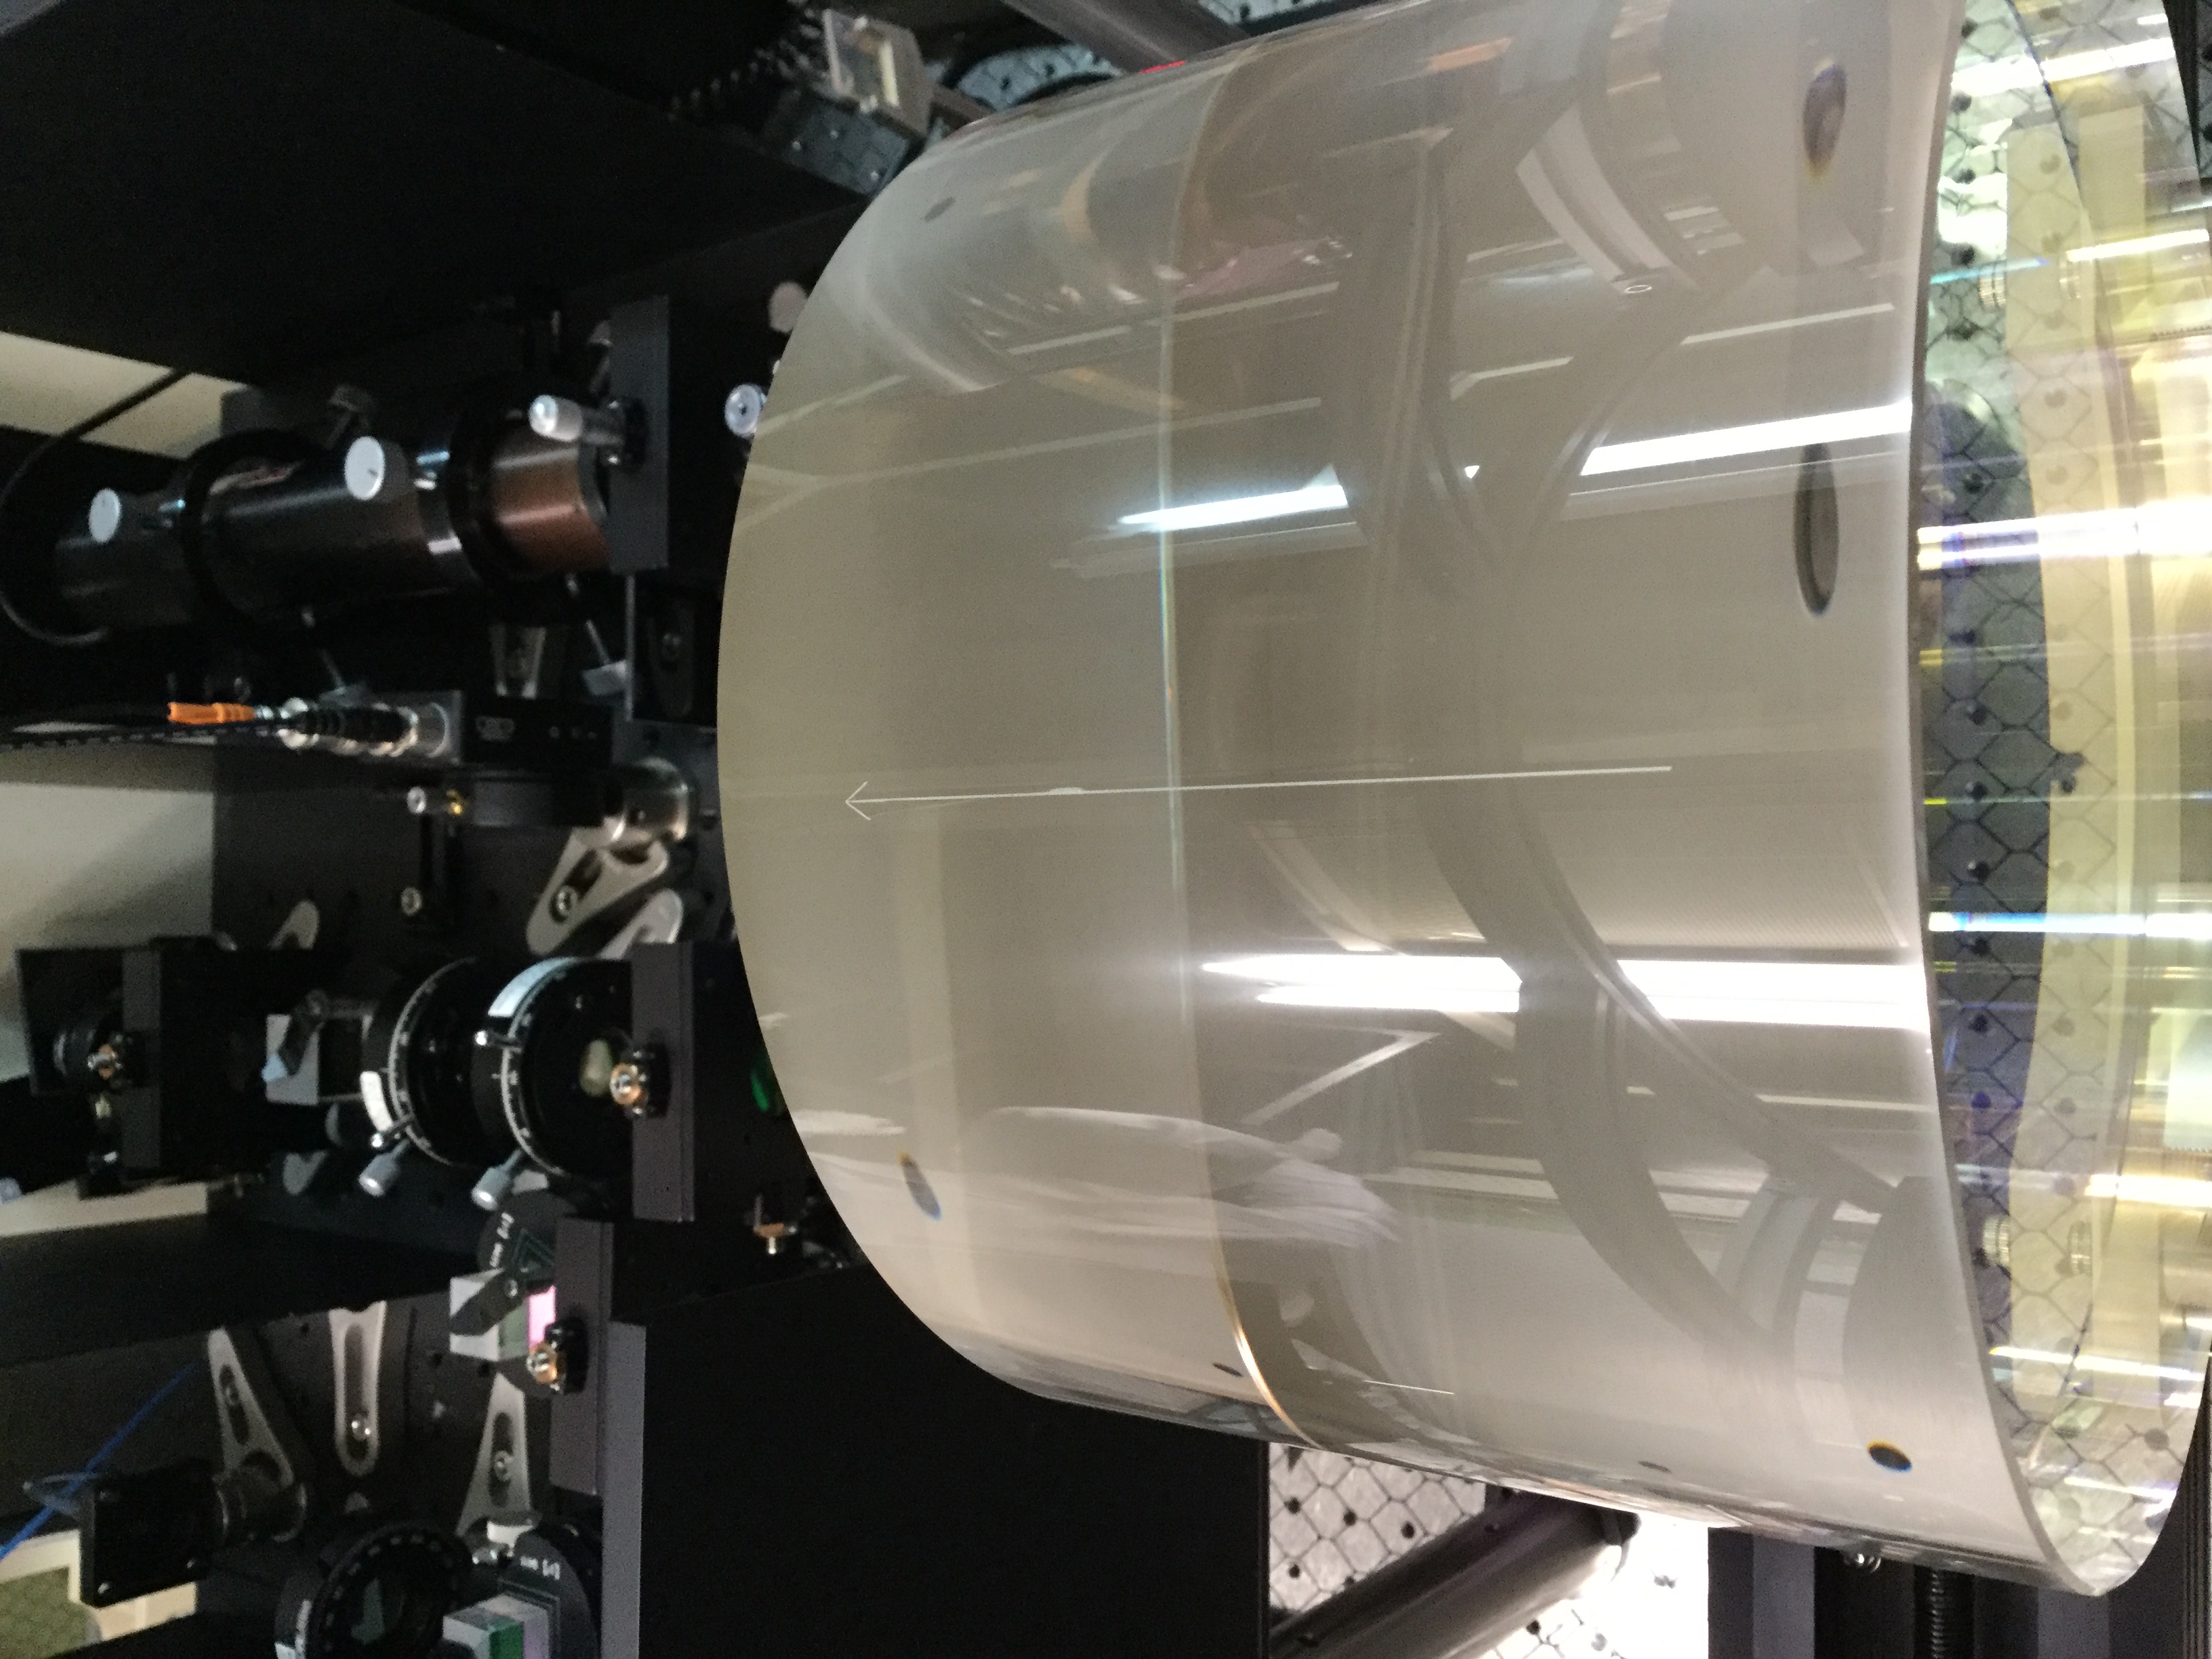
According to the previous R&D result (entry 1616), we found some issues for old isolator (IO-3-1064-VHP) including its aperture size too small and position too far relative to OPO cavity. Today, we installed isolator (FI-1060-5SC-HP) and put closer to OPO cavity to reduce back reflection. I also checked that the input/output aperture (Ø-5mm) of isolator was larger than old isolator. Fig 1 shows new optical layout. We main installed optical elements in blue frame zone.
Because SQZ and p-pol light were different polarization after OPO cavity, we could use PBS to separate them. Thus, the p-pol light is reflected from input PBS of isolator to right angle prism mirror (MRA10-K13) and its height was 54mm as shown in Fig 2. However, the polarization of SQZ light was rotated 45 degree after isolator. We used half wave plate to rotate its polarization keeping S polarization. In addition, we also re-installed the TAMA PD's position in order to add more space putting isolator.
We also check SQZ and LO overlap by using alignment mode cleaner, moving the lens (f:100mm) before isolator to improve mode matching.
[Aritomi, Yuhang, Yaochin]
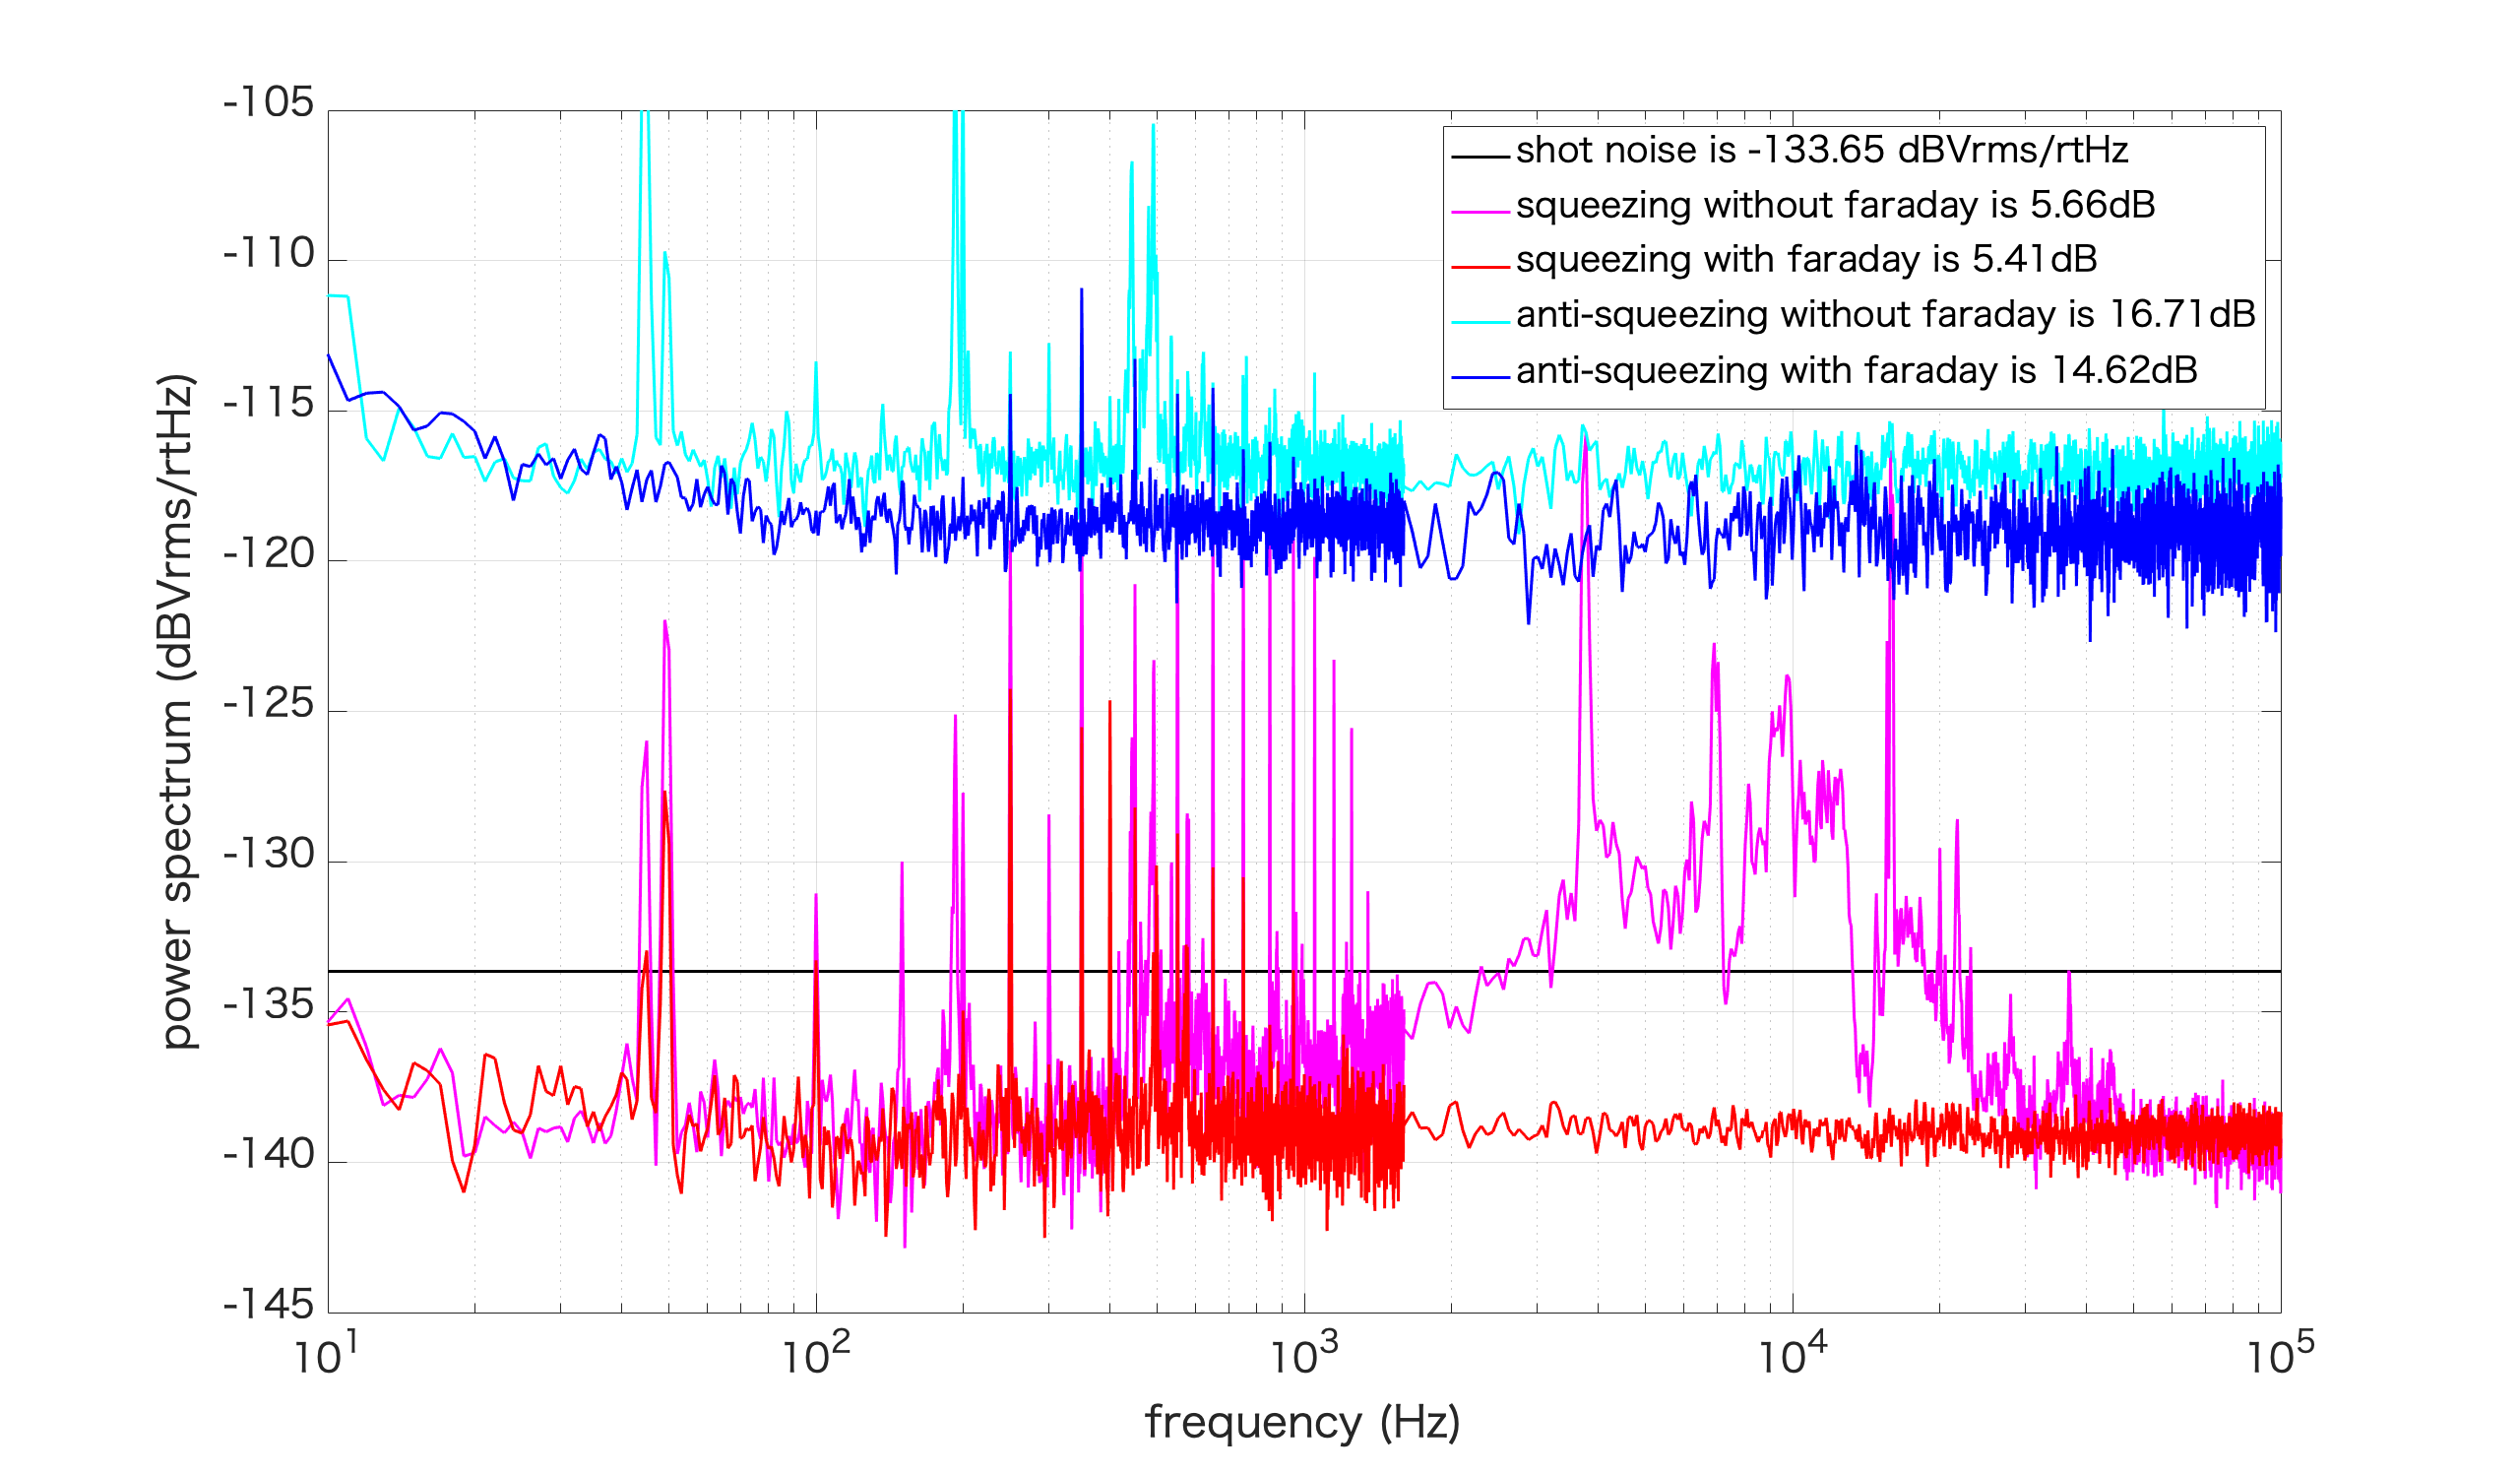
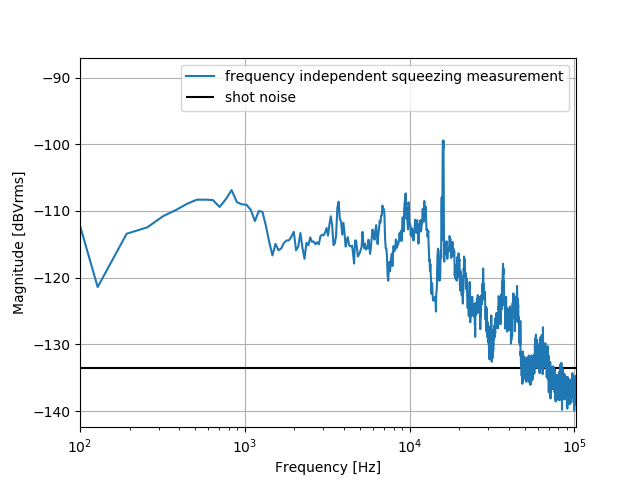
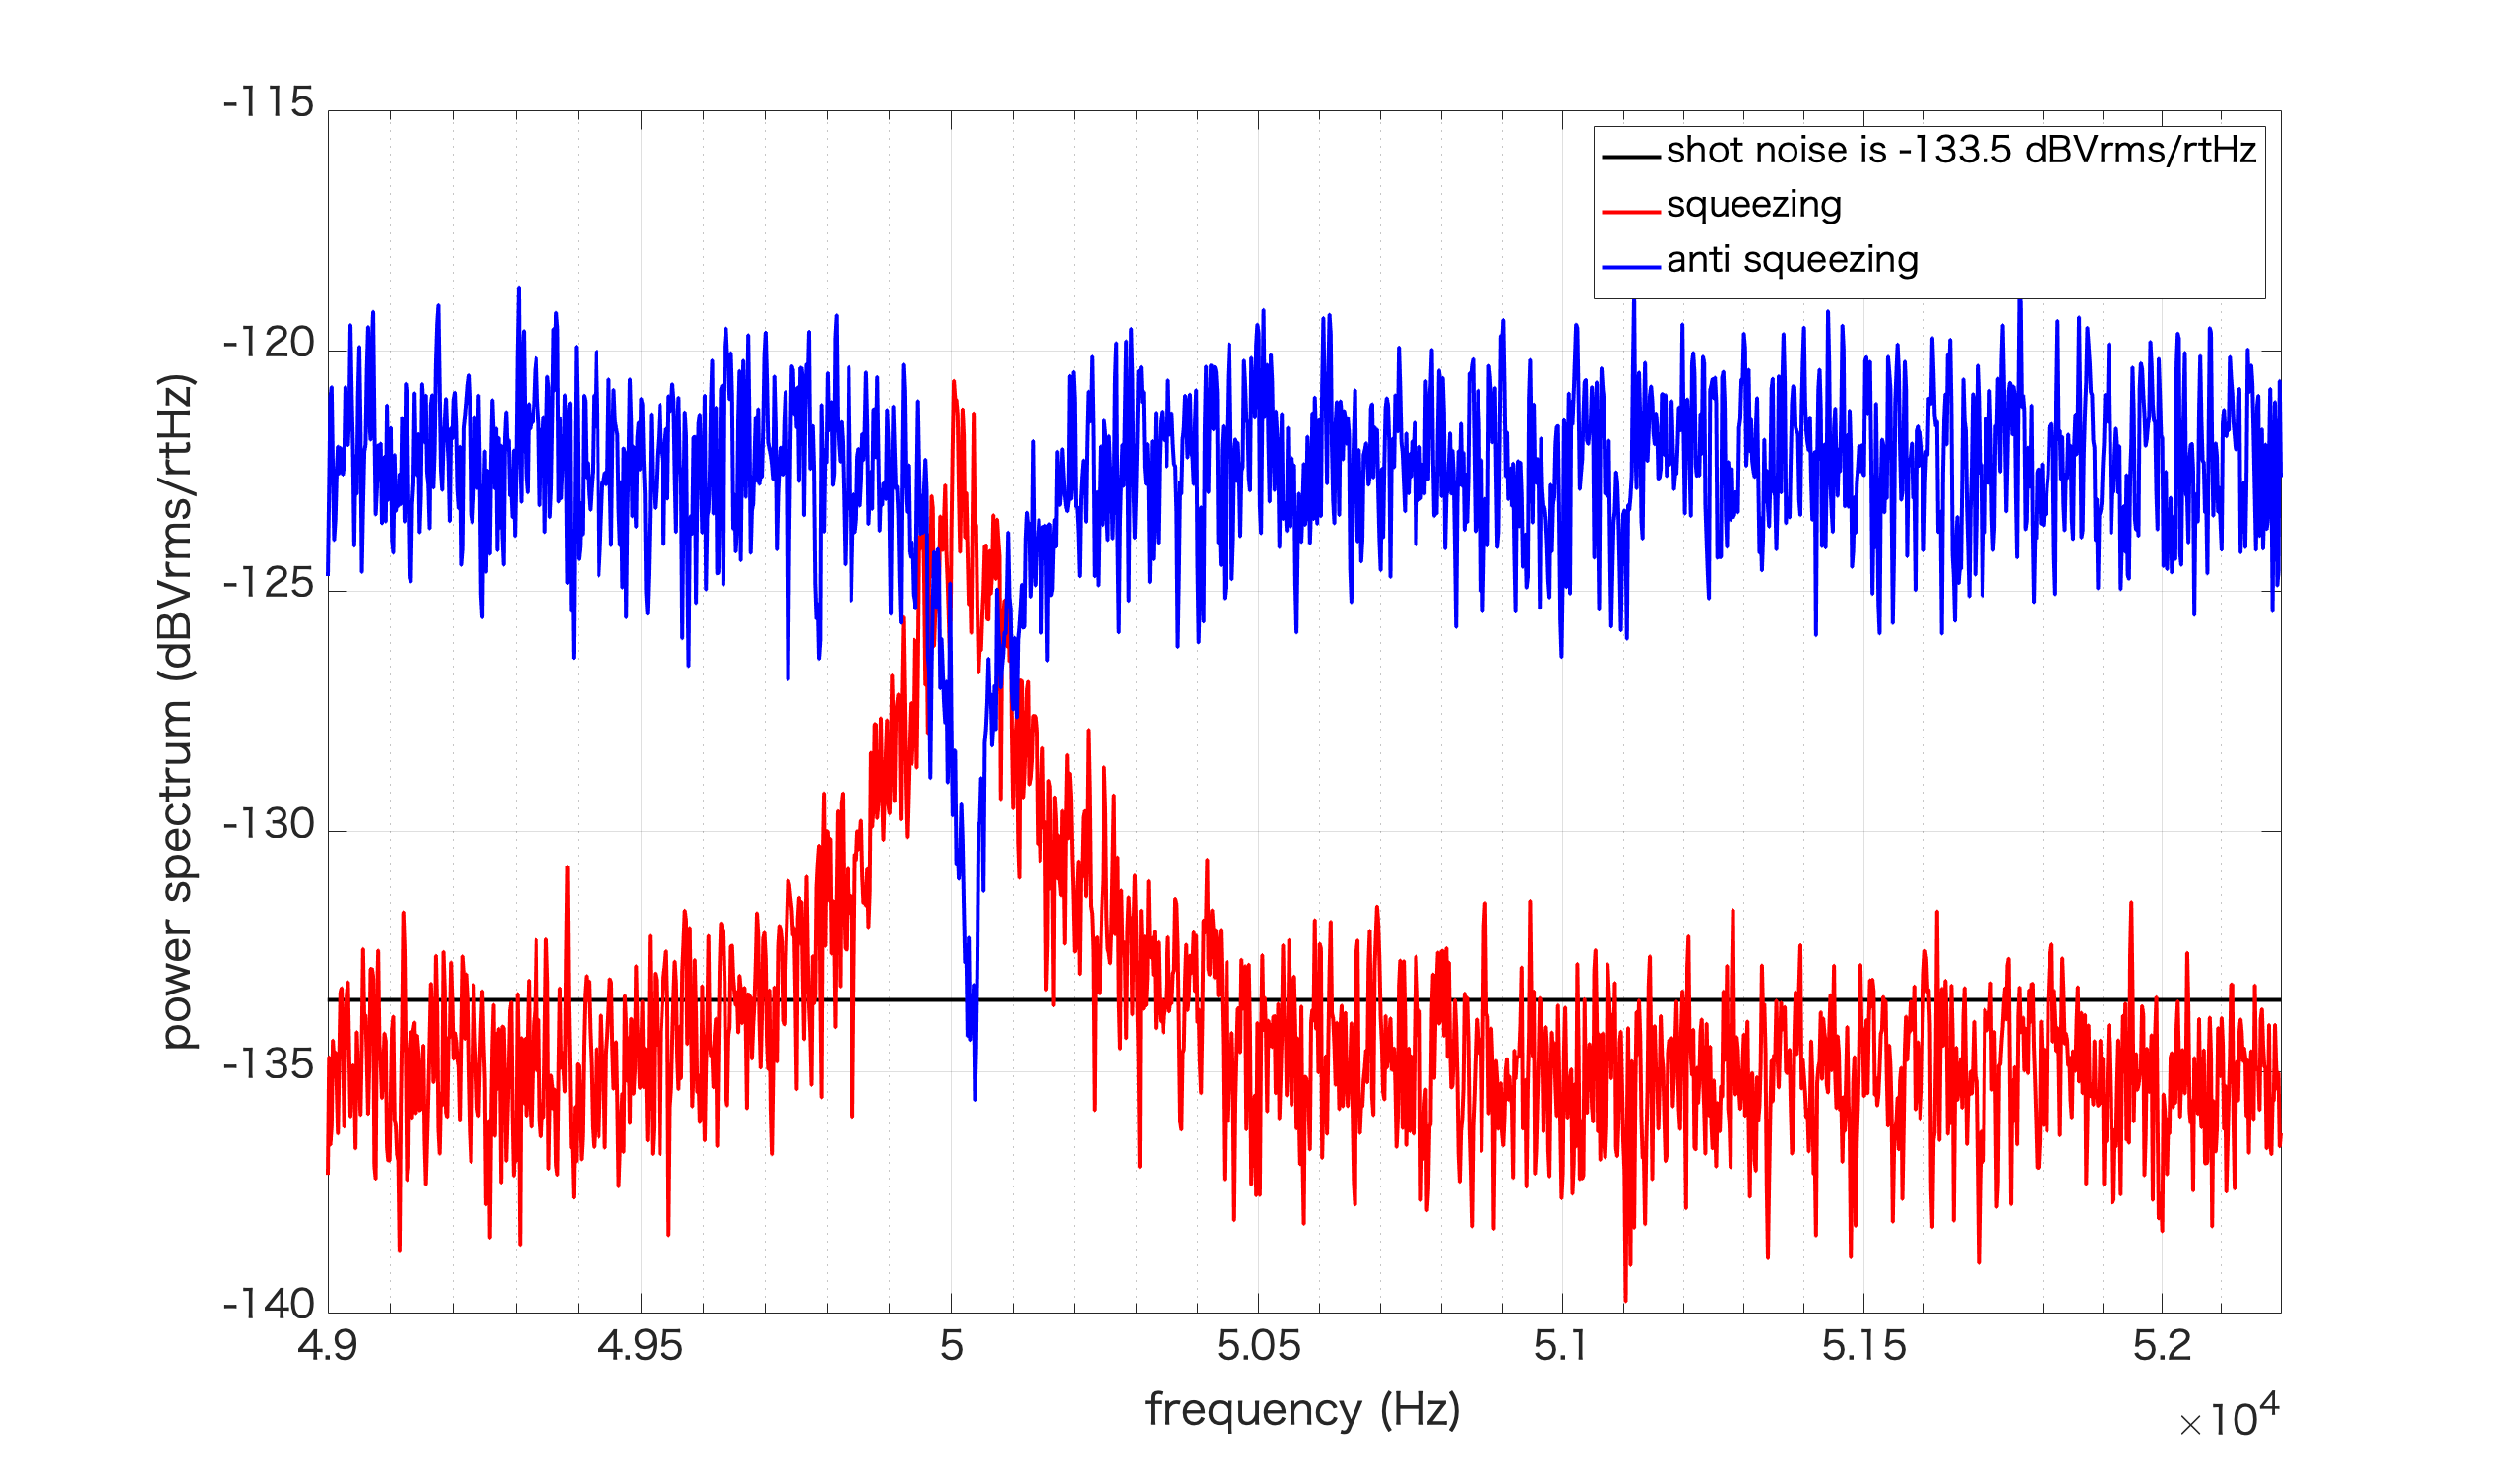
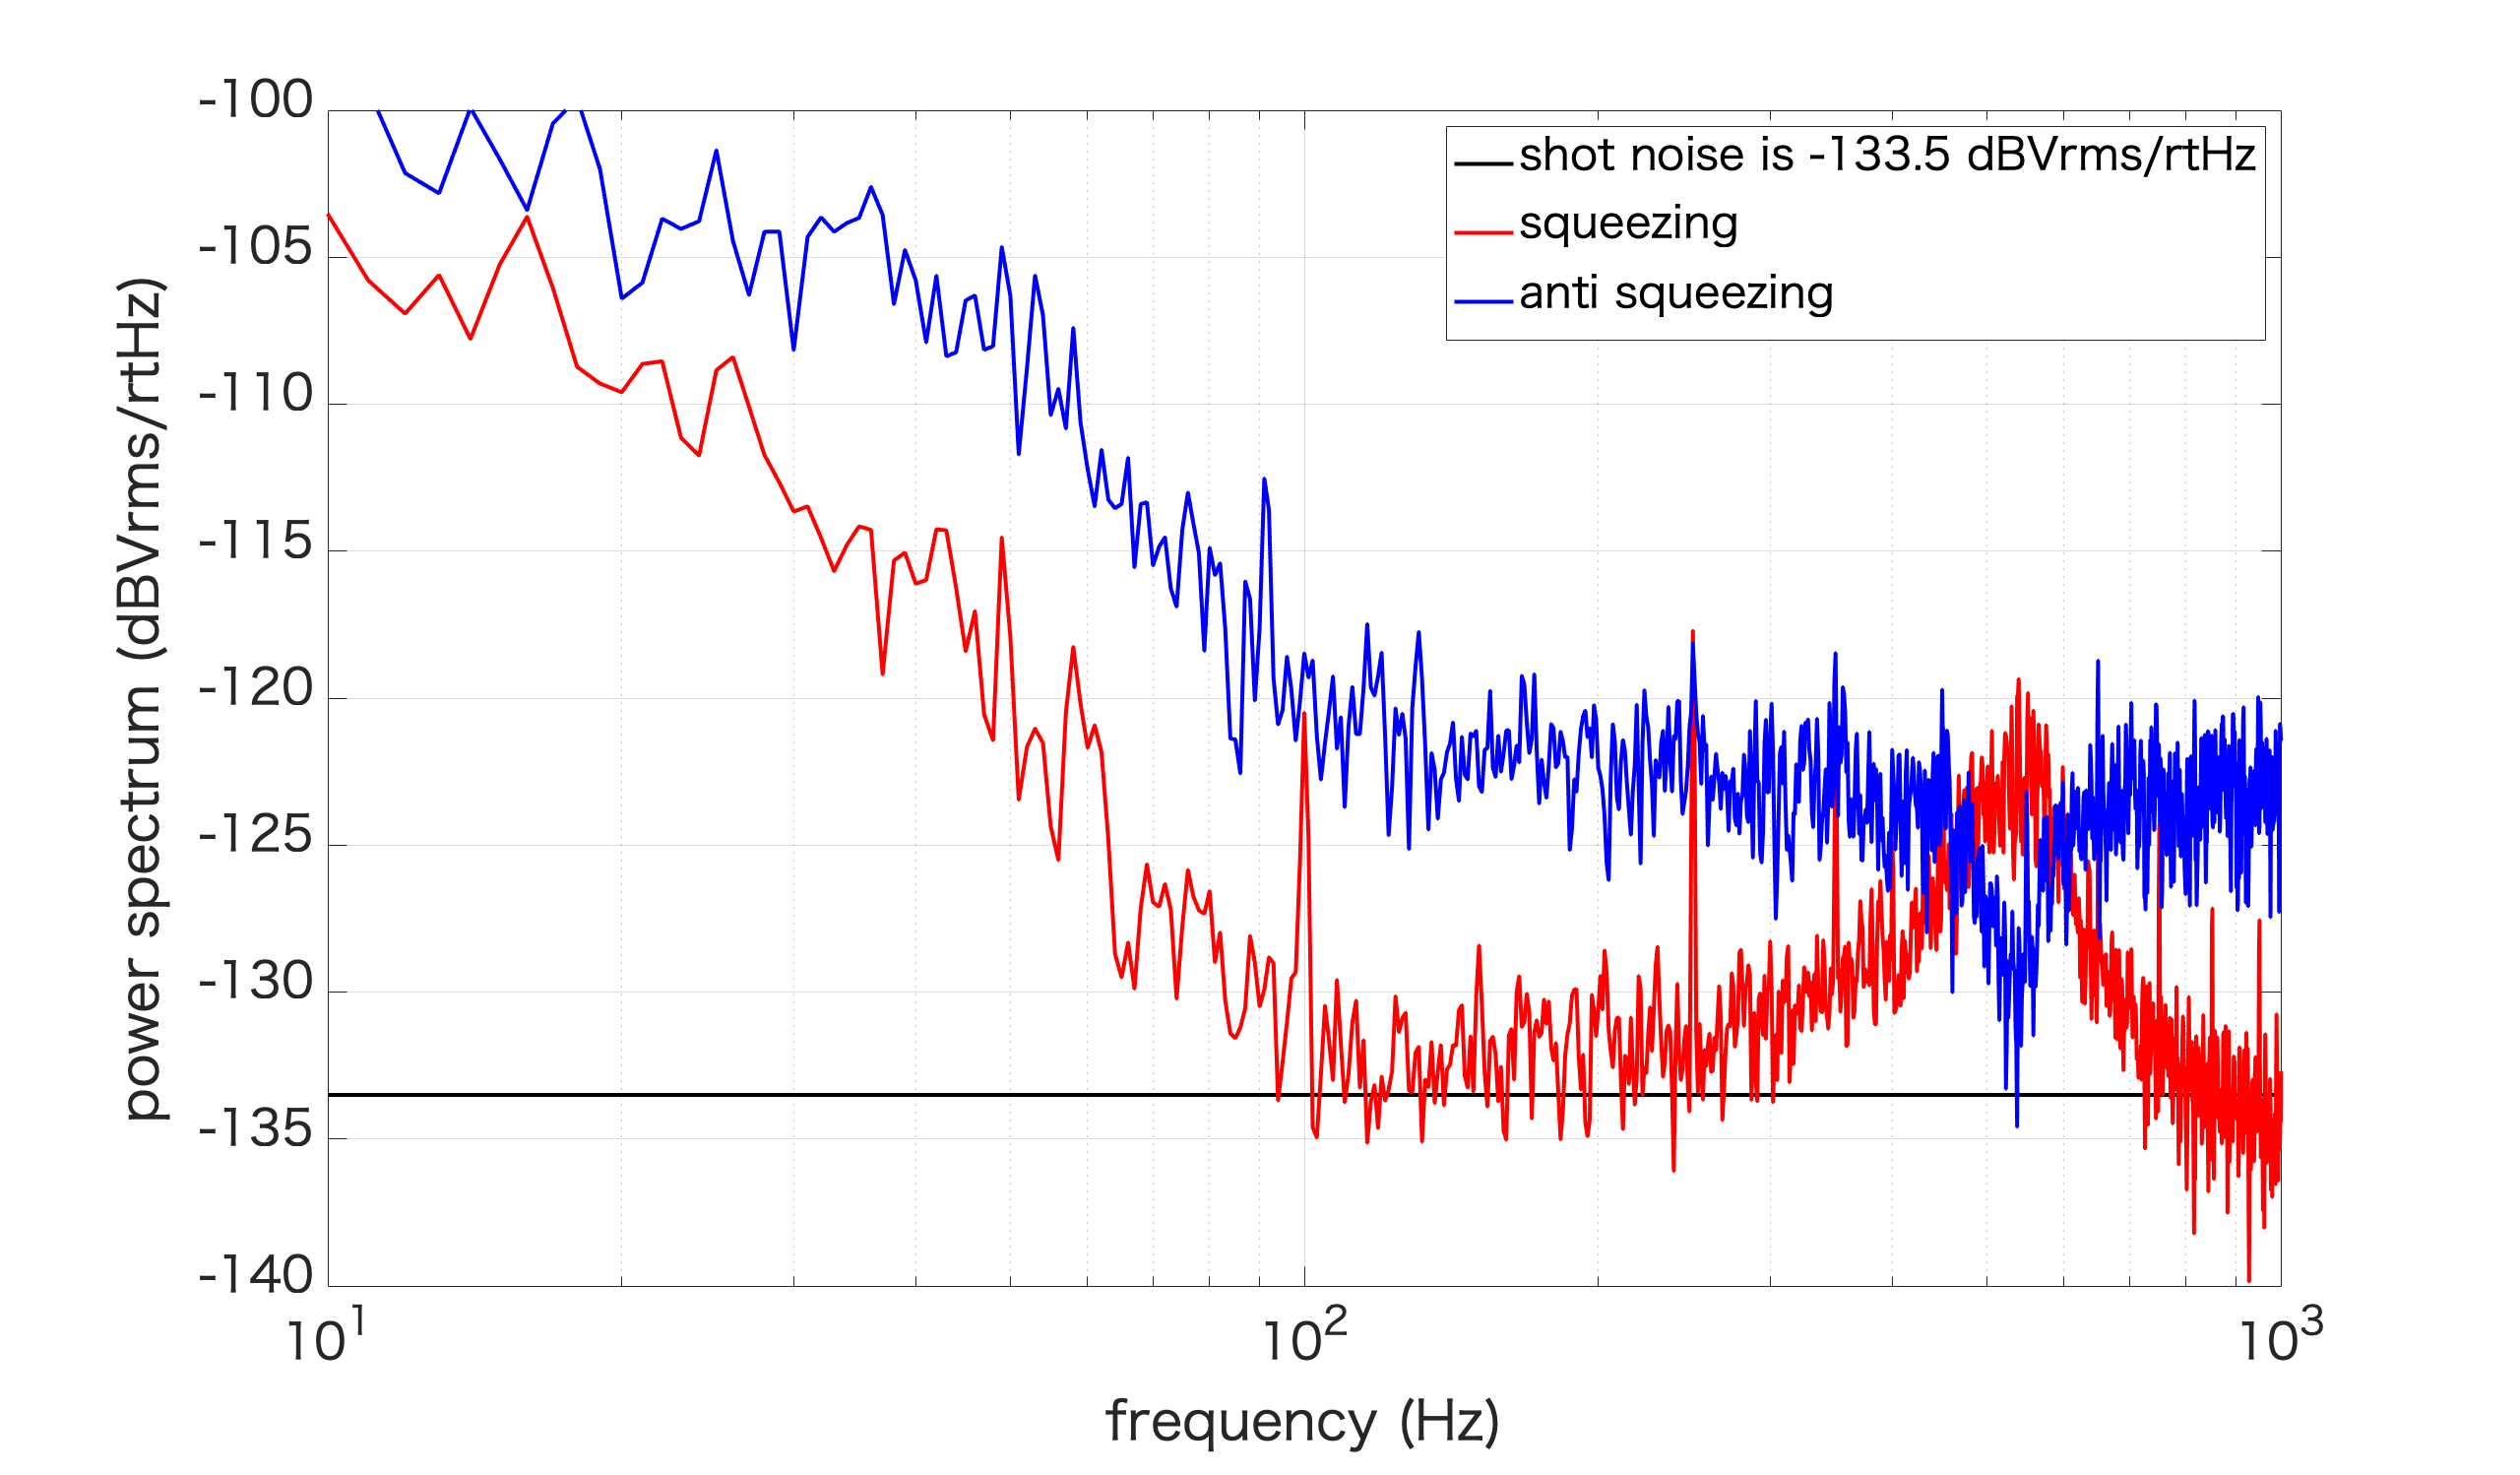
Today we installed new faraday (FI-1060-5SC-HP) between OPO and PBS to reduce back reflection from homodyne. Yaochin will report the detail. We measured frequency independent squeezing before/after installation of faraday. CC2 demodulation phase is as follows.
| CC2 demodulation phase for squeezing (deg) | CC2 demodulation phase for anti squeezing (deg) | |
| without faraday | 90 | 132 |
| with faraday | 105 | 155 |
Attached picture shows squeezing and anti squeezing spectrum with/without faraday. After installation of faraday, squeezing spectrum got amazingly better. Yuhang will report the phase noise measurement.
Today I worked on the alignment for AOM.
The following is the procedure what I did.
- Adjusted the lens position before AOM in order to locate the beam waist around the AOM.
- Played with STMs and AOM stage and maximized diffracted beam power.
-
Then adjusted RF level to maximize diffracted beam power.
At that moment, the beam power input to AOM was 8.6mW and that of diffracted beam was 4.6mW.
So the efficiency was about 55%. - Then put a lens after the AOM to make collimated beam.
- Put an iris to eliminate 0 order diffracted beam and pick -1st order one.
- Put a mirror to make the reflection beam enter the AOM again.
- Played with the end mirror to see the double-passed 1st order diffracted beam.
-
Eventually I found 2 beams are picked off by PBS.
One is 0 order double-passed beam and the another is -1st order double-passed one.
I mean the former one is frequency shifted only once, and the latter one is shifted twice. - Measured the double-passed beam power and it was 2mW.
Double-passed beam has the same beam path as input beam.
I think this may be reasonable for double-pass AOM configuration.
I think the next step is to optimize the alignment to maximize double-passed beam and minimize the beam jitter.
Also I should check the spec sheet to confirm the diffraction efficiency and estimate the requirement for beam jitter.
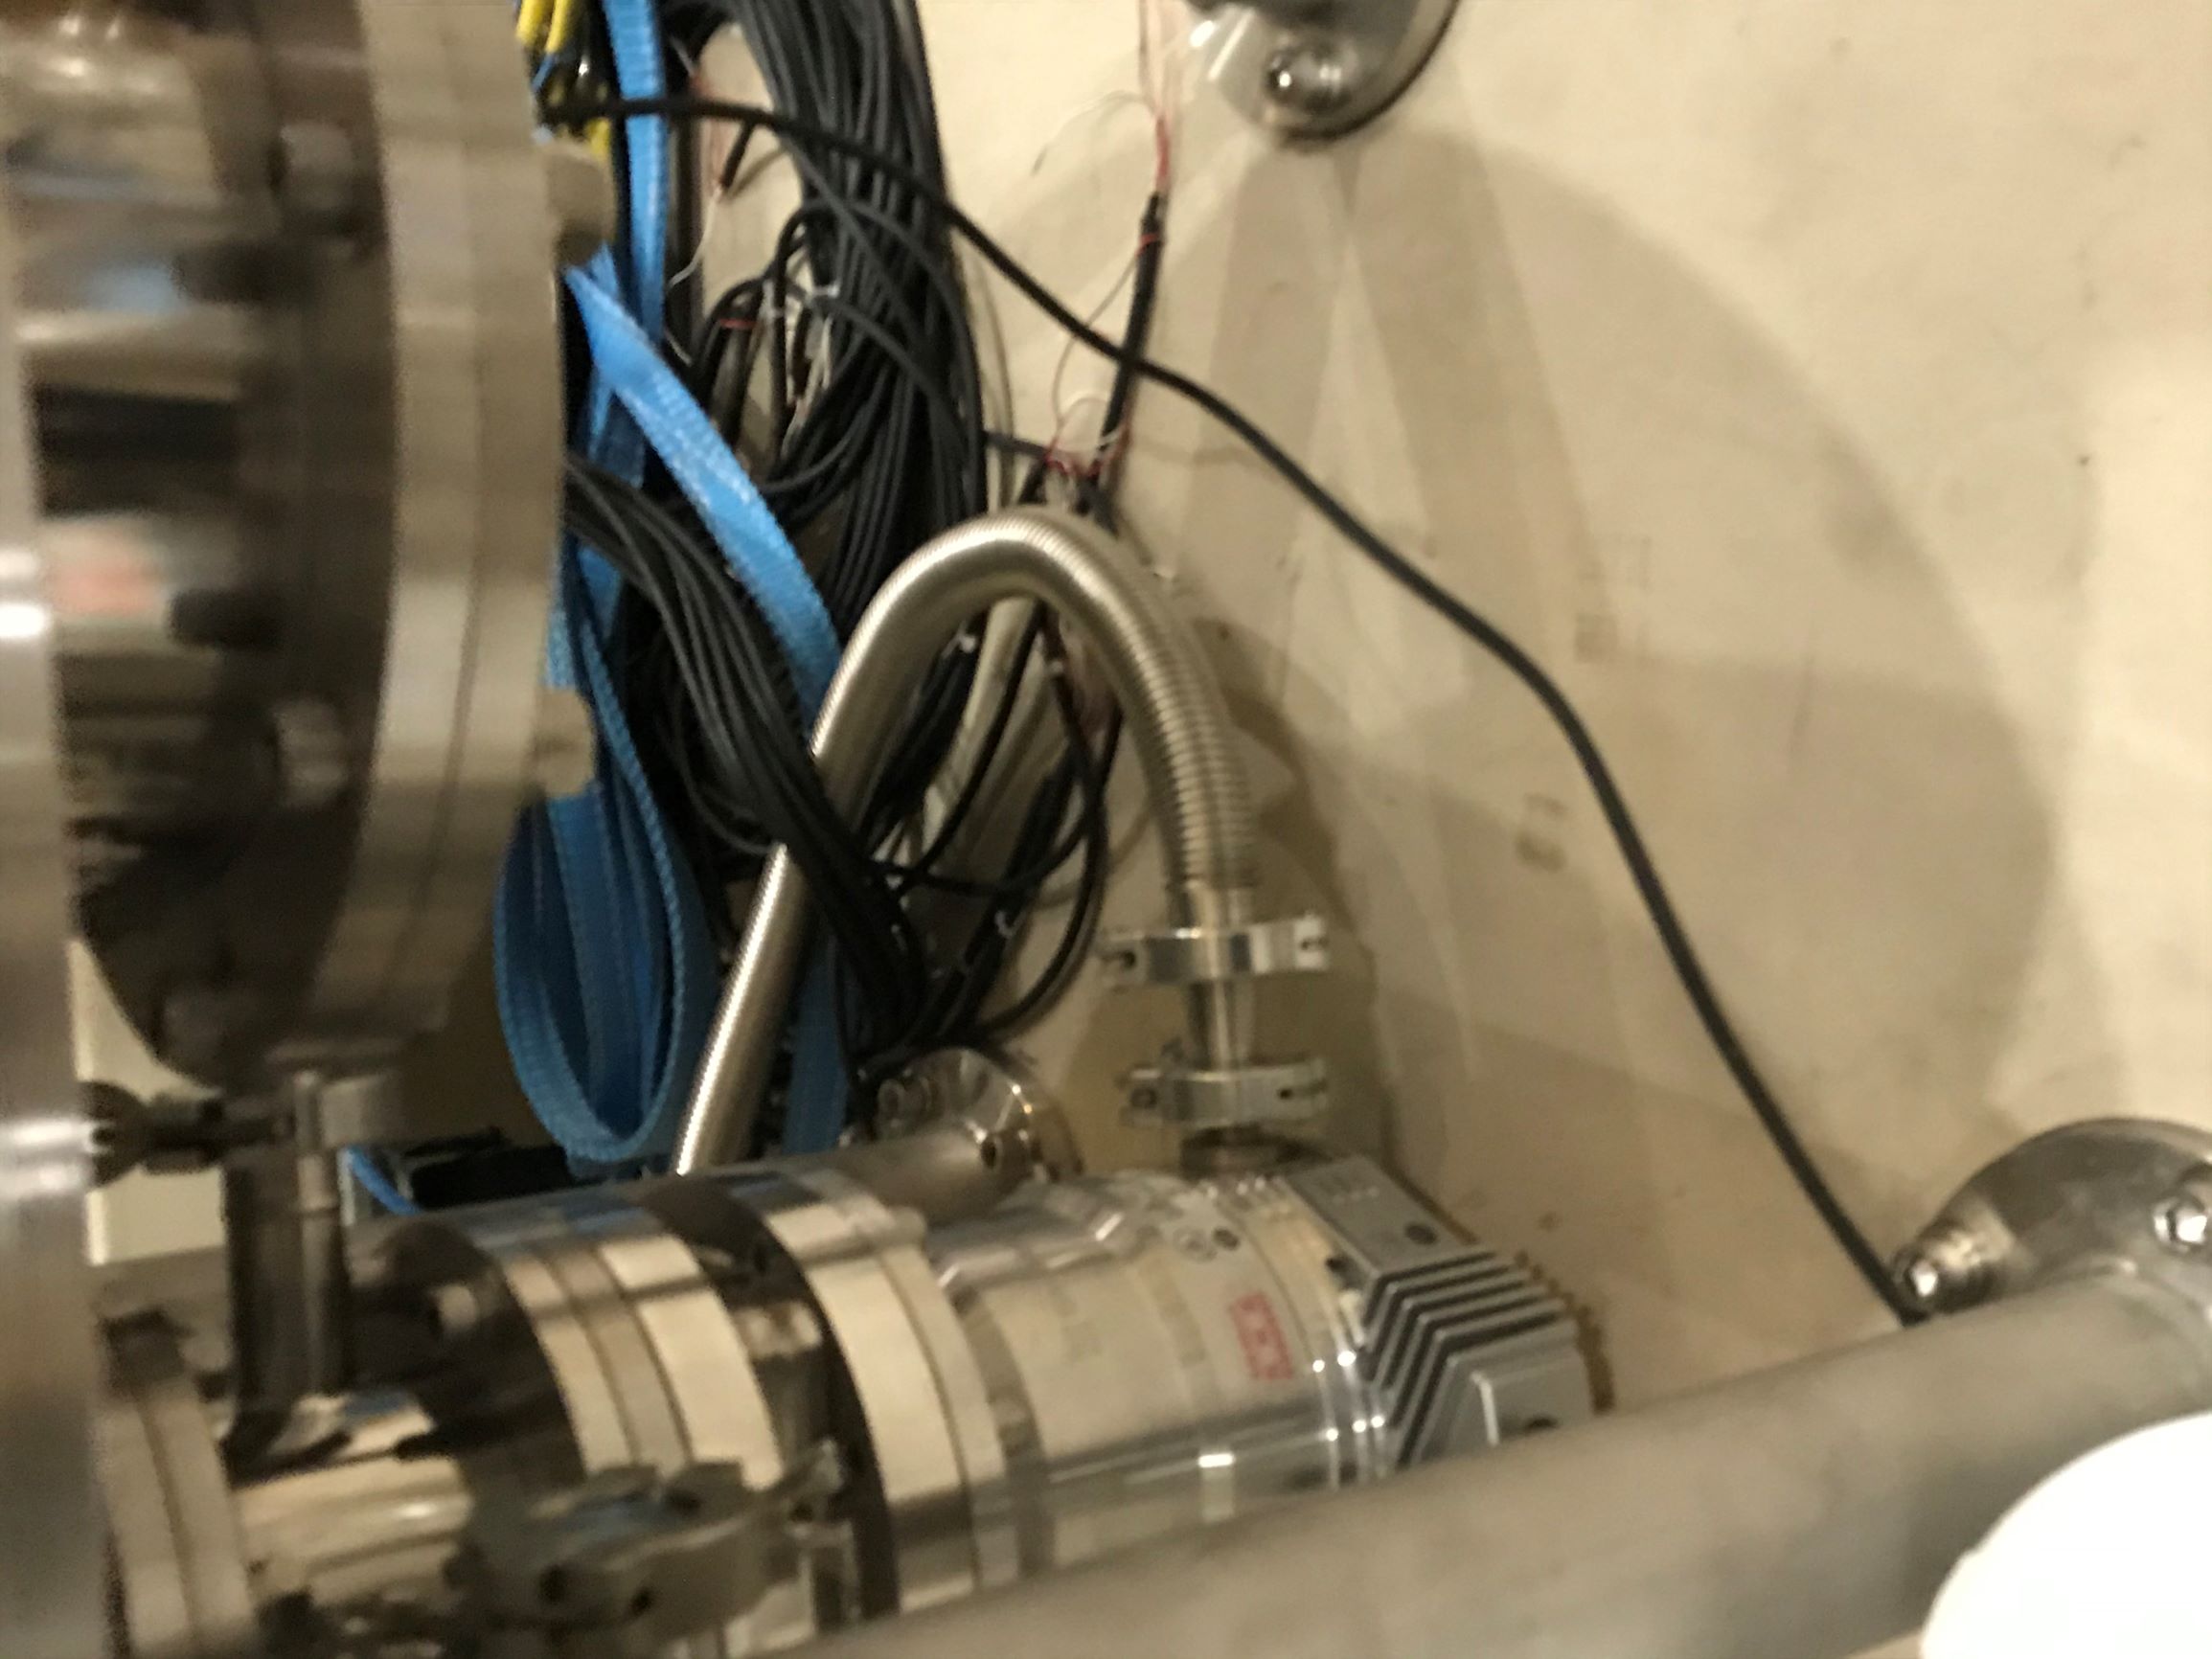
In addition, I connected the tube between scroll vacuum pump and cryostat chamber (attached).
According to the spec sheet, the diffraction efficiency of AOM is 87.7% at 1060nm and 500um beam diameter with 1.50W RF power.
This morning, I tweaked the STMs to increase the diffracted beam power.
However the diffraction efficiency was about 50%.
I'm suspecting the beam diameter is so small that the efficiency is low.
Since I have another double-pass AOM, I will input larger diameter beam to another AOM and see the effect of beam diameter on efficiency.
Also I will check the RF power.
Simon, Pengbo
Today we started the polarization map on Shinkosha KAGRA-size sample.
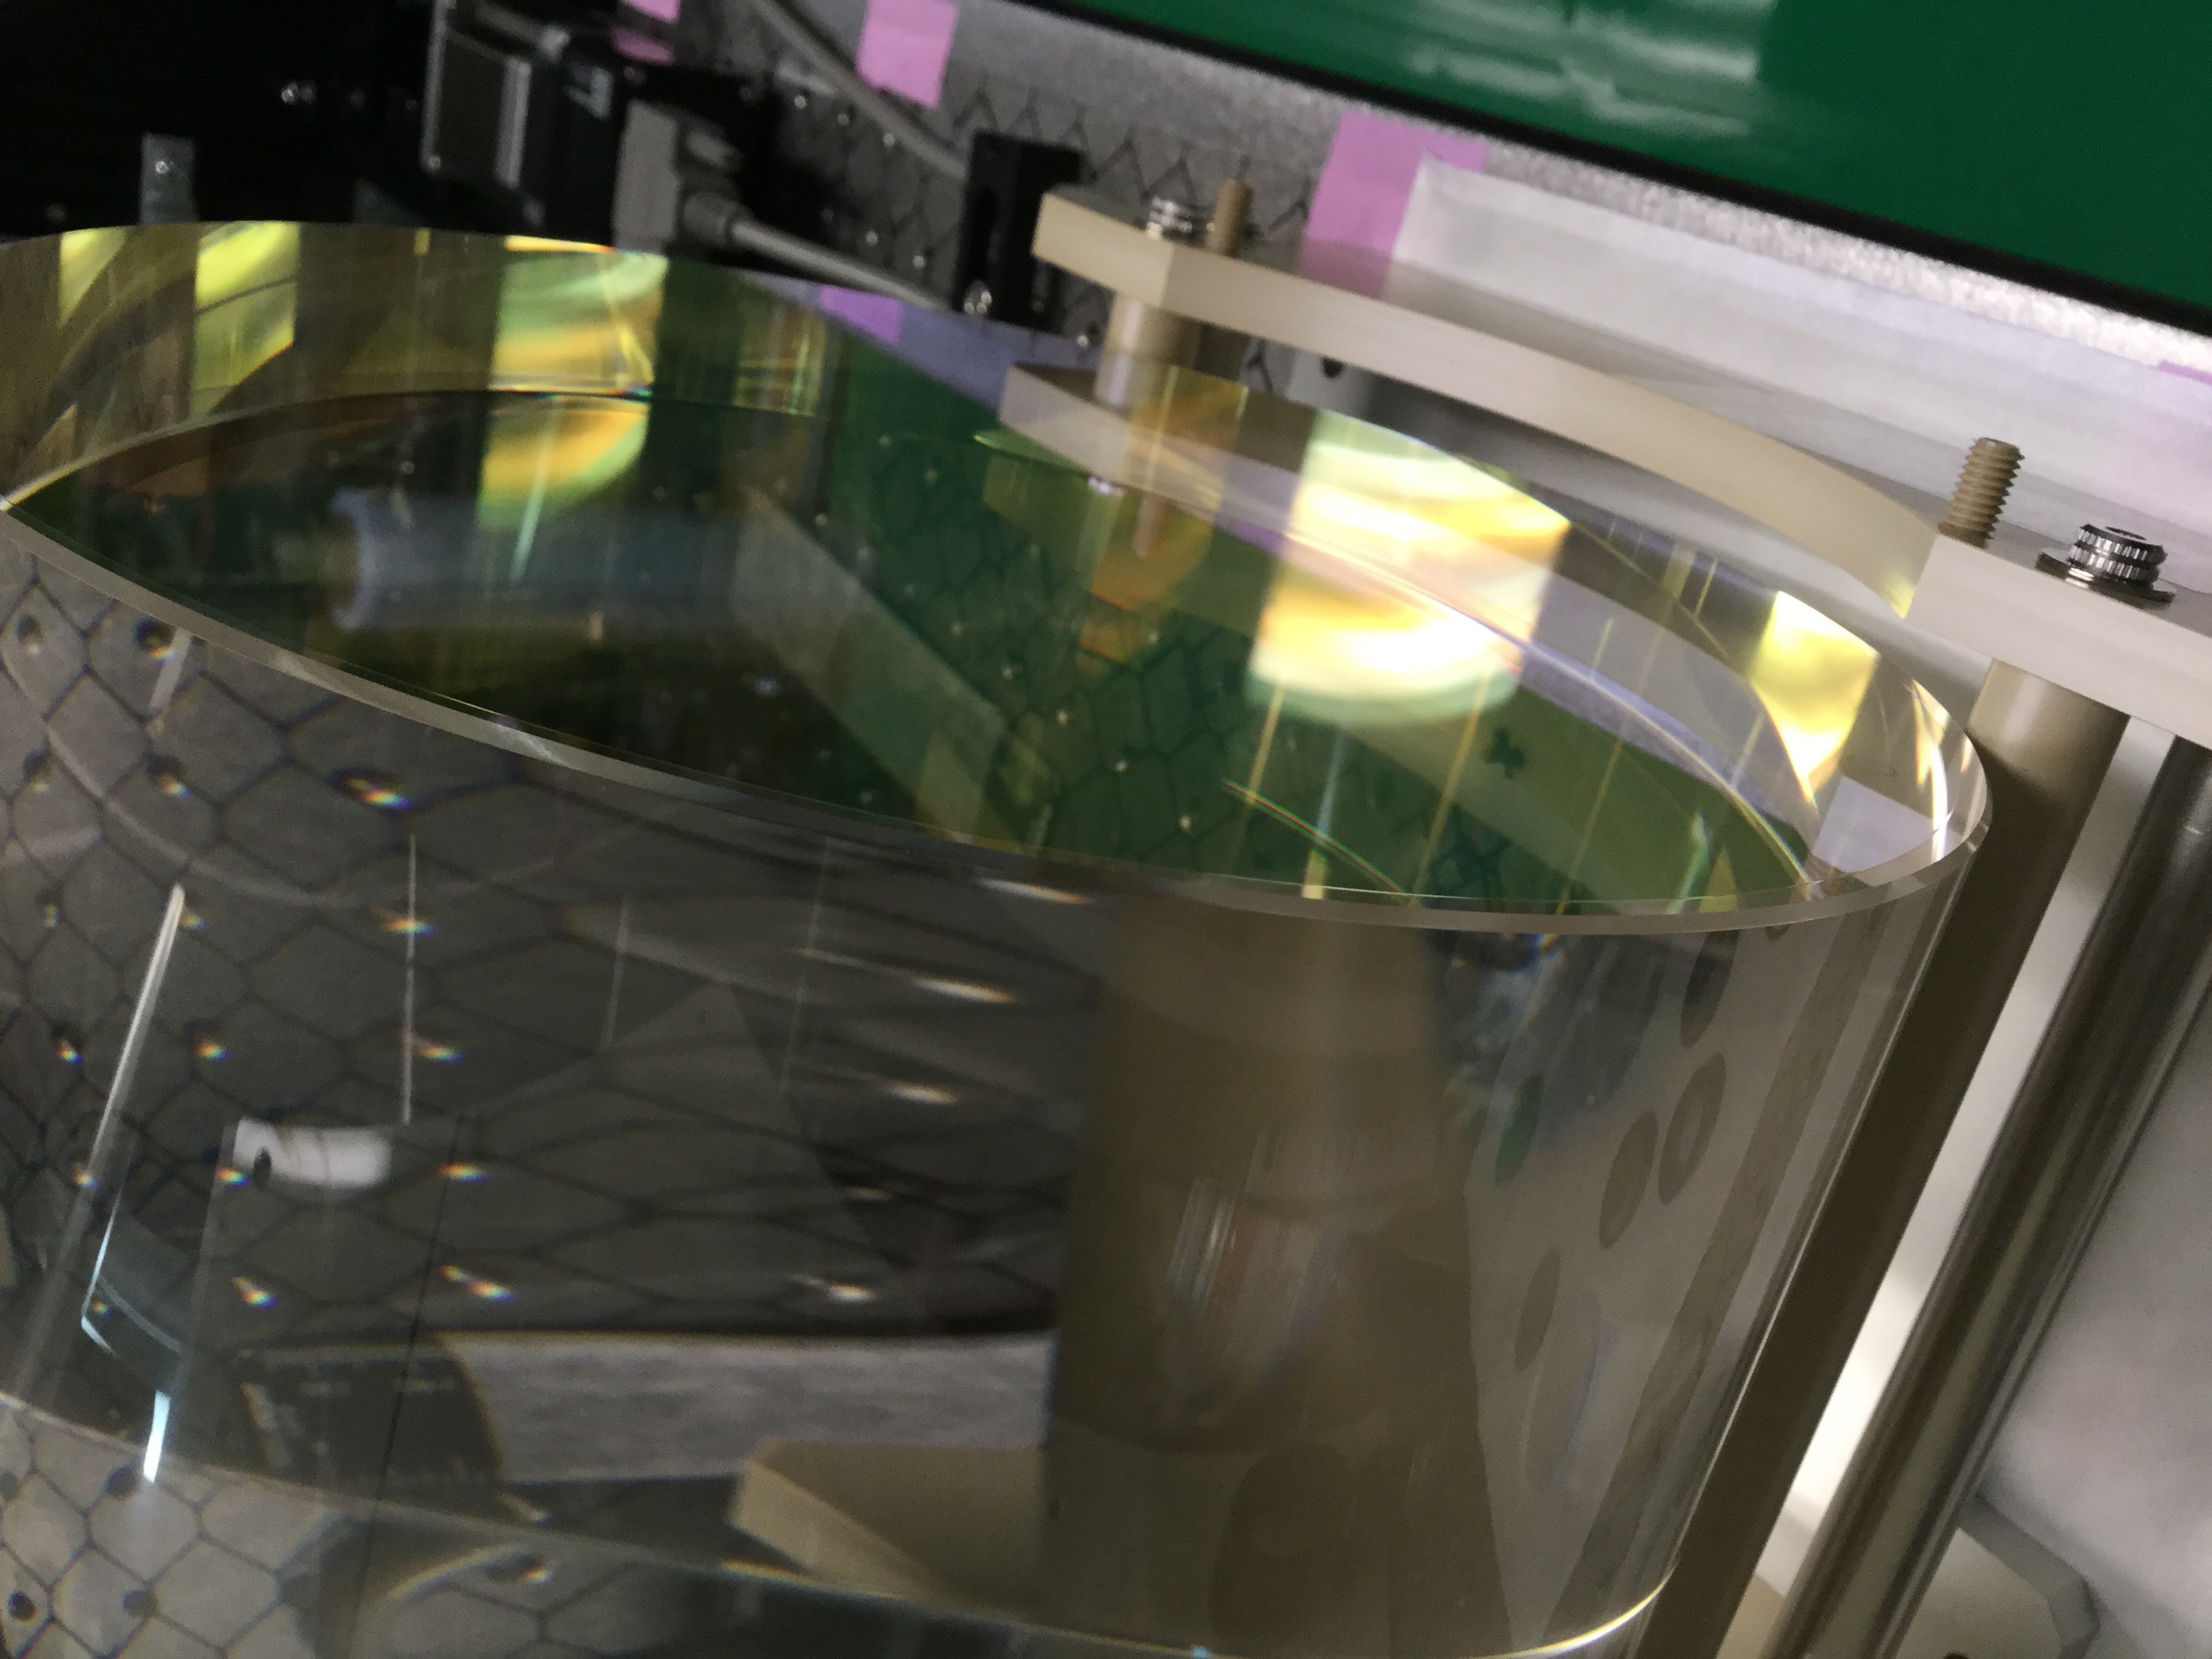
First, we took the sample out of the transportation box and inspected the mirror visually, we found coating on both sides and an arrow on the barrel, which we think might indicates the HR coating. (please check the attached photo). So we place the sample with the HR side facing the laser.
Then, We measured the AC and DC value under s- and p- polarization without the sample and move the sample back to the center. Due to the HR coating, we increase the laser power to recieve a measurable signal (--> 2A input current + removing ND filters.) However, After this adjustment, we cannot confirm the polarization status becasue the laser power to too high to measure. For now, we assume it was still the p polarization and ran the map.
Apart from that, we did a test about the output beam. We put another HWP in the output beam and adjusting so that it is maximized in p polarization.
| with the HWP | without the HWP | |
| AC | 1.82mV | 1.96mV |
| DC | 33.5mV | 33.9mV |
As can be seen, the results did't change so much.
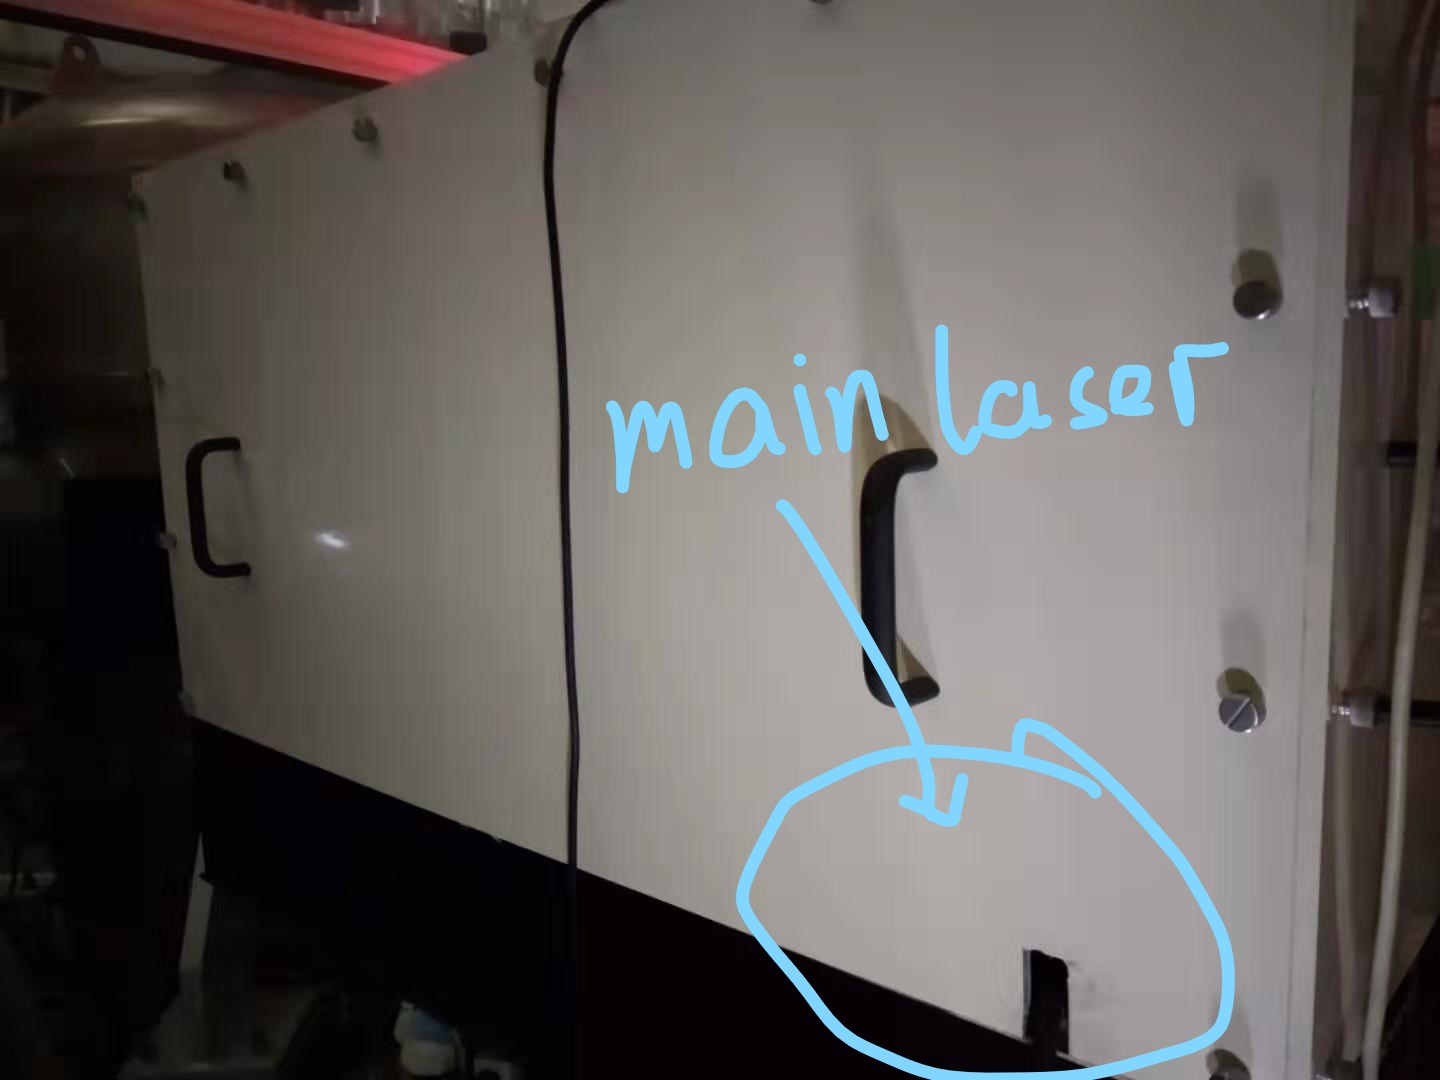
Aritomi, YaoChin and Yuhang
We closed the bench shield of main laser side(as shown in the attached picture). Now the only side we are not closing is the GR/IR injection side. Before closing, we need to drilling several holes on the board for GR/IR beam.
[Aritomi, YaoChin, and Yuhang]
After the check of frequency-dependent squeezing(reported in elog 1805), we decide that we could go on the replacement of the Faraday isolator.
But we decide that we should do the replacement after measuring again frequency-independent squeezing. So we did the thing we report here.
The measurement of squeezing is done with the main laser not locked to the filter cavity. And the result is attached in the first attached figure. As you can see from this figure, we could only see a bit squeezing in the high-frequency region. At the same time, we found the CC1 loop was quite unstable. So we guess the phase noise is quite high now.
So we did the measurement of phase noise. The pk-pk value of CC1/2 phase noise is as following
| pk-pk | calibration factor | |
| CC1 | 40mV | pi/4/0.04/15 |
| CC2 | 208mV | pi/2/0.079/15 |
The result is attached in figure 2. By comparing the phase noise measured before and reported in elog 1572, they are quite similar. By comparing the shape of phase noise and squeezing measurement, we also found that CC2 phase noise is dominating the measurement of squeezing.
[Yuhang, Yao-Chin]
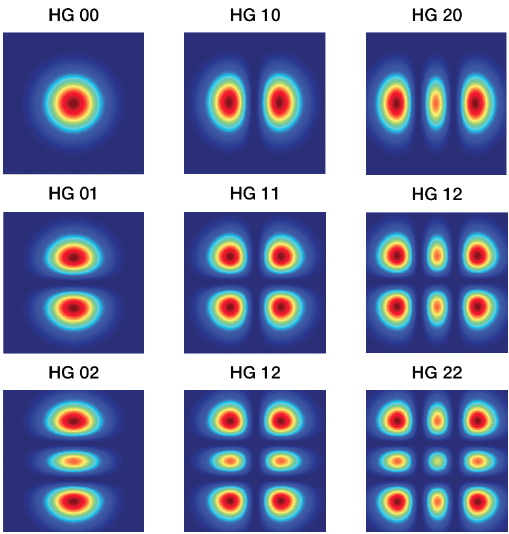
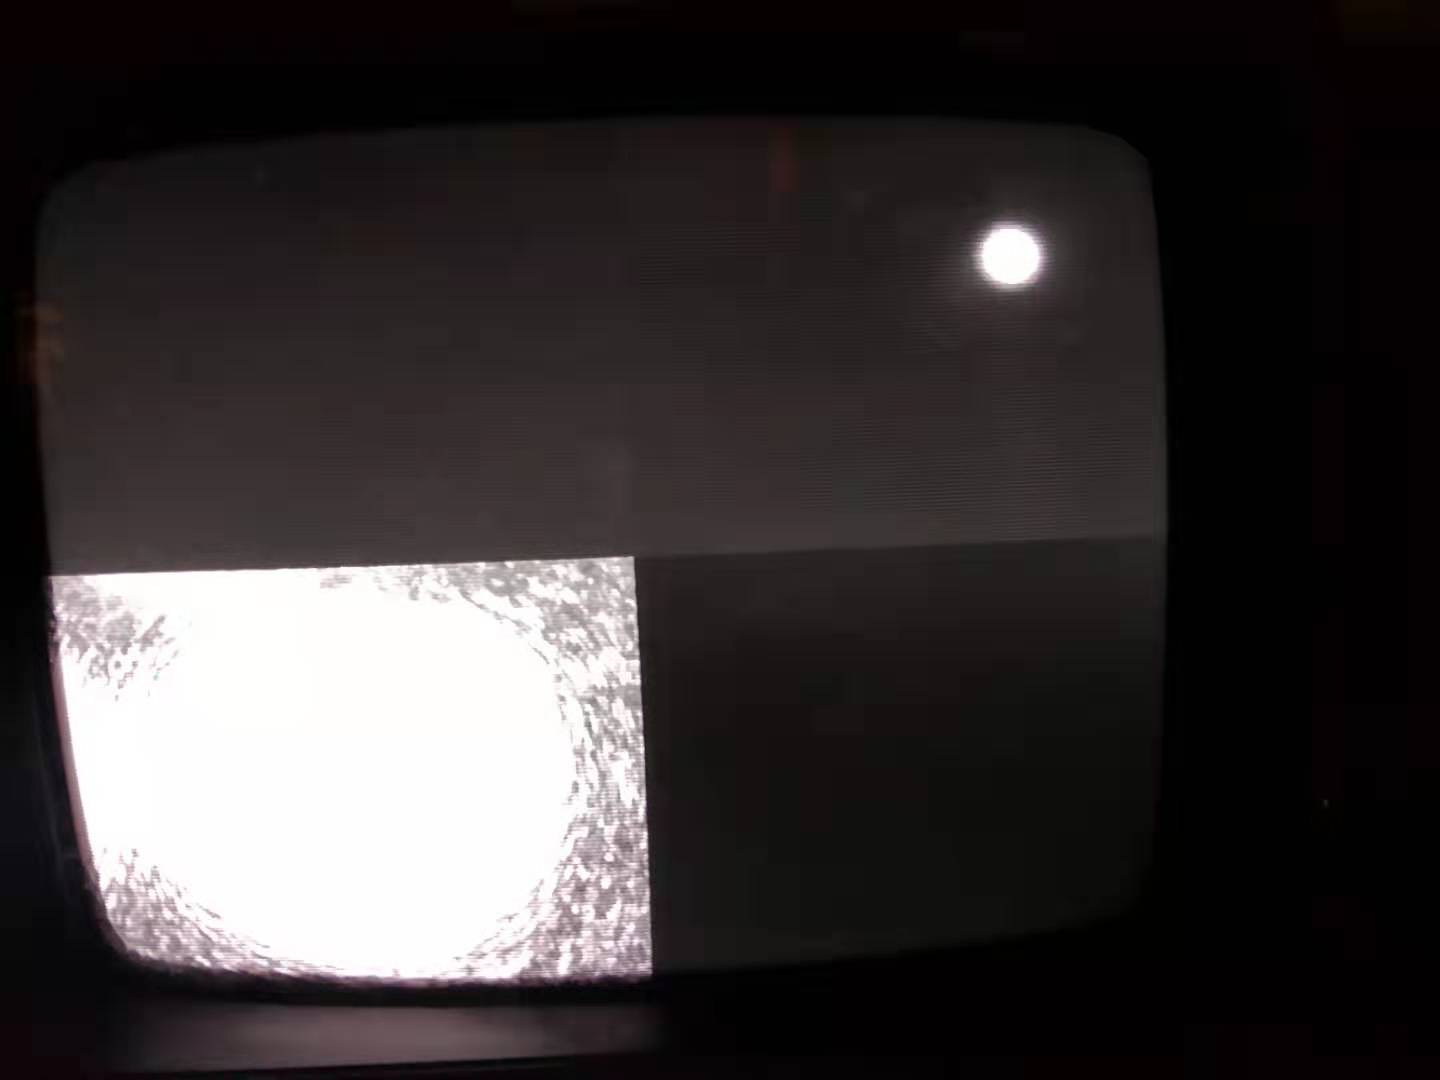
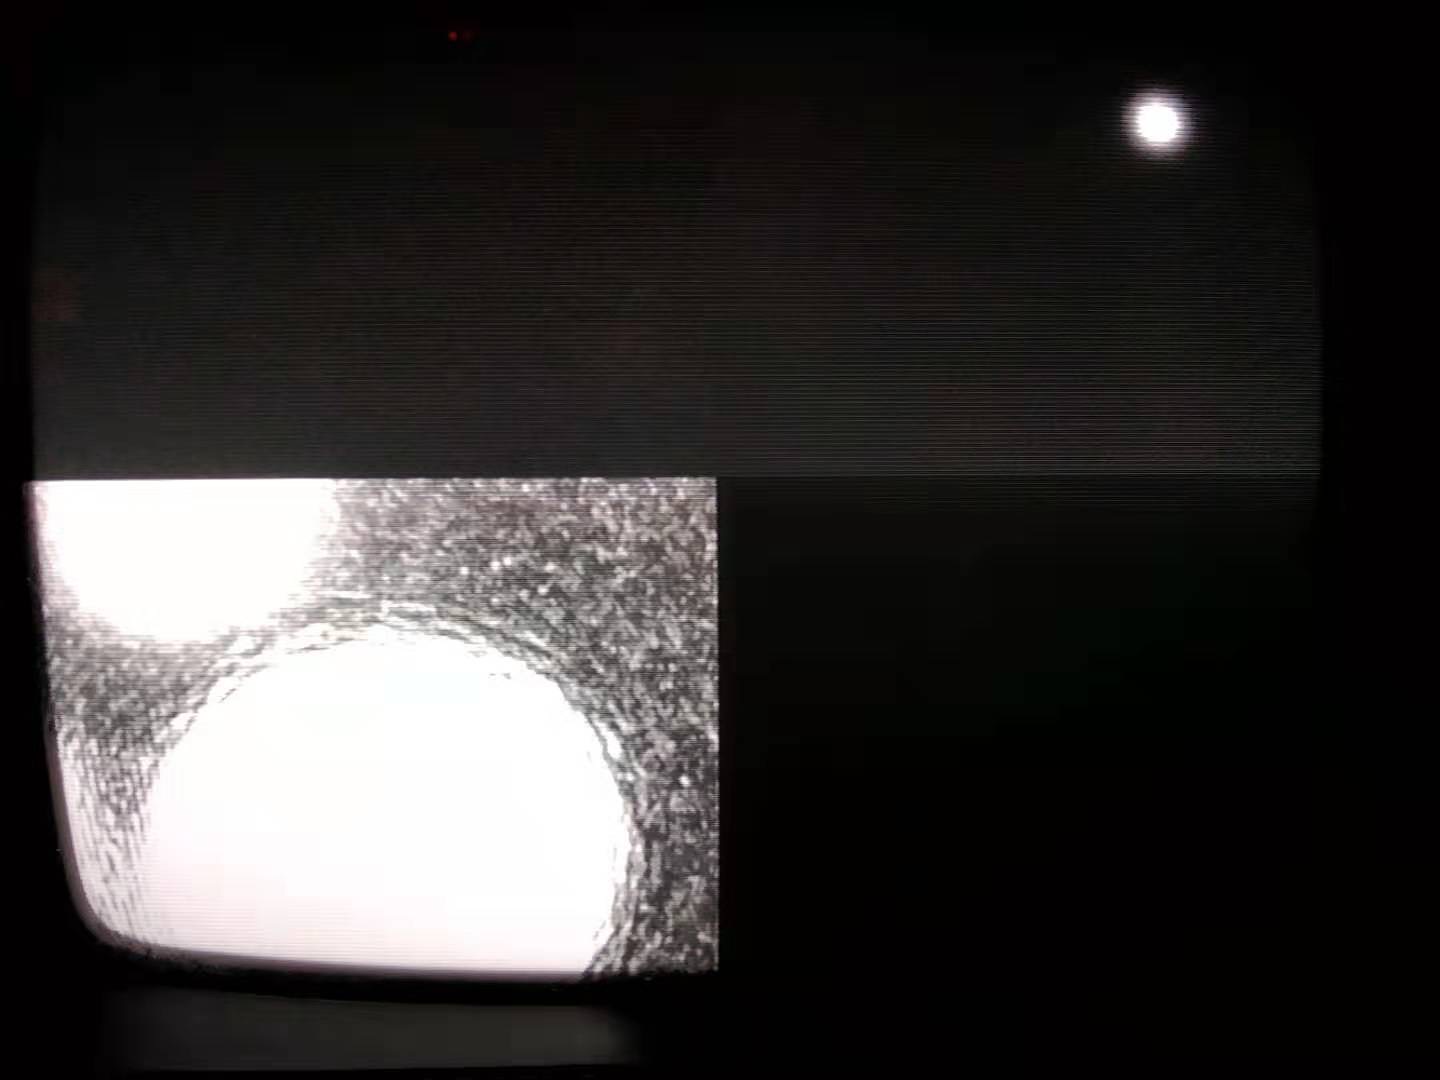
When dithering loop was open, we recorded that IR transmission modes correspond to AOM frequency (entry 1701) without parametric amplification of BAB which power was 318 uW. The result was as follows, mode matching was around 89.9%. We could realign suspension of BS and INPUT mirrors to reduce high-order modes. After aligning mirrors and dithering loop was closed, IR transmission was 405. At same time, we observed the GR and IR transmission signals during ten minutes as shown Fig 2. After ten minutes, IR and GR were misaligned obviously with decreased 16% and 4%, respectively. The CCD camera image changed from Fig 3 to Fig 4. Today, the filter cavity was unstable.
| Mode | IR transmission (average value) | AOM frequency (MHz) | Difference -109.03565 (MHz) |
| HG00(TEM00) | 370 | 109.03565 | 0 |
| HG10 (Yaw) | 115 | 109.43133 | 0.39568 |
| HG01 (Pitch) | 100 | 109.43223 | 0.39658 |
| HG11 | 98 | 109.82843 | 0.79278 |
| HG02 | 96 | 109.82922 | 0.79357 |
| HG20 | 97 | 109.83783 | 0.80218 |
| Background | 95 |
Note: From CCD camera image showed to define mode as Fig 1.
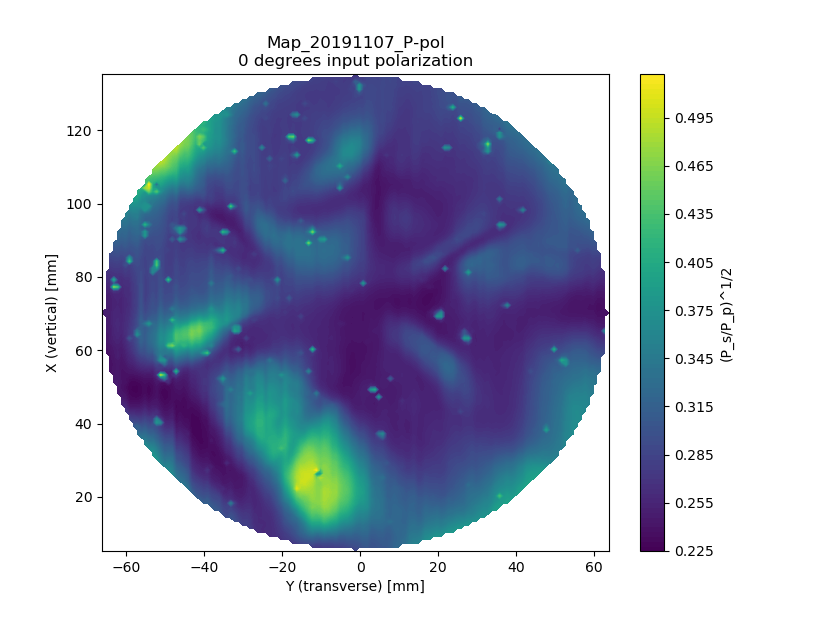
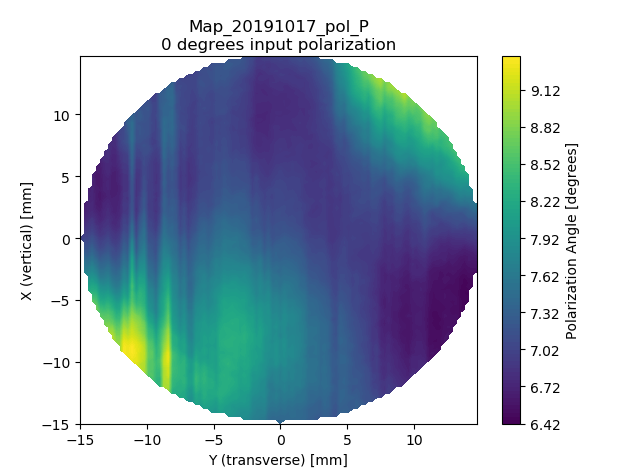
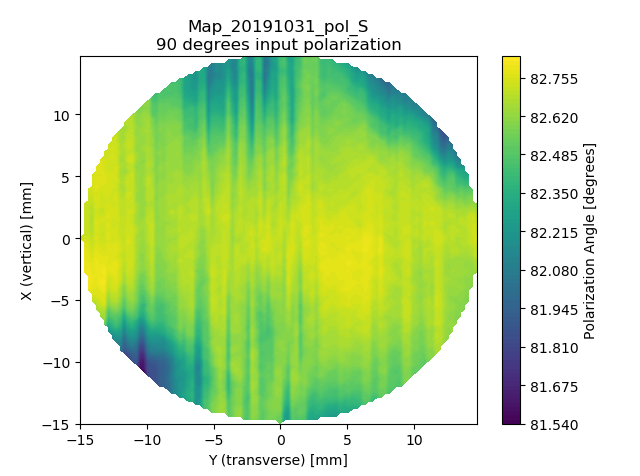
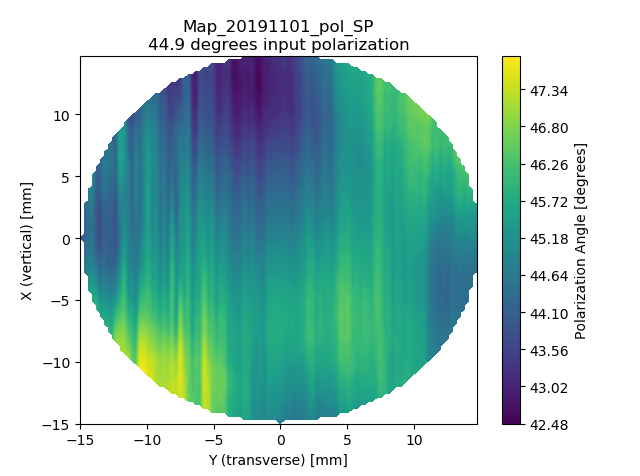
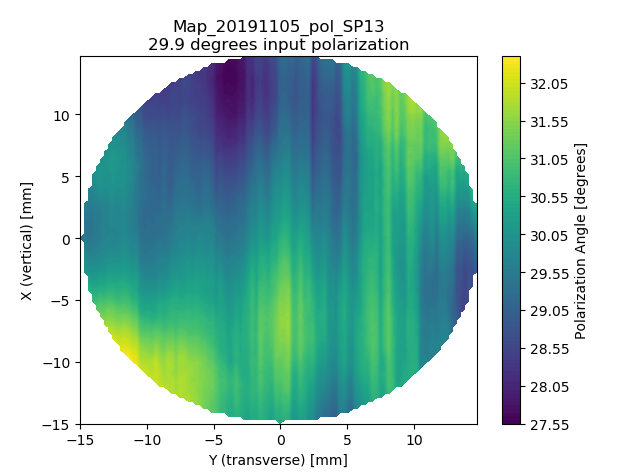
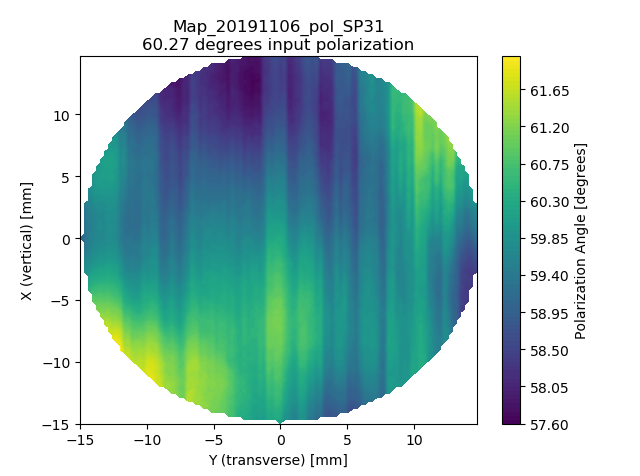
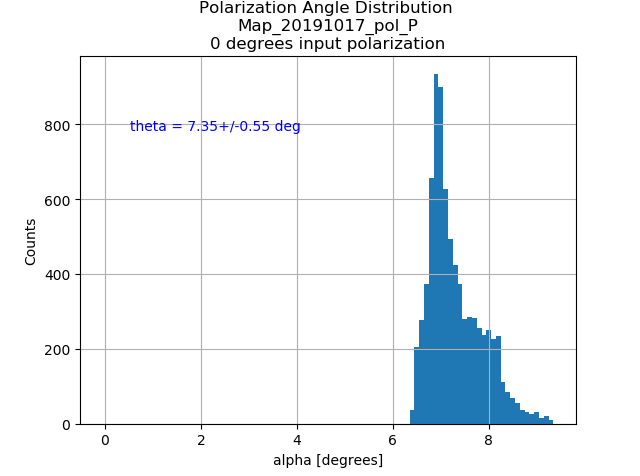
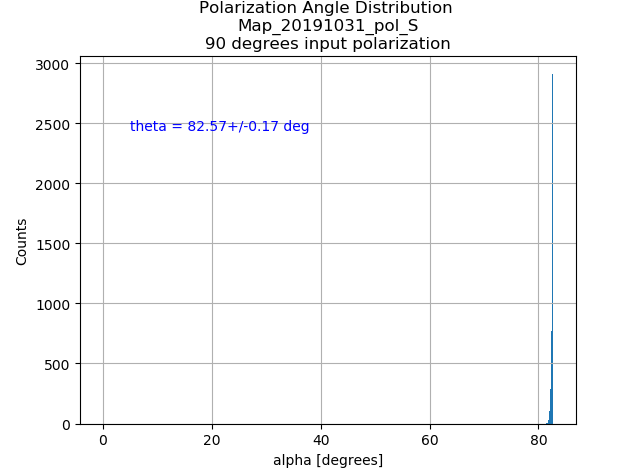
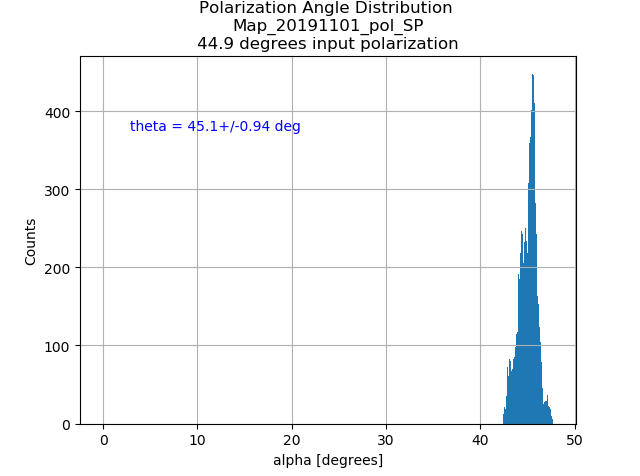
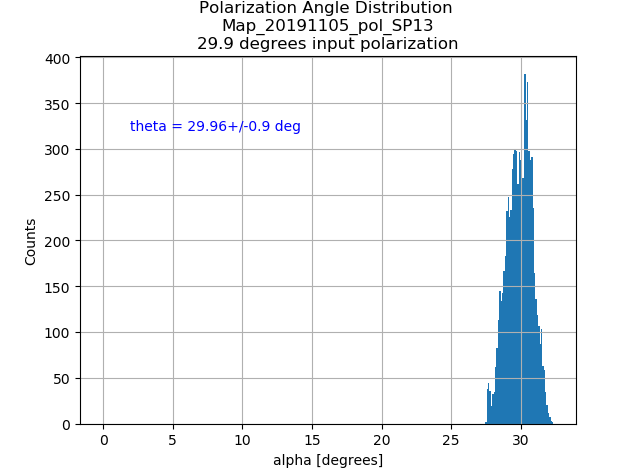
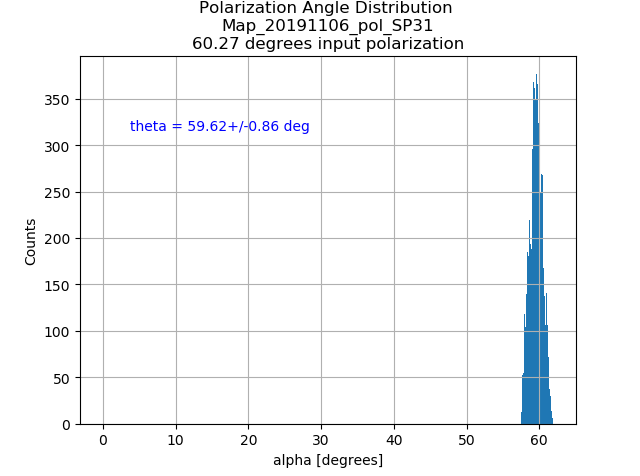
We measured the polarization map on TAMA #1 with different input polarization angles. 0 degrees represents the pure P polarization.
As can be seen, the S- and P- polarized map show apparent offset, which mainly due to the birefringence effect. In contrast, another three mixture maps show consistency with the input polarization angle.
[Aritomi, Yuhang, Yaochin]
First we checked IR mode matching again. Mode matching is 92% as follows.
| Mode | IR transmission |
| TEM00 | 365 |
| yaw | 112 |
| pitch | 98 |
| offset | 94 |
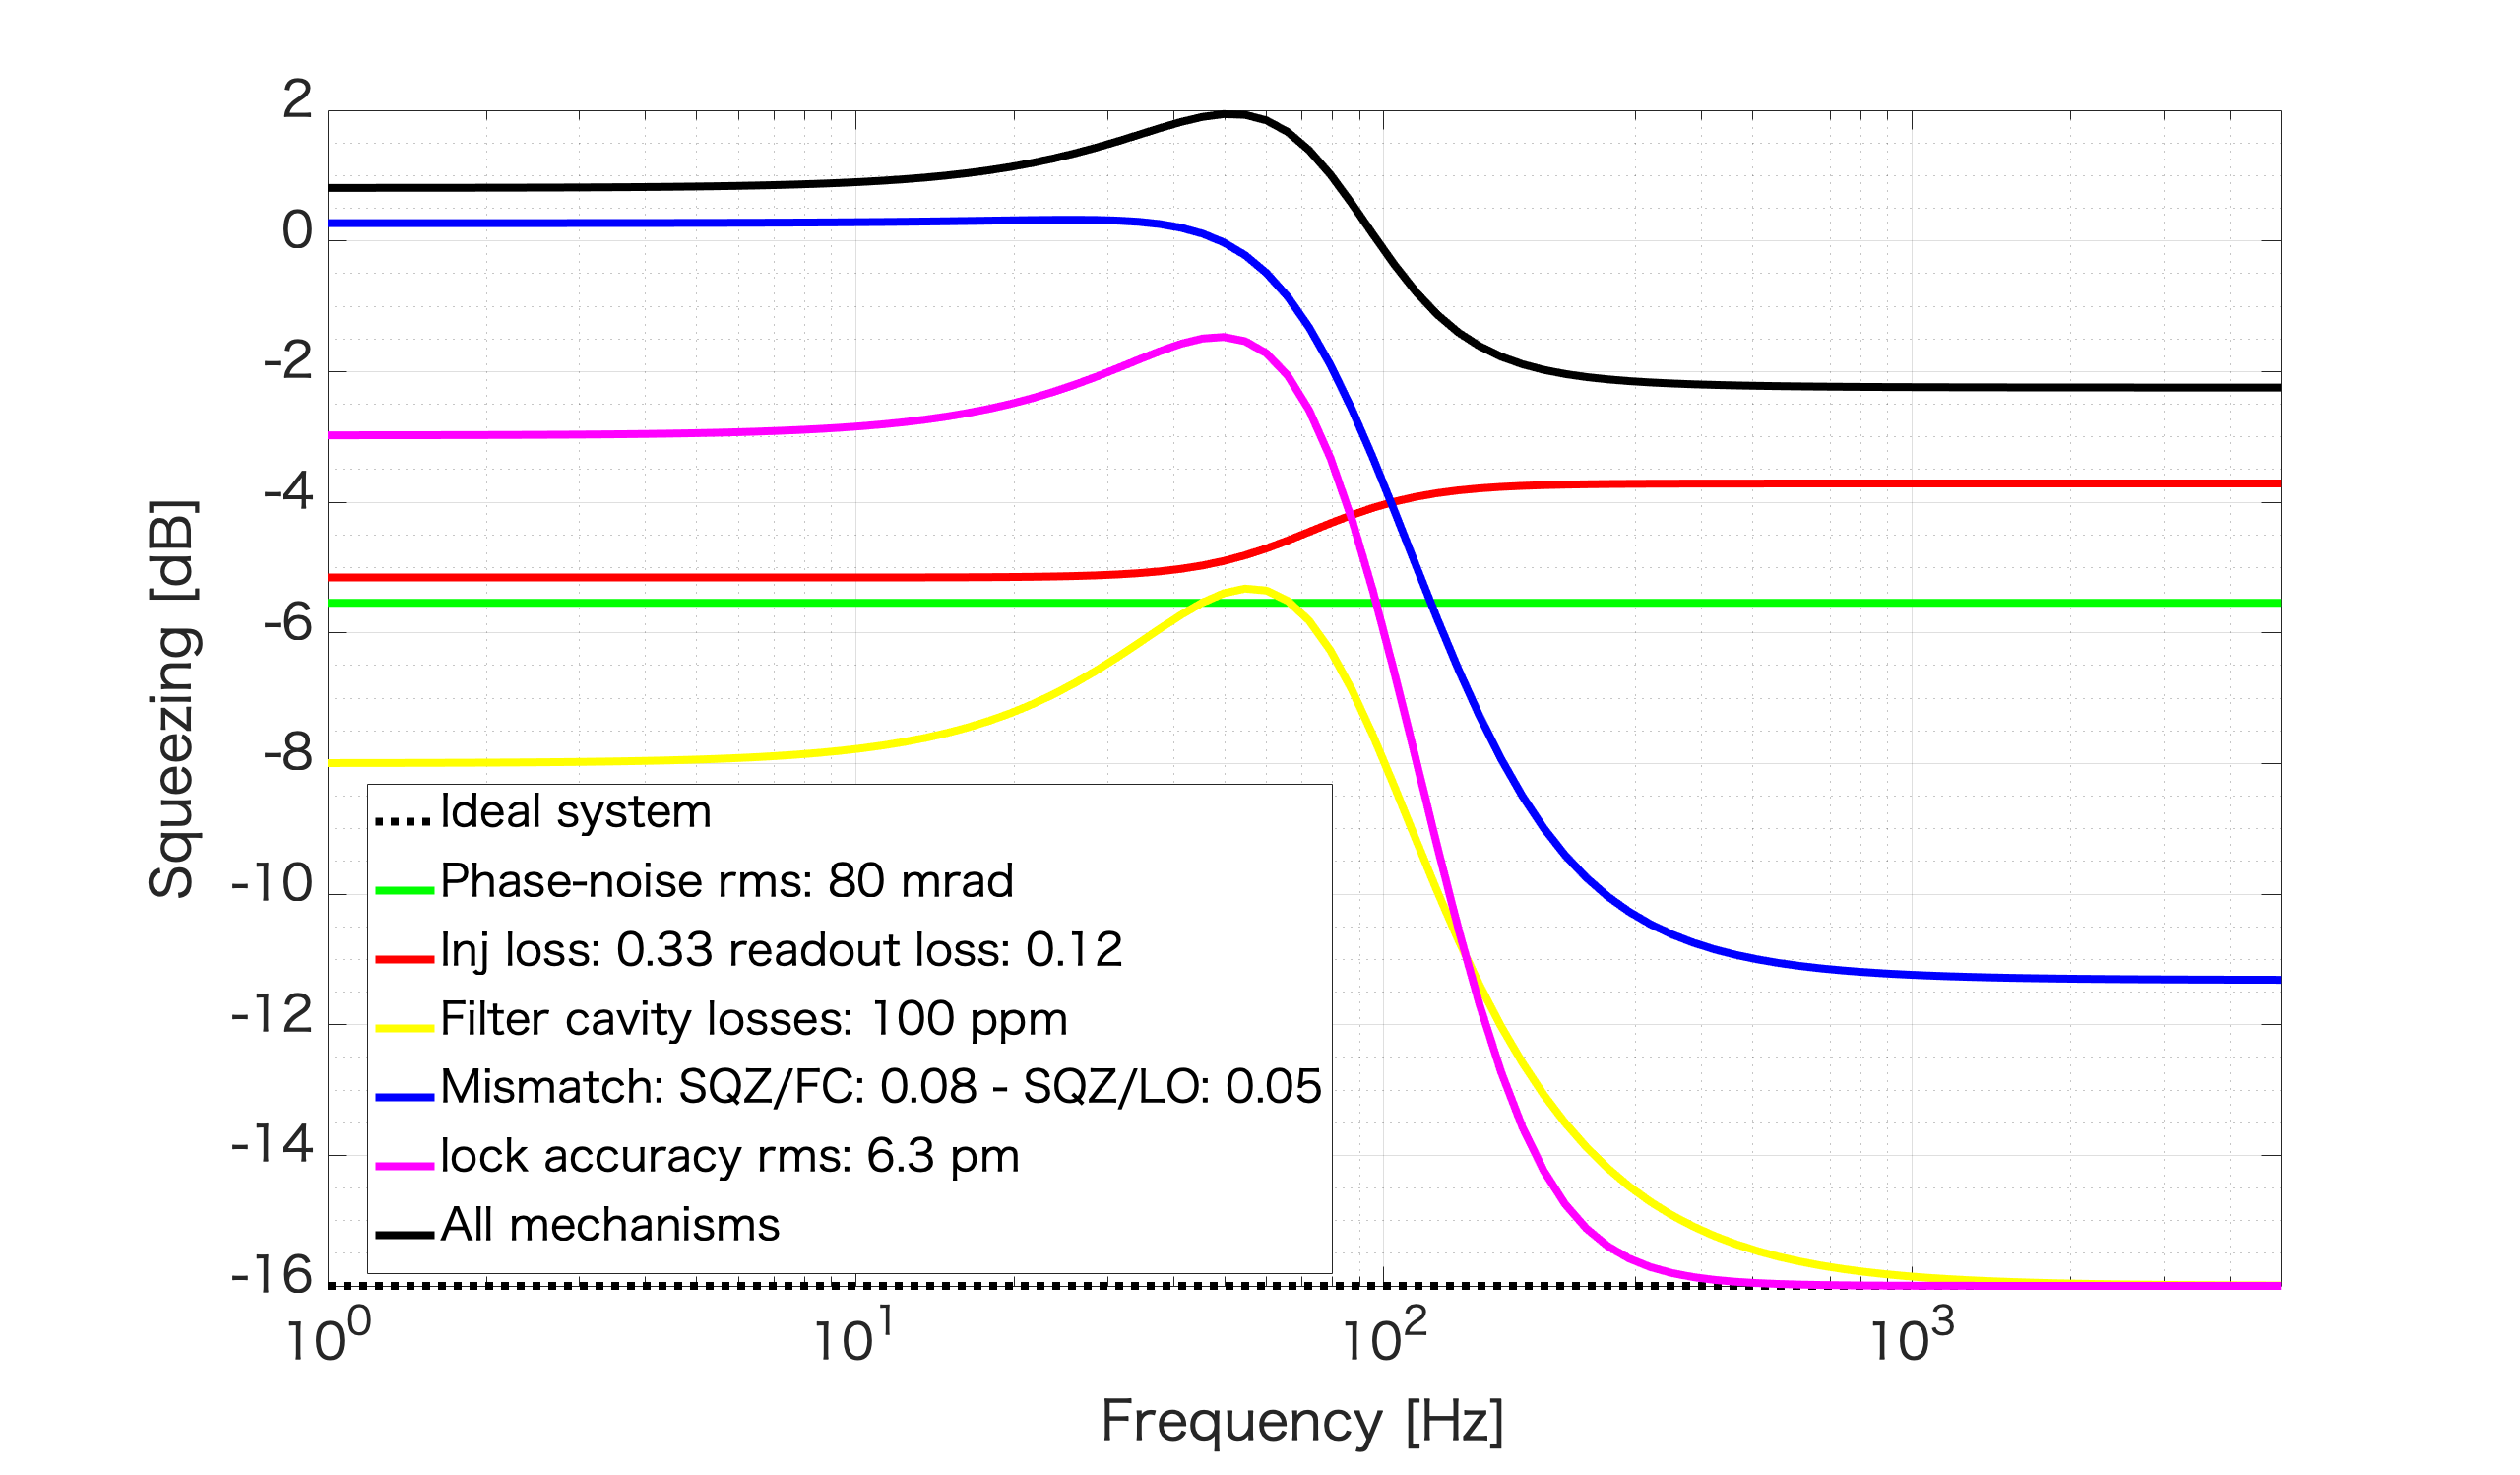
Then we measured frequency dependent squeezing around 50 kHz and 500 Hz (Pic. 1,2). CC2 demodulation phase is 75 deg for squeezing and 110 deg for anti squeezing. During this measurement, turbo pump was off and locking accuracy should be 3.1 Hz which corresponds to 3.3 pm (entry 1797). Pic. 3 shows squeezing degradation budget with current parameters.
Squeezing level inside filter cavity with 50 kHz detuning may be better due to better alignment. For FDS spectrum with 500 Hz detuning, we could observe squeezing angle rotation, but there is large phase noise below 100 Hz.
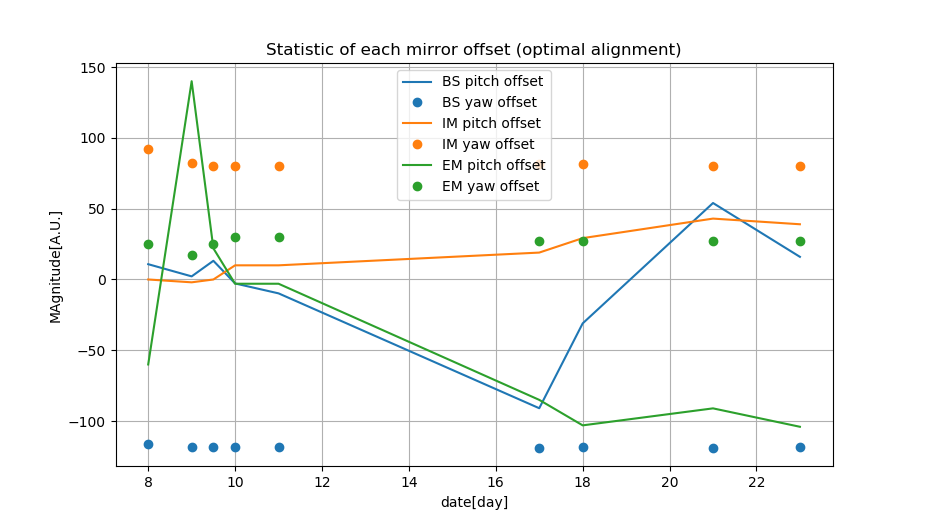
As we know, we need to align the filter cavity quite often. Sometimes we need to align many times during one day, sometimes it is stable for one day.
I took the alignment condition in the scale of the day (during October) and made this plot. We could use this as a reference for the alignment. We could have a feeling about how our filter cavity drifts for several weeks.
I worked on alignment for double-pass AOM with scanning frequency.
Since I have not prepared QPD yet, I used beam profiler to monitor the beam position.
Still the double-passed beam has beam jitter and need more optimization.
It should be noted that the input inpedance of frequency tuning is 1kOhm so that the actual input voltage from function generator which output inpedance is 50Ohm is doubled.
Tunable frequency range is 50-100MHz and it corresponds to +1.5 to +15V (+0.75V to +7.5V on display).
The attached is SMC connector to input voltage for frequency tuning.