NAOJ GW Elog Logbook 3.2

Yuhang, Marc, Michael
We took inventory for the computer equipment located at TAMA that is required for the DGS upgrade. Specifically, we would like to increase the number of ADC/DAC channels to accommodate new QPDs that should be installed. However, our current computer system is full, and we would like to install new frontend PCs to operate the additional channels. By adding a new PC(s), we have to go from standalone to network configuration. In a network configuration, synchronised data acquisition is achieved using the Dolphin network equipment. A summary of the principles and components of the ALIGO timing system is written by Yoichi Aso et al. "Advanced LIGO Timing System: Final Design" LIGO-T070173-00-D
1000BASE-LX/LH SFP 1310nm 10km Transceiver Module: 2 boxes of optical fiber transceivers (USB-stick sized optical to electronic transceiver)
24-Port Gigabit PoE+ Managed Switch with 2 1Gb Combo and 2 10Gb SFP Uplinks, 440W: 1 unit. Large black chassis. Model number S3410-24TS-P.
24-Port Gigabit L2+ Stackable Managed Switch with 4 10Gb SFP+: 3 units. Large grey chassis. Model number S3910-24TS.
48-port Gigabit PoE+ Managed Switch with 4 SFP+, 400W: 2 units. Large grey/black chassis. Model number S3400-48T4SP.
Thick 5m optical fiber cables: 3 units. SA-444L-5M-S2.
Digital to analogue converter: 2 units of PCI express cards. PCIe-16AO16-16-F0-DF.
Analogue to digital converter: 2 units of PCI express cards. PCIe-16AI64SSC-64-50M.
Dolphin PCIe Gen 3 PXH830 non-transparent bridge adapter card: 3 units (in nondescript brown boxes)
Adnaco PCIe epxansion host card and chassis: One unit. ADNACO-S2B-01-000 card and Adnaco-C2B chassis.
Myricom card: One unit. Used for ultrafast communication of frontend PC to data concentrator.
Senetem CAT.7 flat cable, 10 Gb LAN: 6 units 2m, 6 units 5m.
10m thin optical cable: Unlabelled. Blue colour.
IRIG cables: One box. Used for communication from GPS receiver to timing system to retreive the absolute GPS time.
DGS Timing Card: One unit. Spectracom, located in bag "DGS Timing Card". I'm guessing it coordinates GPS absolute time with the 1PPS GPS synchronisation signal.
Dolphin MXS824 24 port PCIe Gen 3 switch: One unit. Large black chassis.
--
Some already installed computer units:
1. Model # CSP-30EGSR4, SN CS6279 (next to PR tank)
2. Model # CSP-32XES, SN CS6257 (rack next to south arm, upper left)
3. Model # CSP-30EGSR4, SN CS6285 (rack next to south arm, upper right)
4. Model # CSP-38XQDR4, SN CS6278 (rack next to south arm, middle)
5. Model # 813M-3, SN BT0-2947105-001 (rack next to south arm, bottom)
Katsuki, Marc
This morning we checked again the pump beam profile to make sure the earthquake did not affect its properties.
It was fine so we checked the surface calibration (R = 16.64 at z = 35 mm and z_IU = 68mm) and bulk calibration (R_bulk = 0.6909 cm/W).
We inspected the sample with the strong green light and cleaned it with the ion gun.
We checked the centering and got X_center = 326.99mm and Y_center = 122.709 mm.
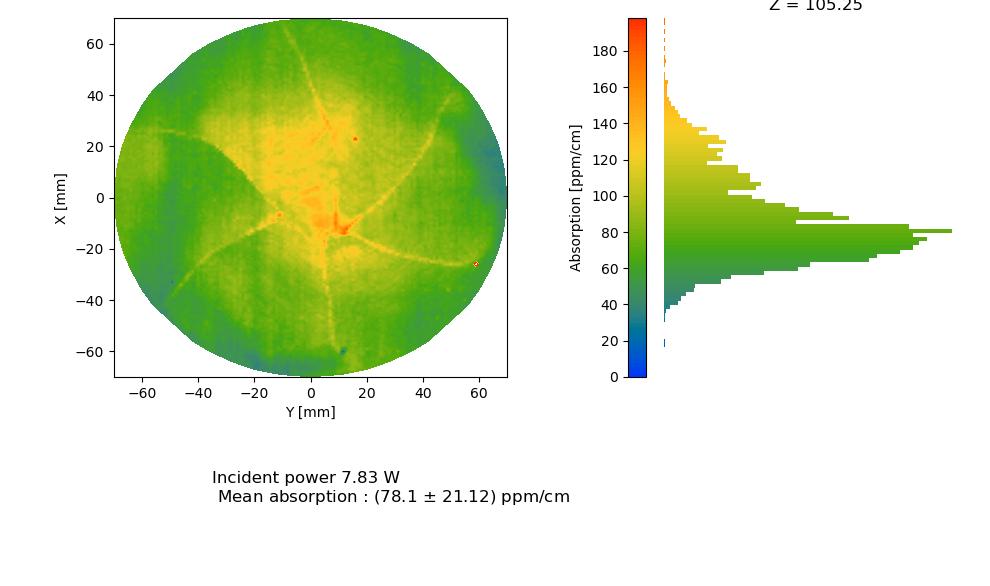
We increased the laser power to about 7.5 W and did a long z scan from which we got the 2 surfaces at z = 41.34 mm and 76.02mm making Z_center = 58.68 mm.
We could also estimate the absorption to be about 70 ppm/cm (roughly same as previous measurement).
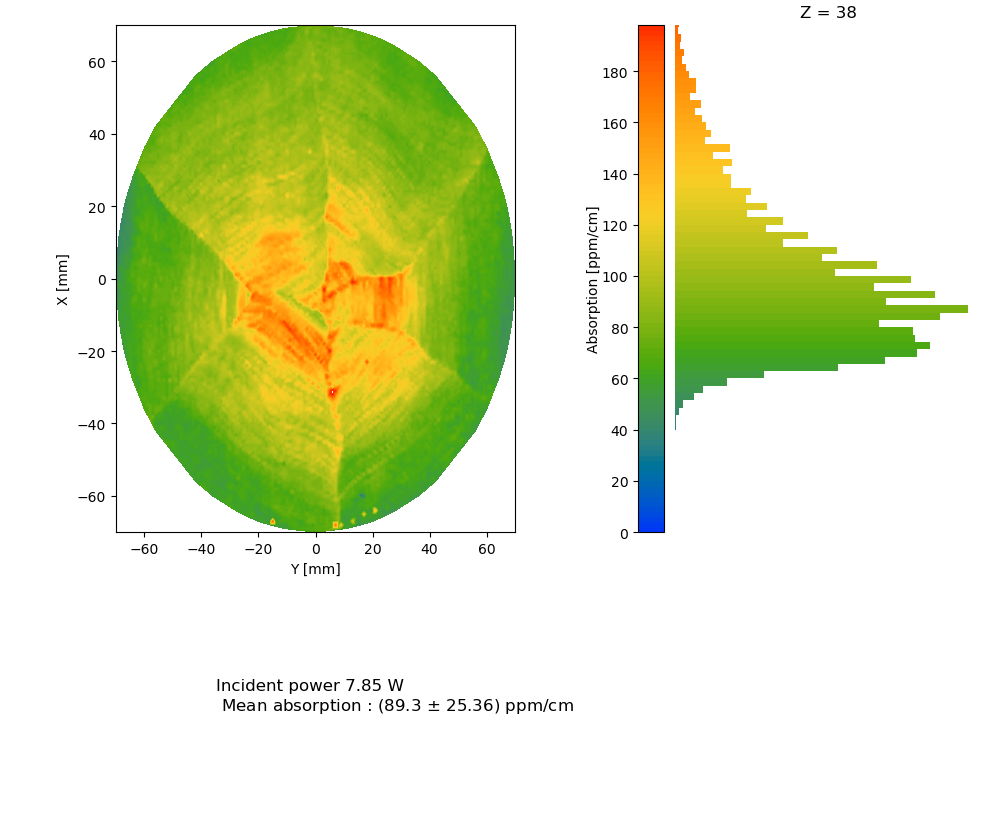
We started a XY absorption measurement at Z_center with 0.25 mm step size, 0.5s waiting time and 10 order average/median filters that will last for about 16 h 30.
Today we removed the SHINKOSHA 7 with Yuhang.
Actually Yuhang pointed out that our technique to remove this heavy sample generates quite strong impact on the injection breadboard that could be one of the reason for the pump beam shape change.
I checked the surface reference sample and got R = 16.50 /W instead of the previous R = 16.91 /W.
I suspected that the difference was again arising because of a change in the pump beam size.
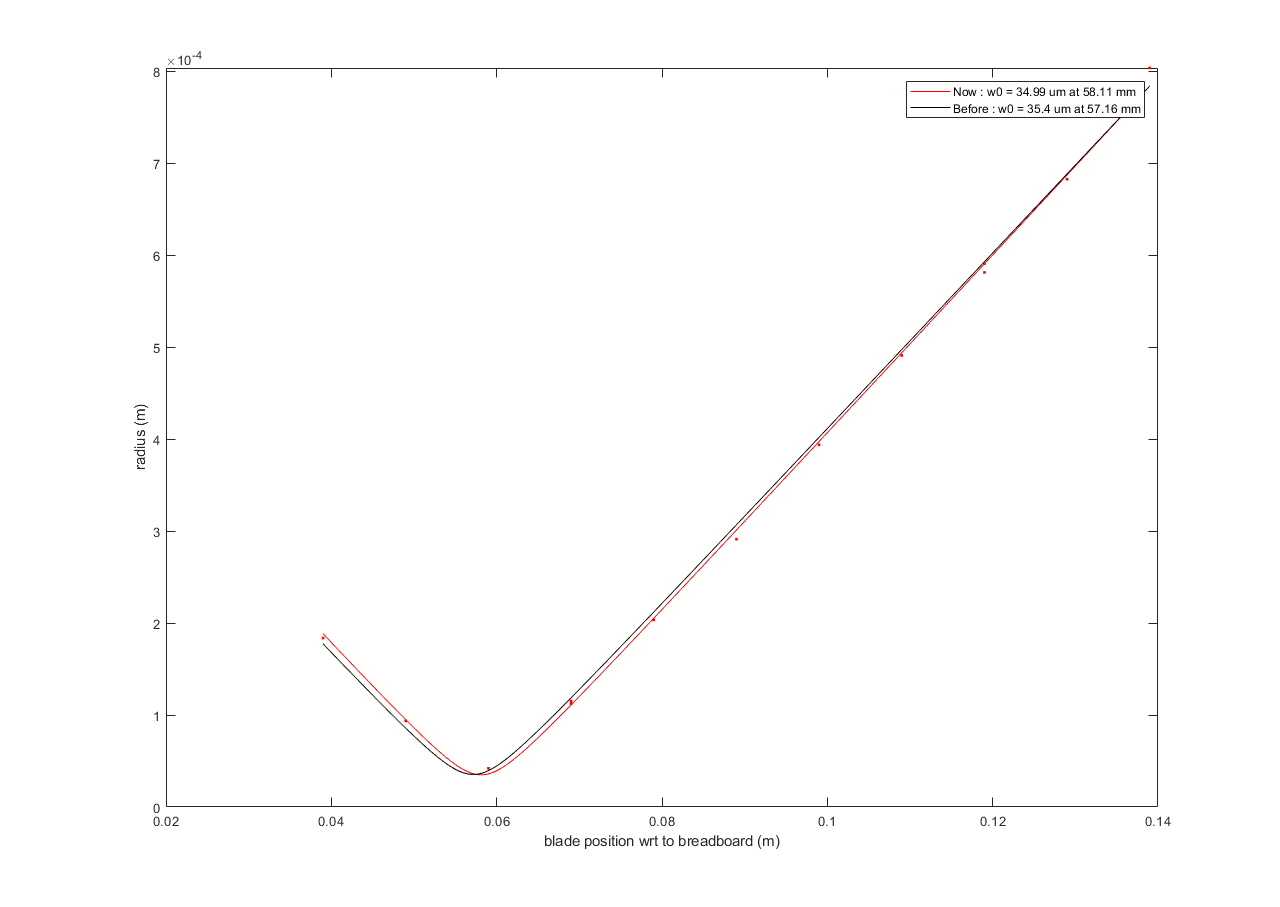
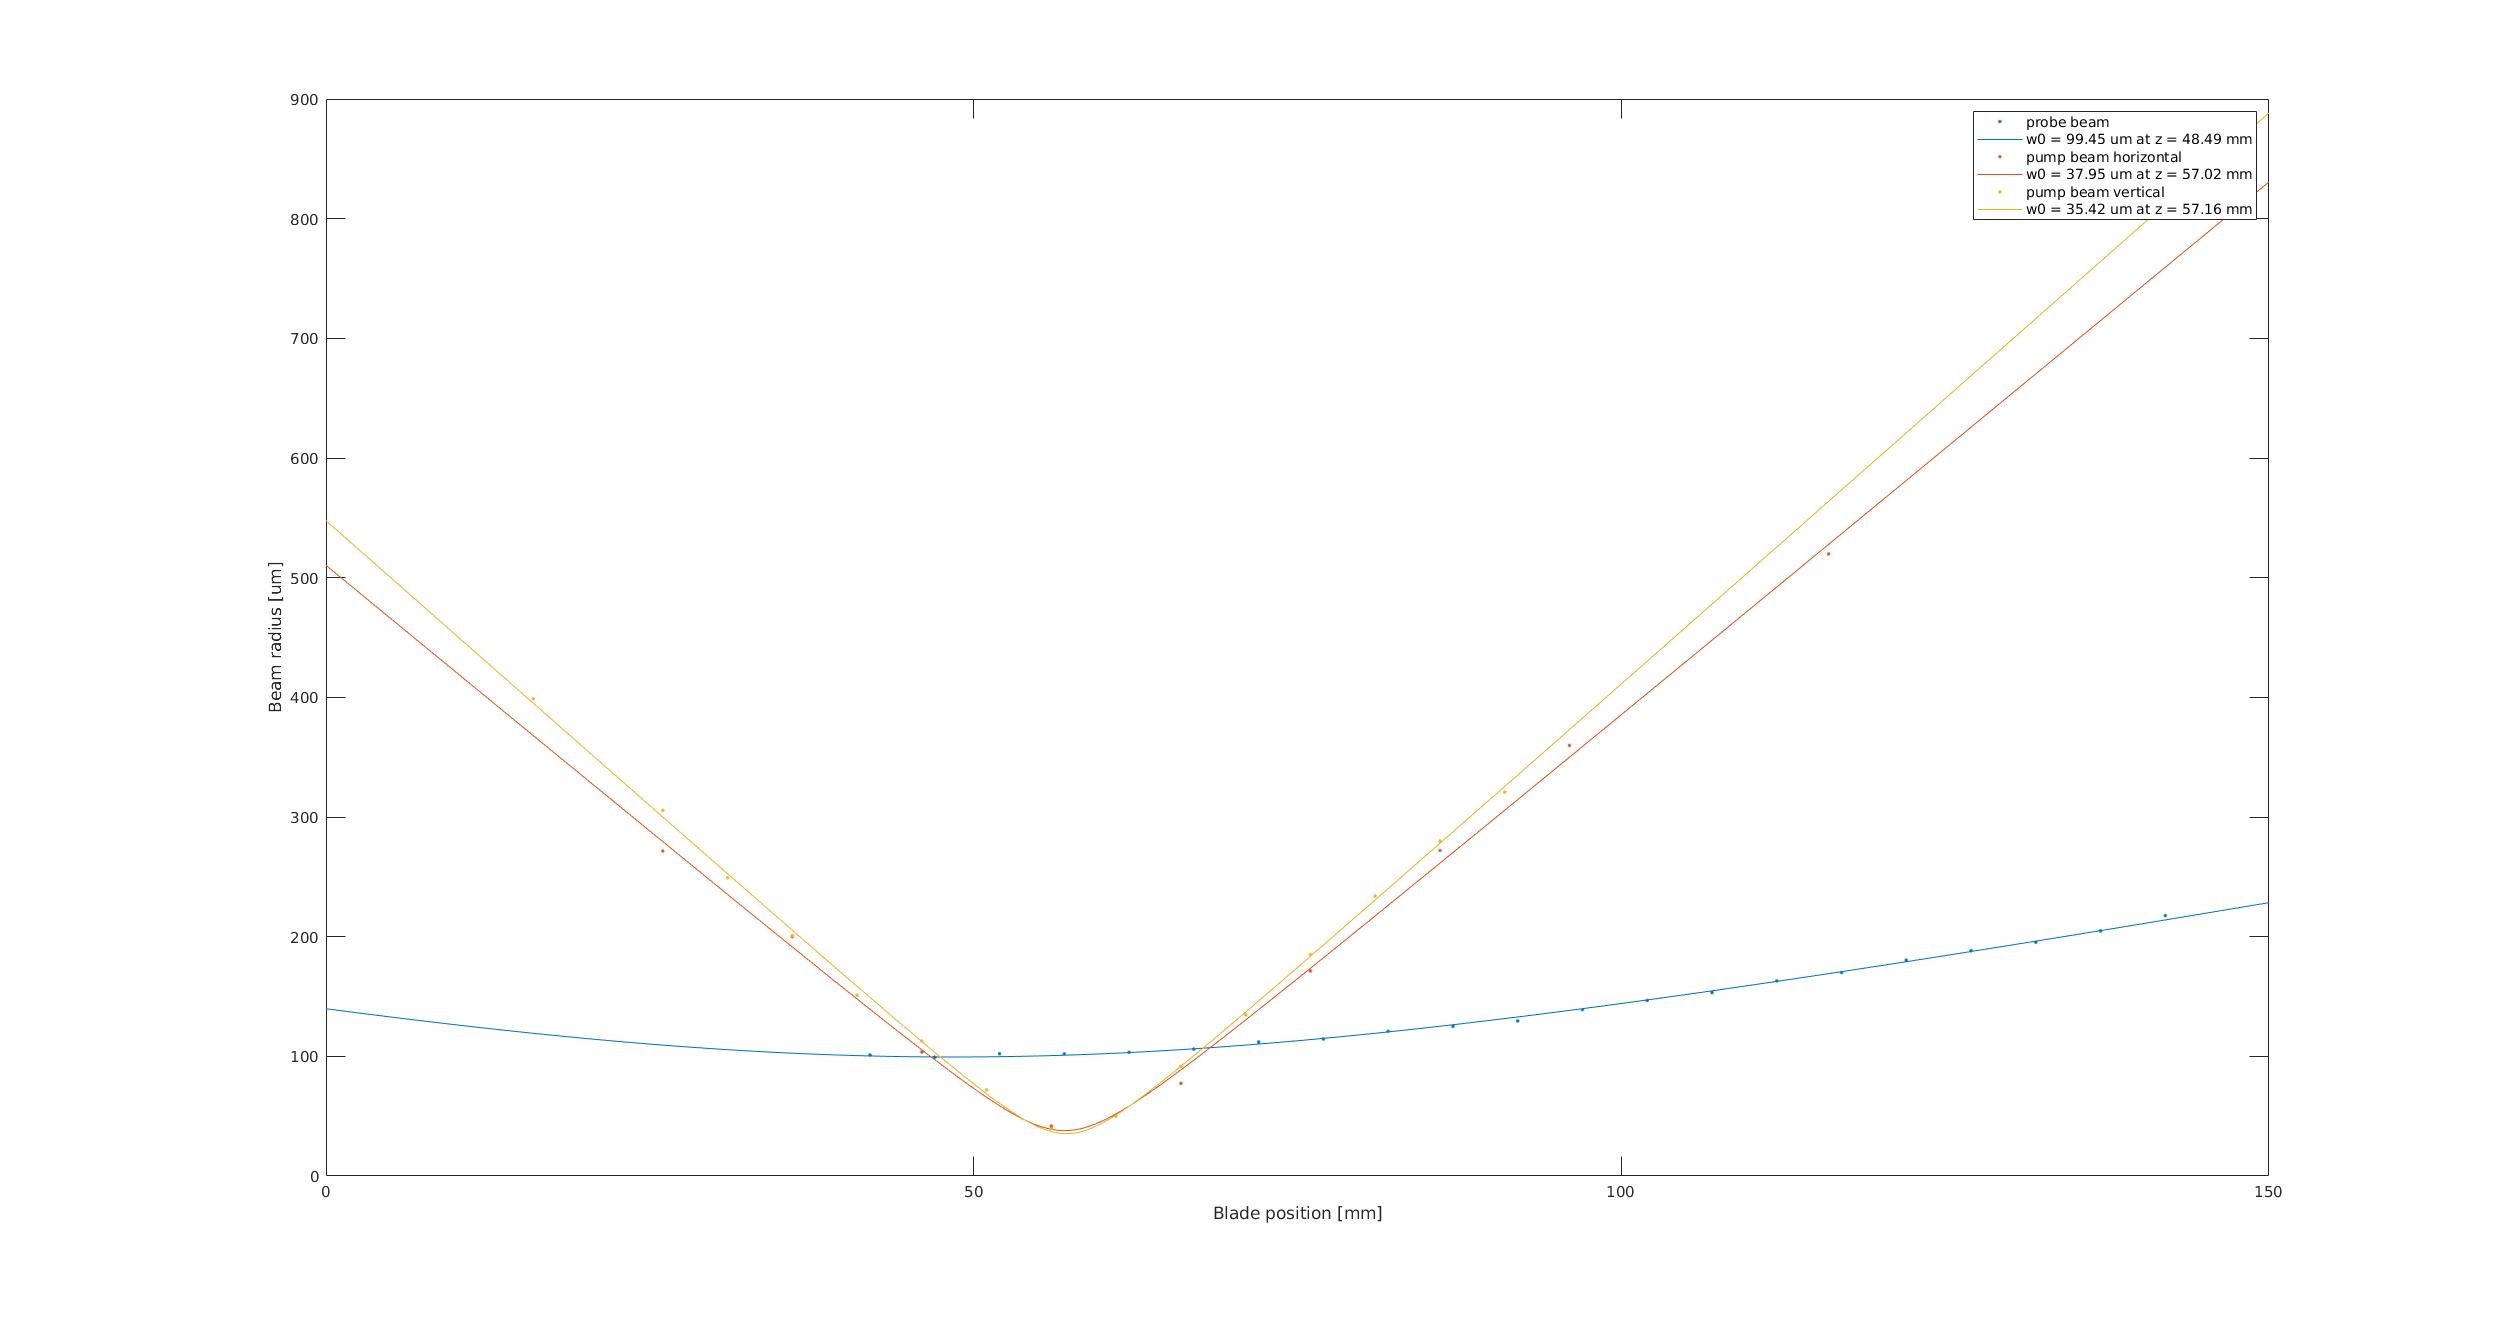
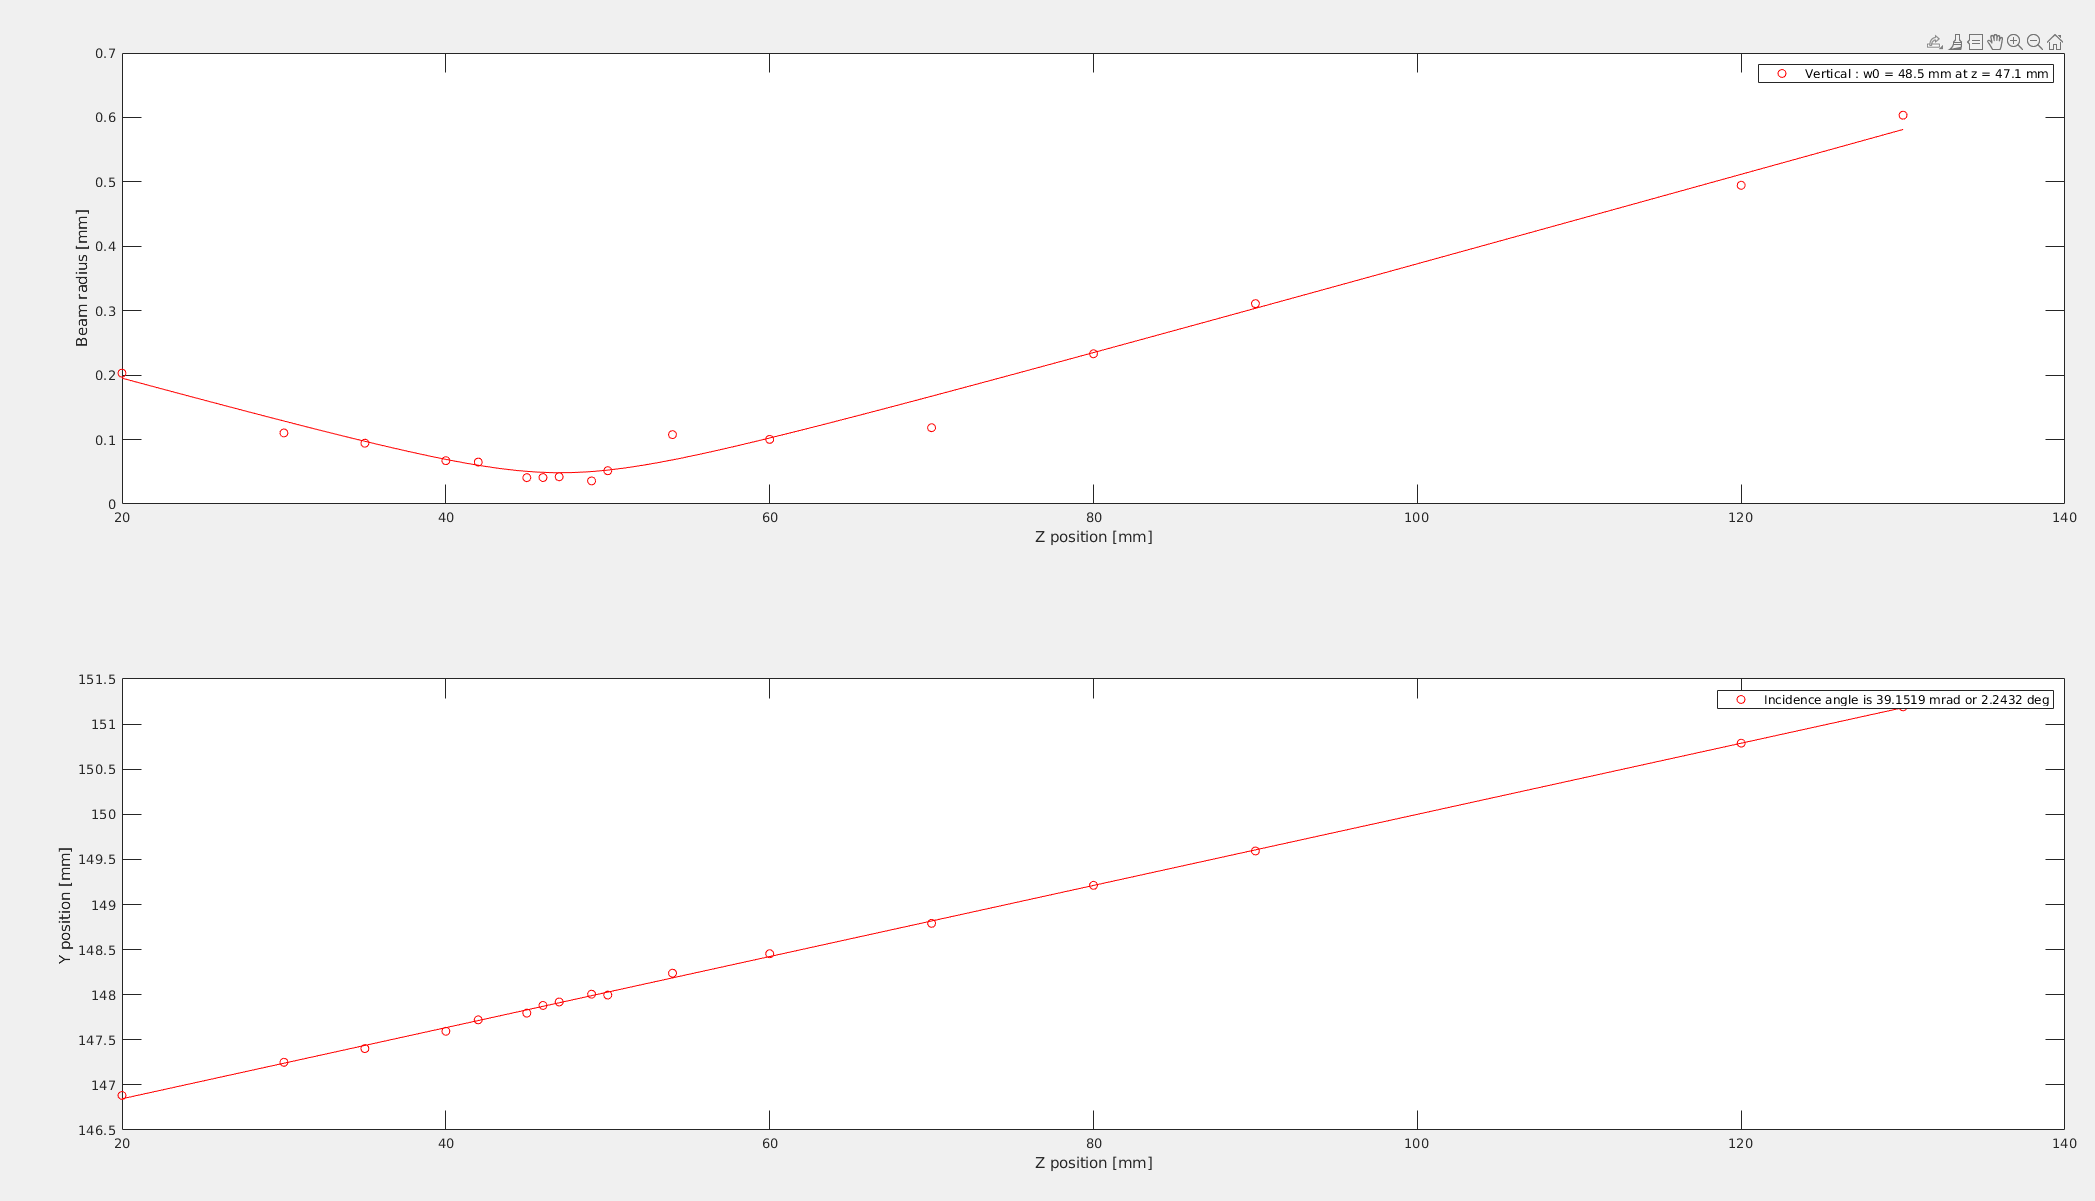
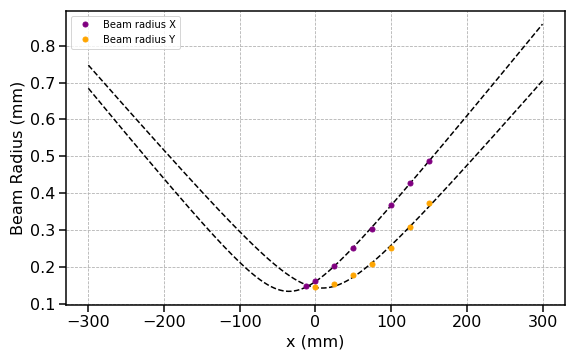
I installed the razor blade cutting the beam vertically and got a pump beam waist of 35 um at z = 58.16 mm (instead of the previous 35.4 um at 57.6 mm) as reported in figure 1.
The plan is to install the surface reference sample 0.56 mm further away (ie at z = 35.56 mm).
Thank you!
I also finished the last 2 measurements in between the 3 previous measurements that are attached to this entry.
Great achievement, Thank you!
Once the new data are ready, we can finish up the paper 
Yuhang and Michael
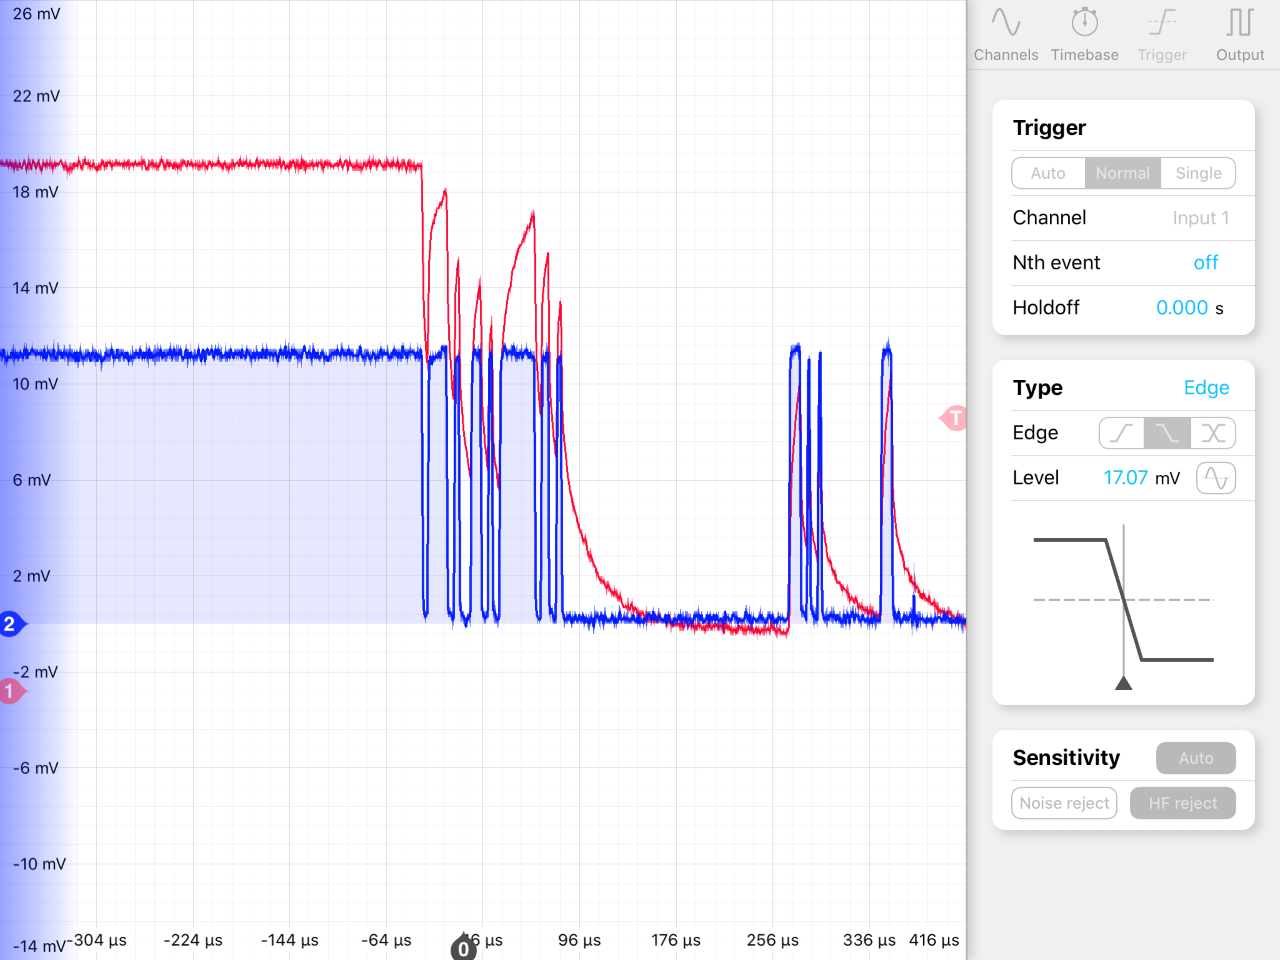
We attempted to measure the OPO ringdown using the new RF switch described in 2865, 2866.
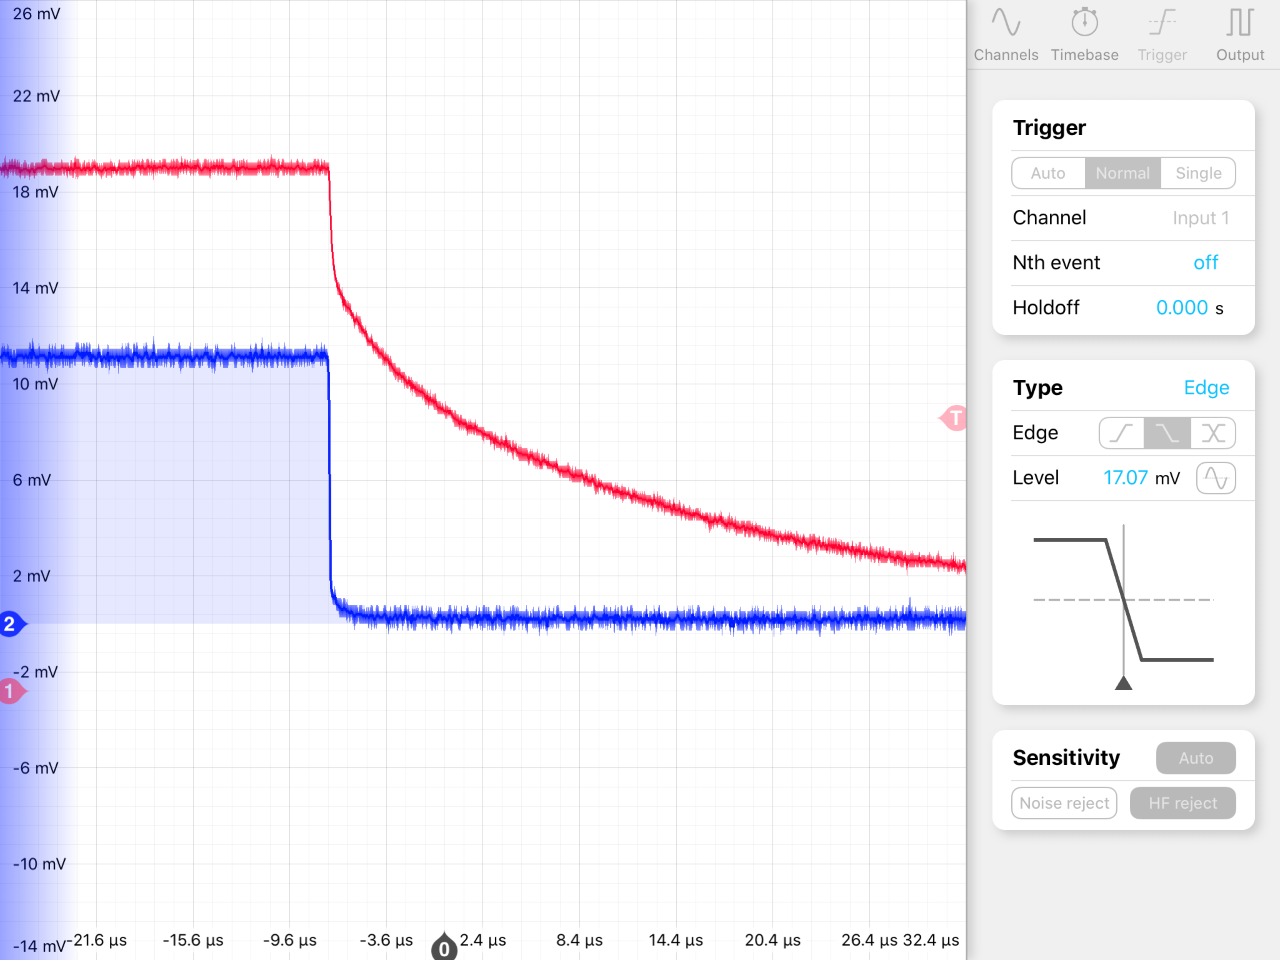
Figure 1 shows the result of the ringdown for the transmission (red) and reflection (blue). The behaviour is a bit strange, so we haven't analysed in detail yet. The reflection ringdown is too fast, while the transmission ringdown starts off too fast and then becomes too slow. As a reminder, we are expecting about 3-4 µs ringdown from calculation. The RF switch is controlled by a 5V 1Hz square wave (i.e. digital logic on/off). Figure 2 shows the result of switching off the switch control manually. The electrical contact bounces and causes the switch to rapidly turn on and off. Normally this result doesn't seem very useful, but even here we can see the reflection ringdown being too fast and the transmission ring down being too slow.
Current mode matching status is:
34 mV TEM00
8.6 mV HOM
5.1 mV HOM
3.9 mV noise floor
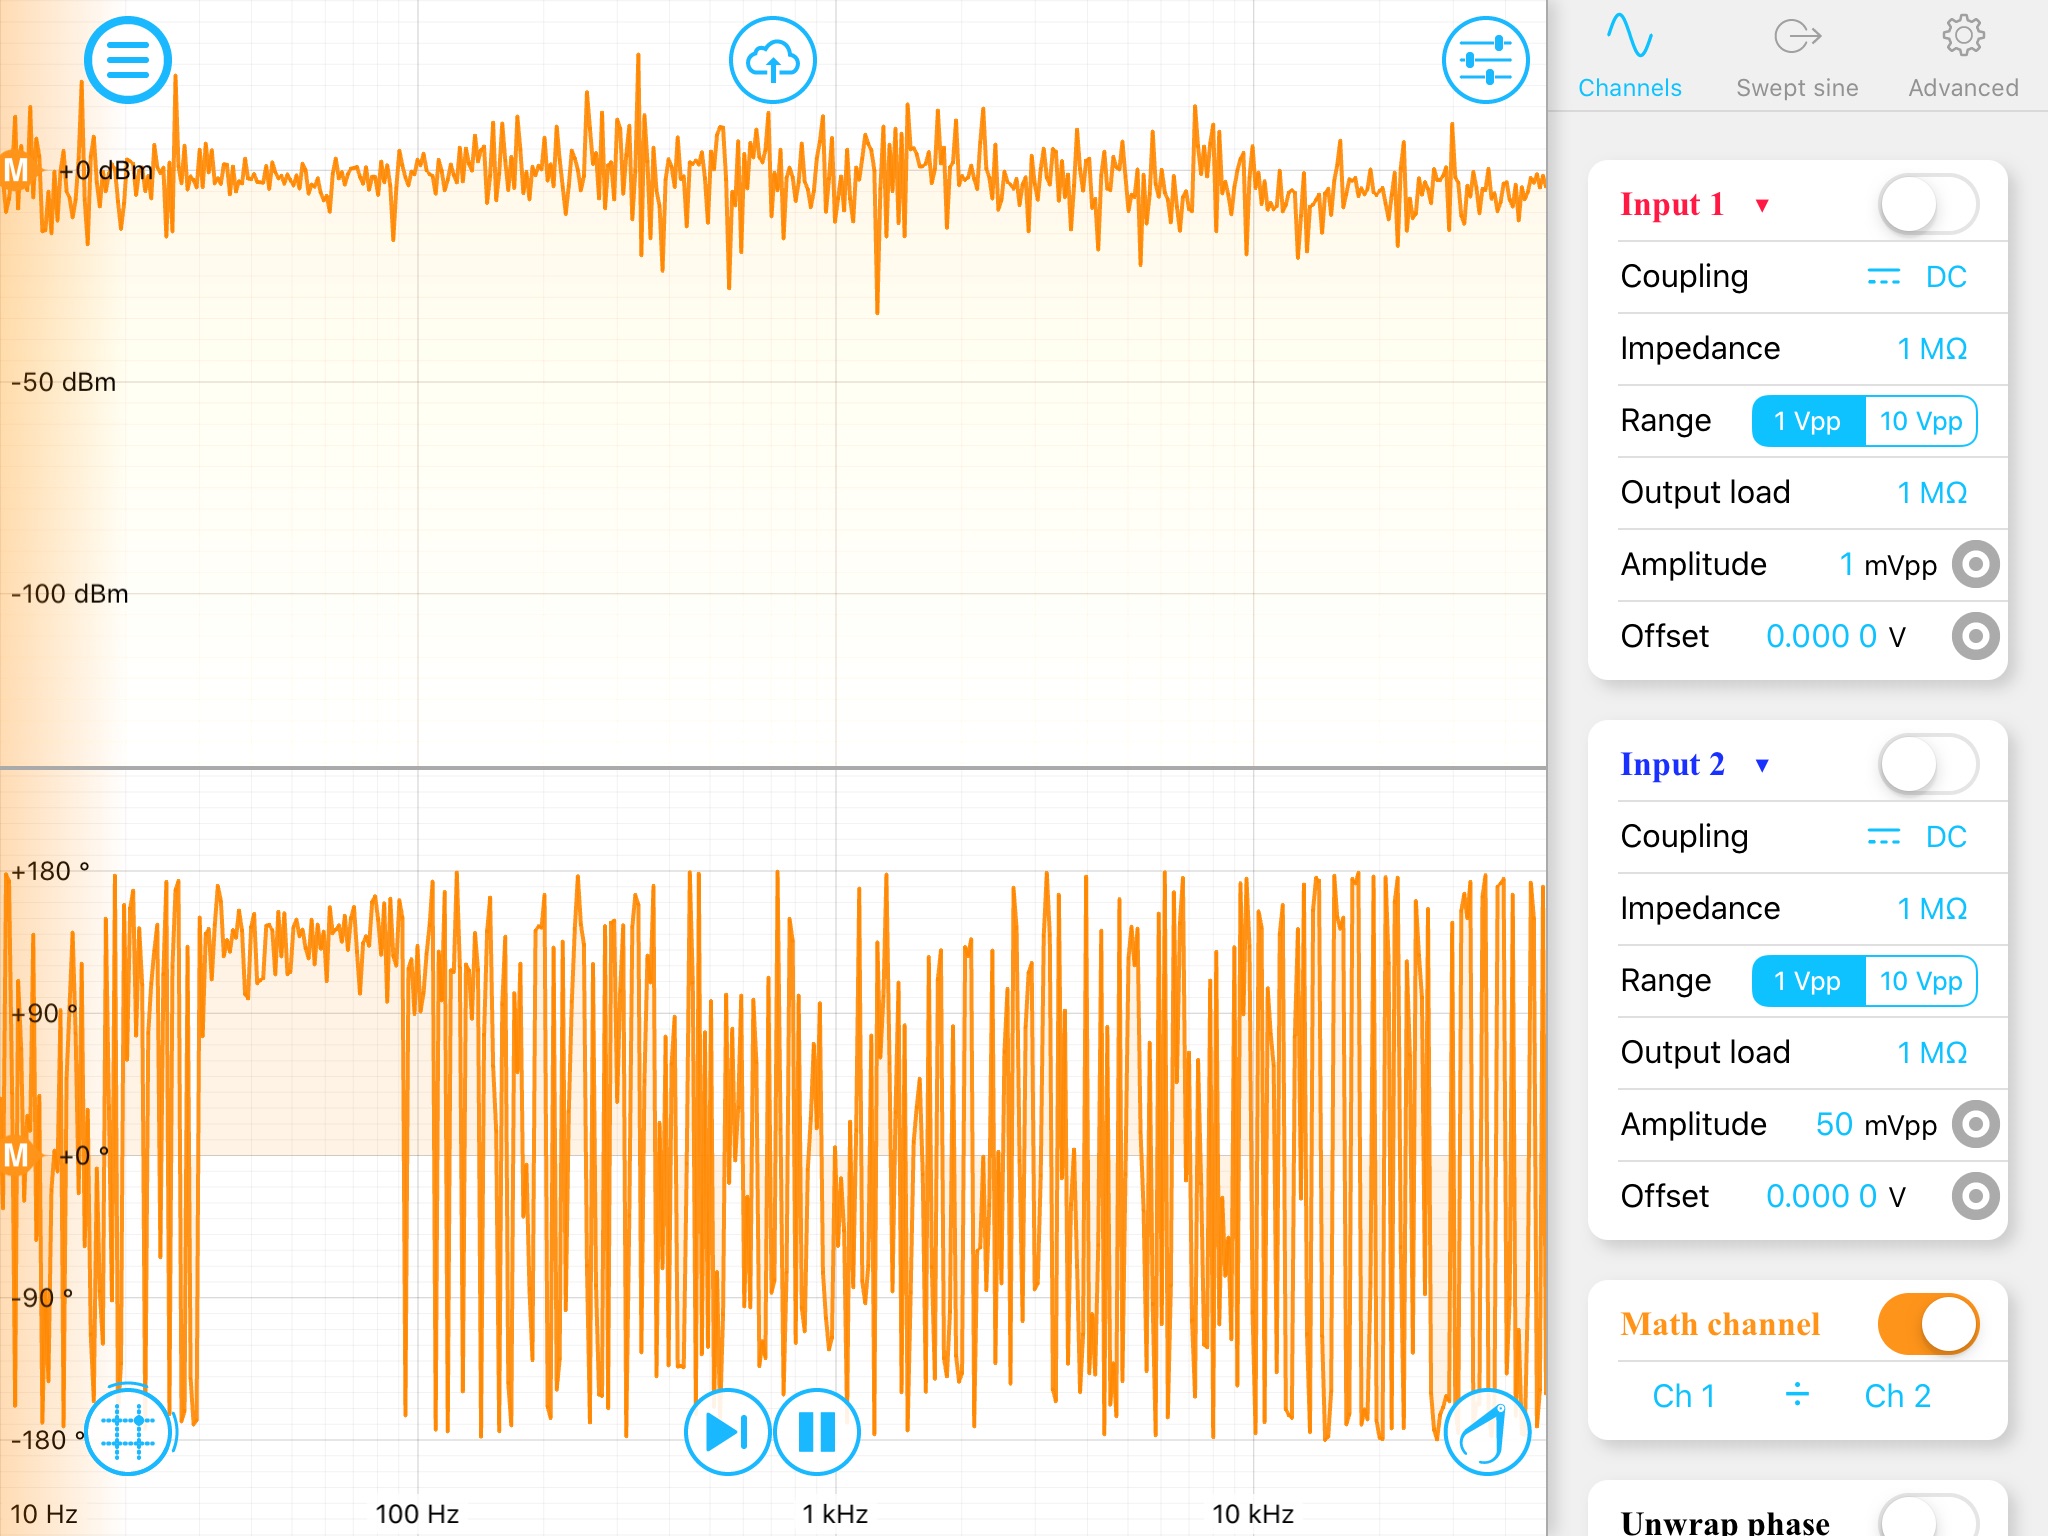
We also attempted to measure the optomechanical transfer function of the cavity. We used Mokulab's Frequency Response Analyzer, taking Mokulab IN1/IN2, with:
Mokulab IN1: Taken from T connected to Source A of SR560. This is the input of the servo before noise injection.
Noise injection: Injected at Source B of SR560, which applies a low pass filter to A - B.
Mokulab IN2: Taken from T connected to 50 Ohm out of SR560 (before PZT high voltage driver). This is the output of servo going to the plant. Thus, IN1/IN2 should be the TF of the plant.
The result is shown in Figure 3. However, it is not very meaningful. The error signal is probably too high versus the noise injection for frequency response analysis.
Yuhang and Michael
We came back to the OPO setup and found the beam was quite misaligned. We could not really reduce the presence of a certain higher order mode (15 mV vs 65 mV total mode power). The PZT also seemed to be drifting a lot even though the temperature was controlled.
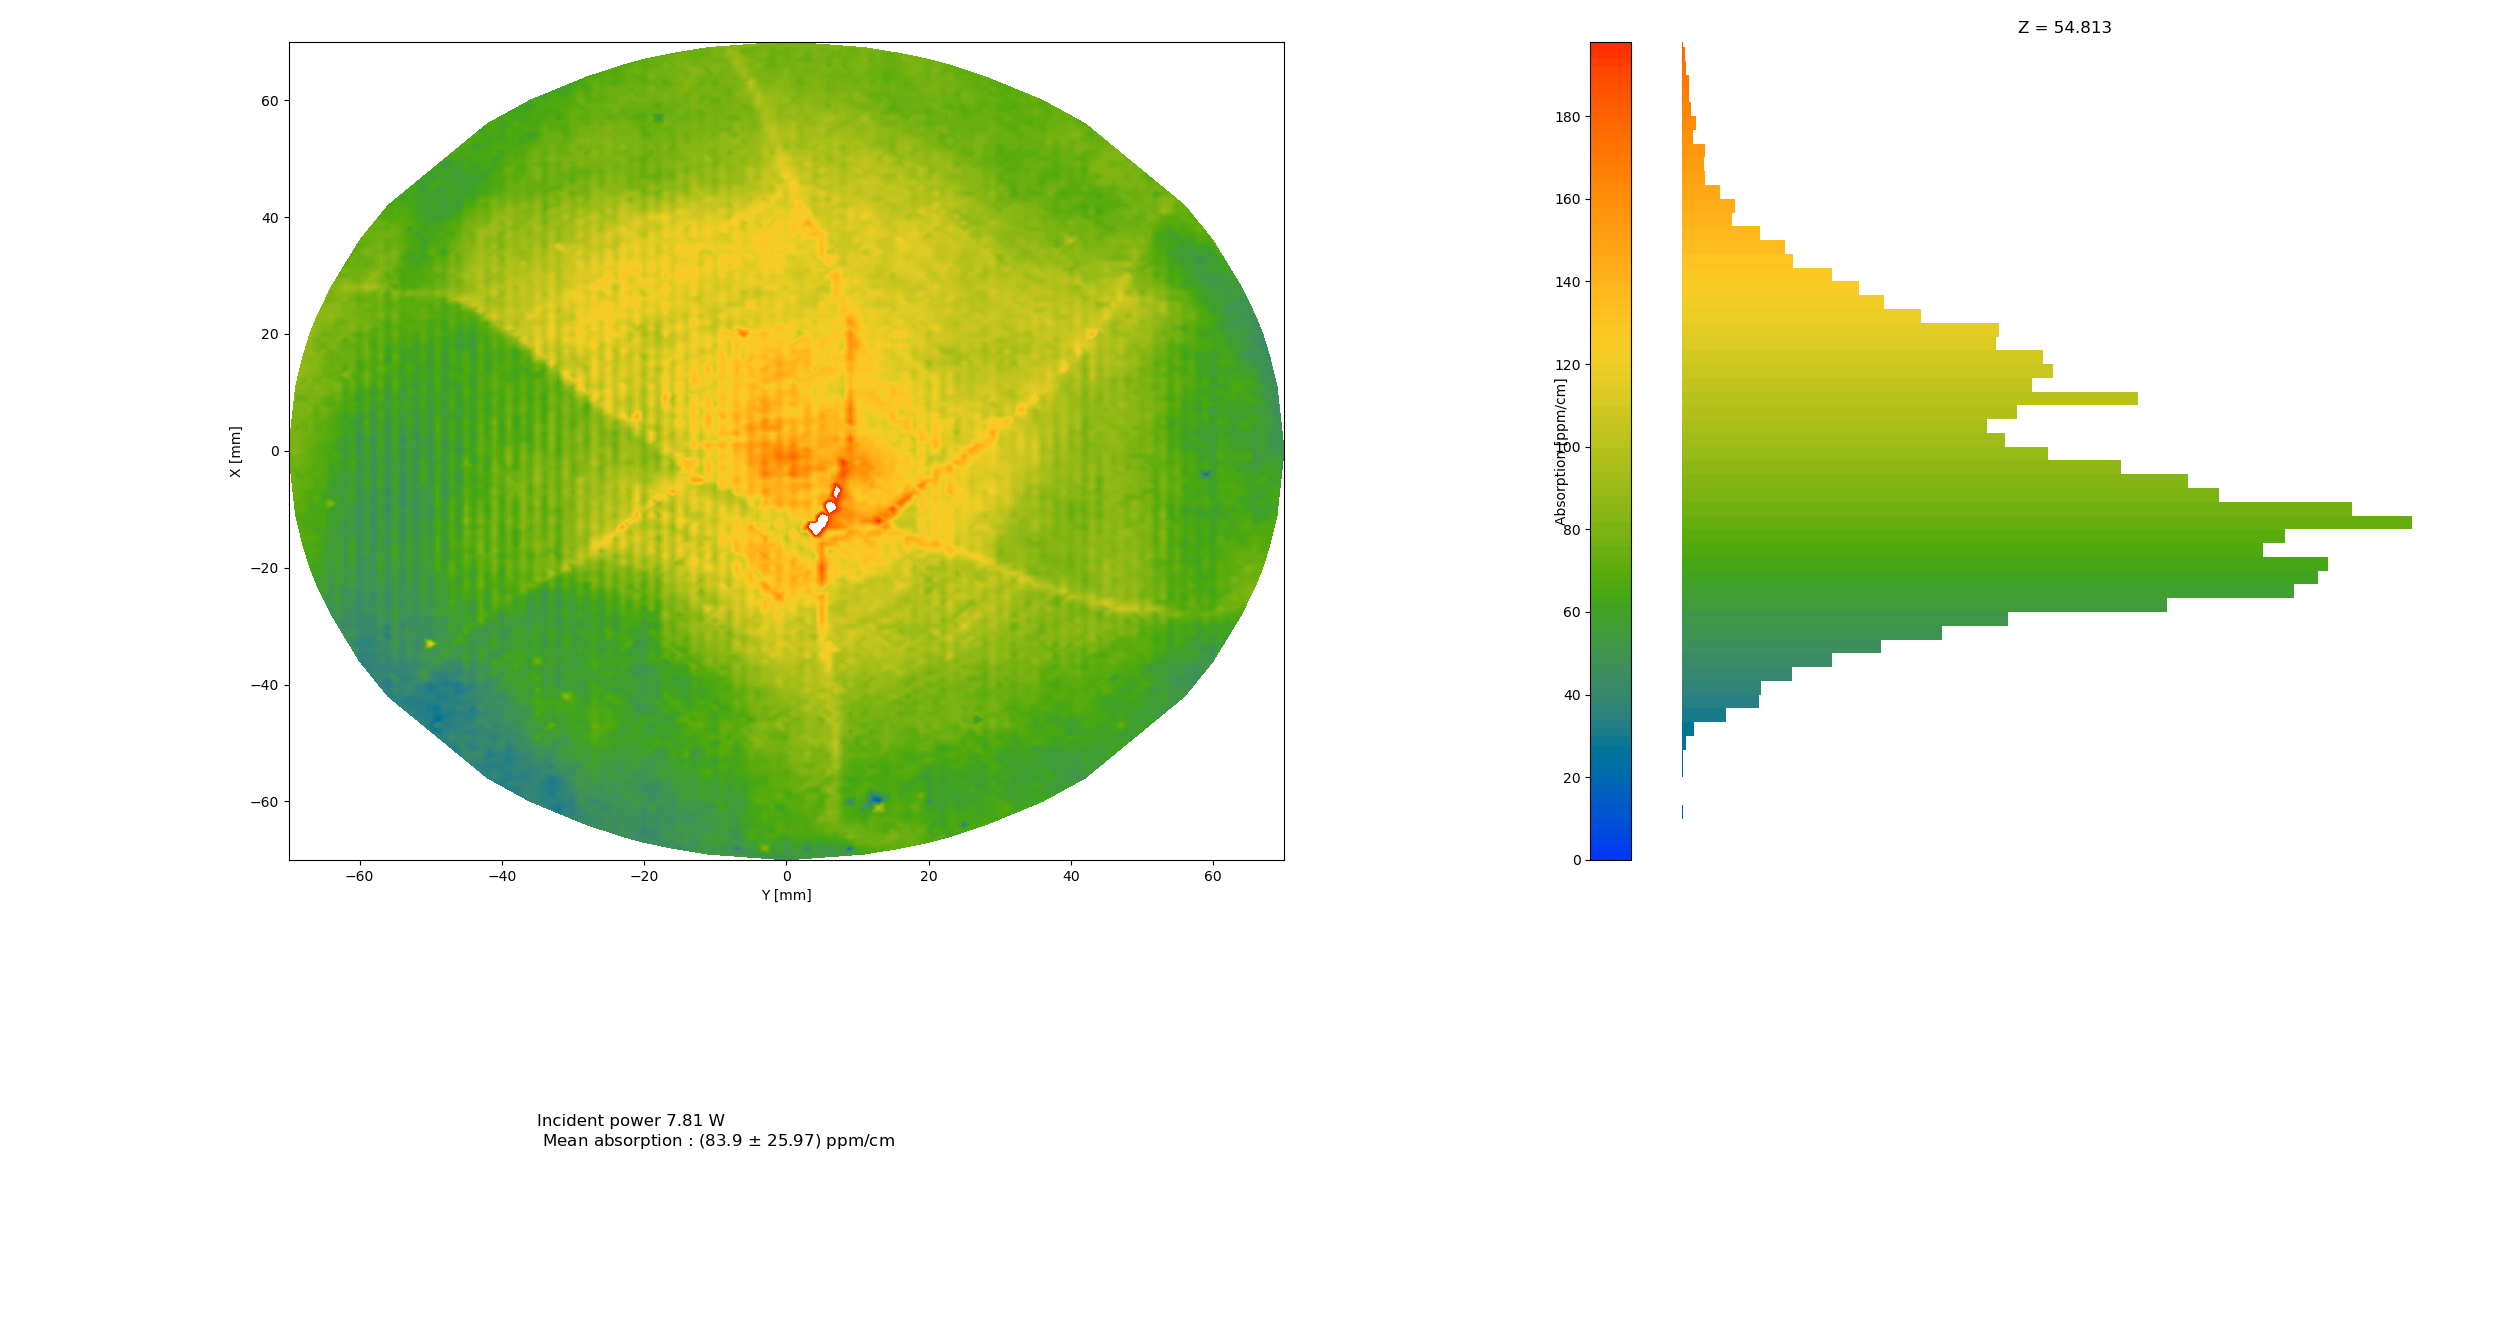
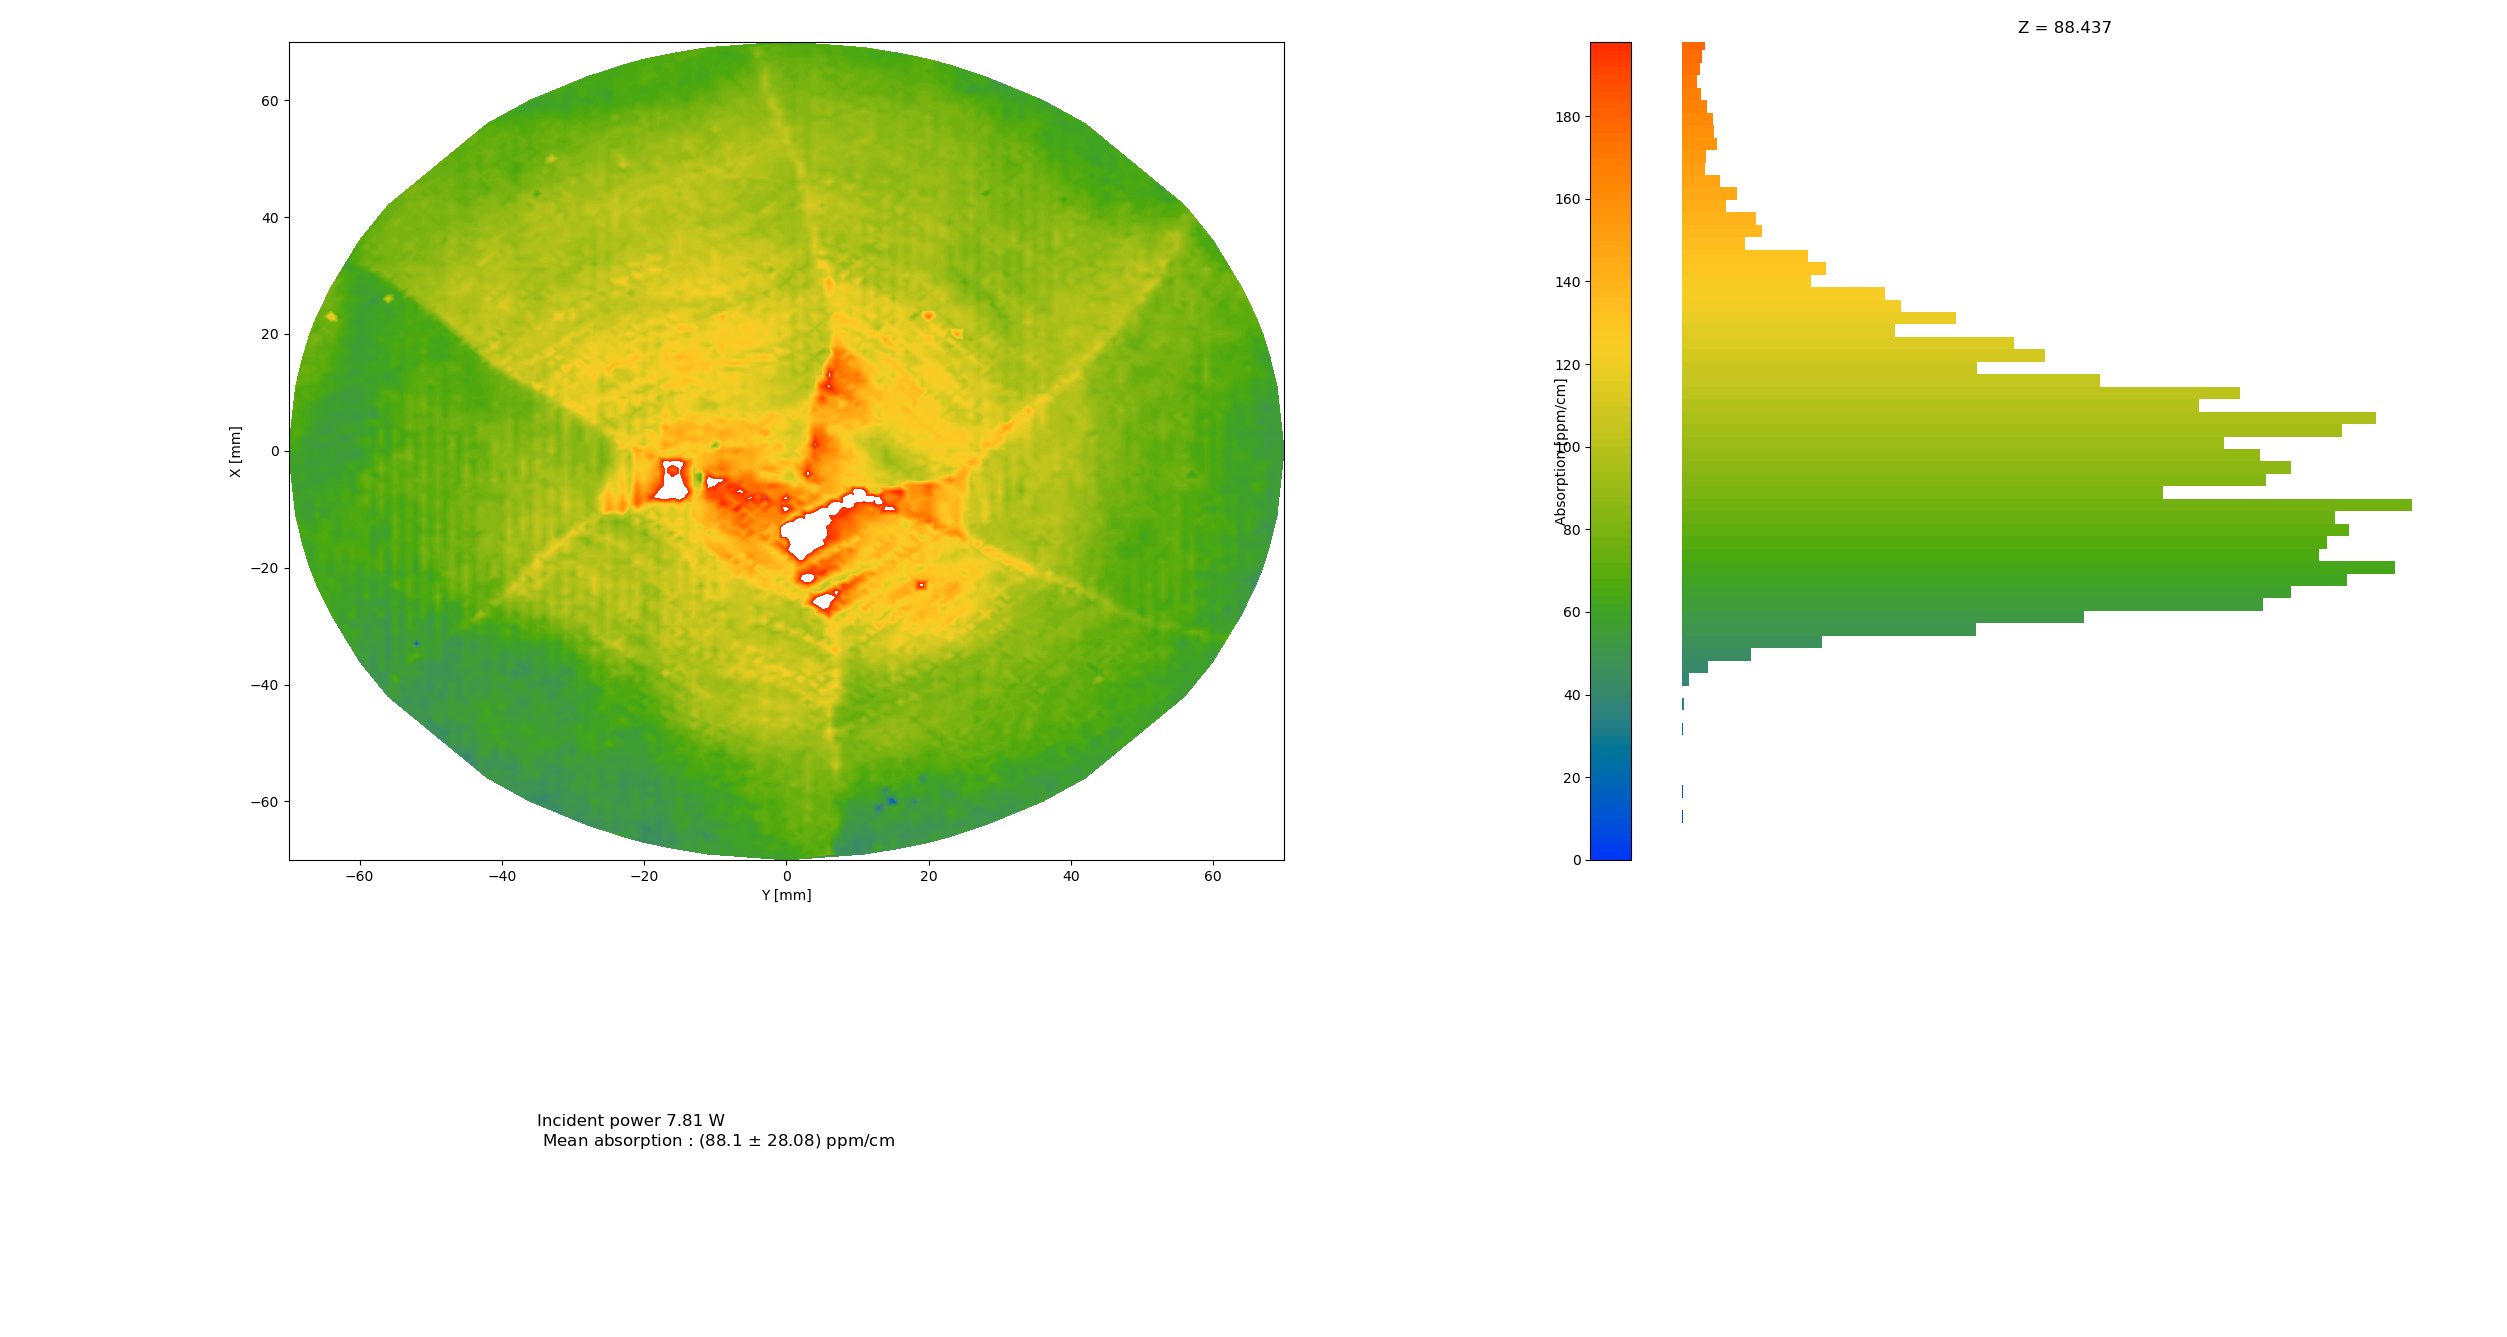
We finished the first 3 measurements taken at the same positions as in Caltech ie at the mirror center, 10 mm after the first surface and 10 mm before the second one.
The results are attached to this entry and compatible with their measurements (and therefore also with Manuel's ones).
So we started absorption measurements in between these positions to get more data for the integrated map along z.
Today I reinstalled the reference samples and checked the proper positions.
With the surface sample I got the crossing point at z = 35 mm (maximizes AC) and z_IU = 68 mm (maximizes AC/DC).
I measured R_surface = 16.91/W and R_bulk = 0.6212 cm/W.
I installed back SHINKOSHA 7 and did a long z scan.
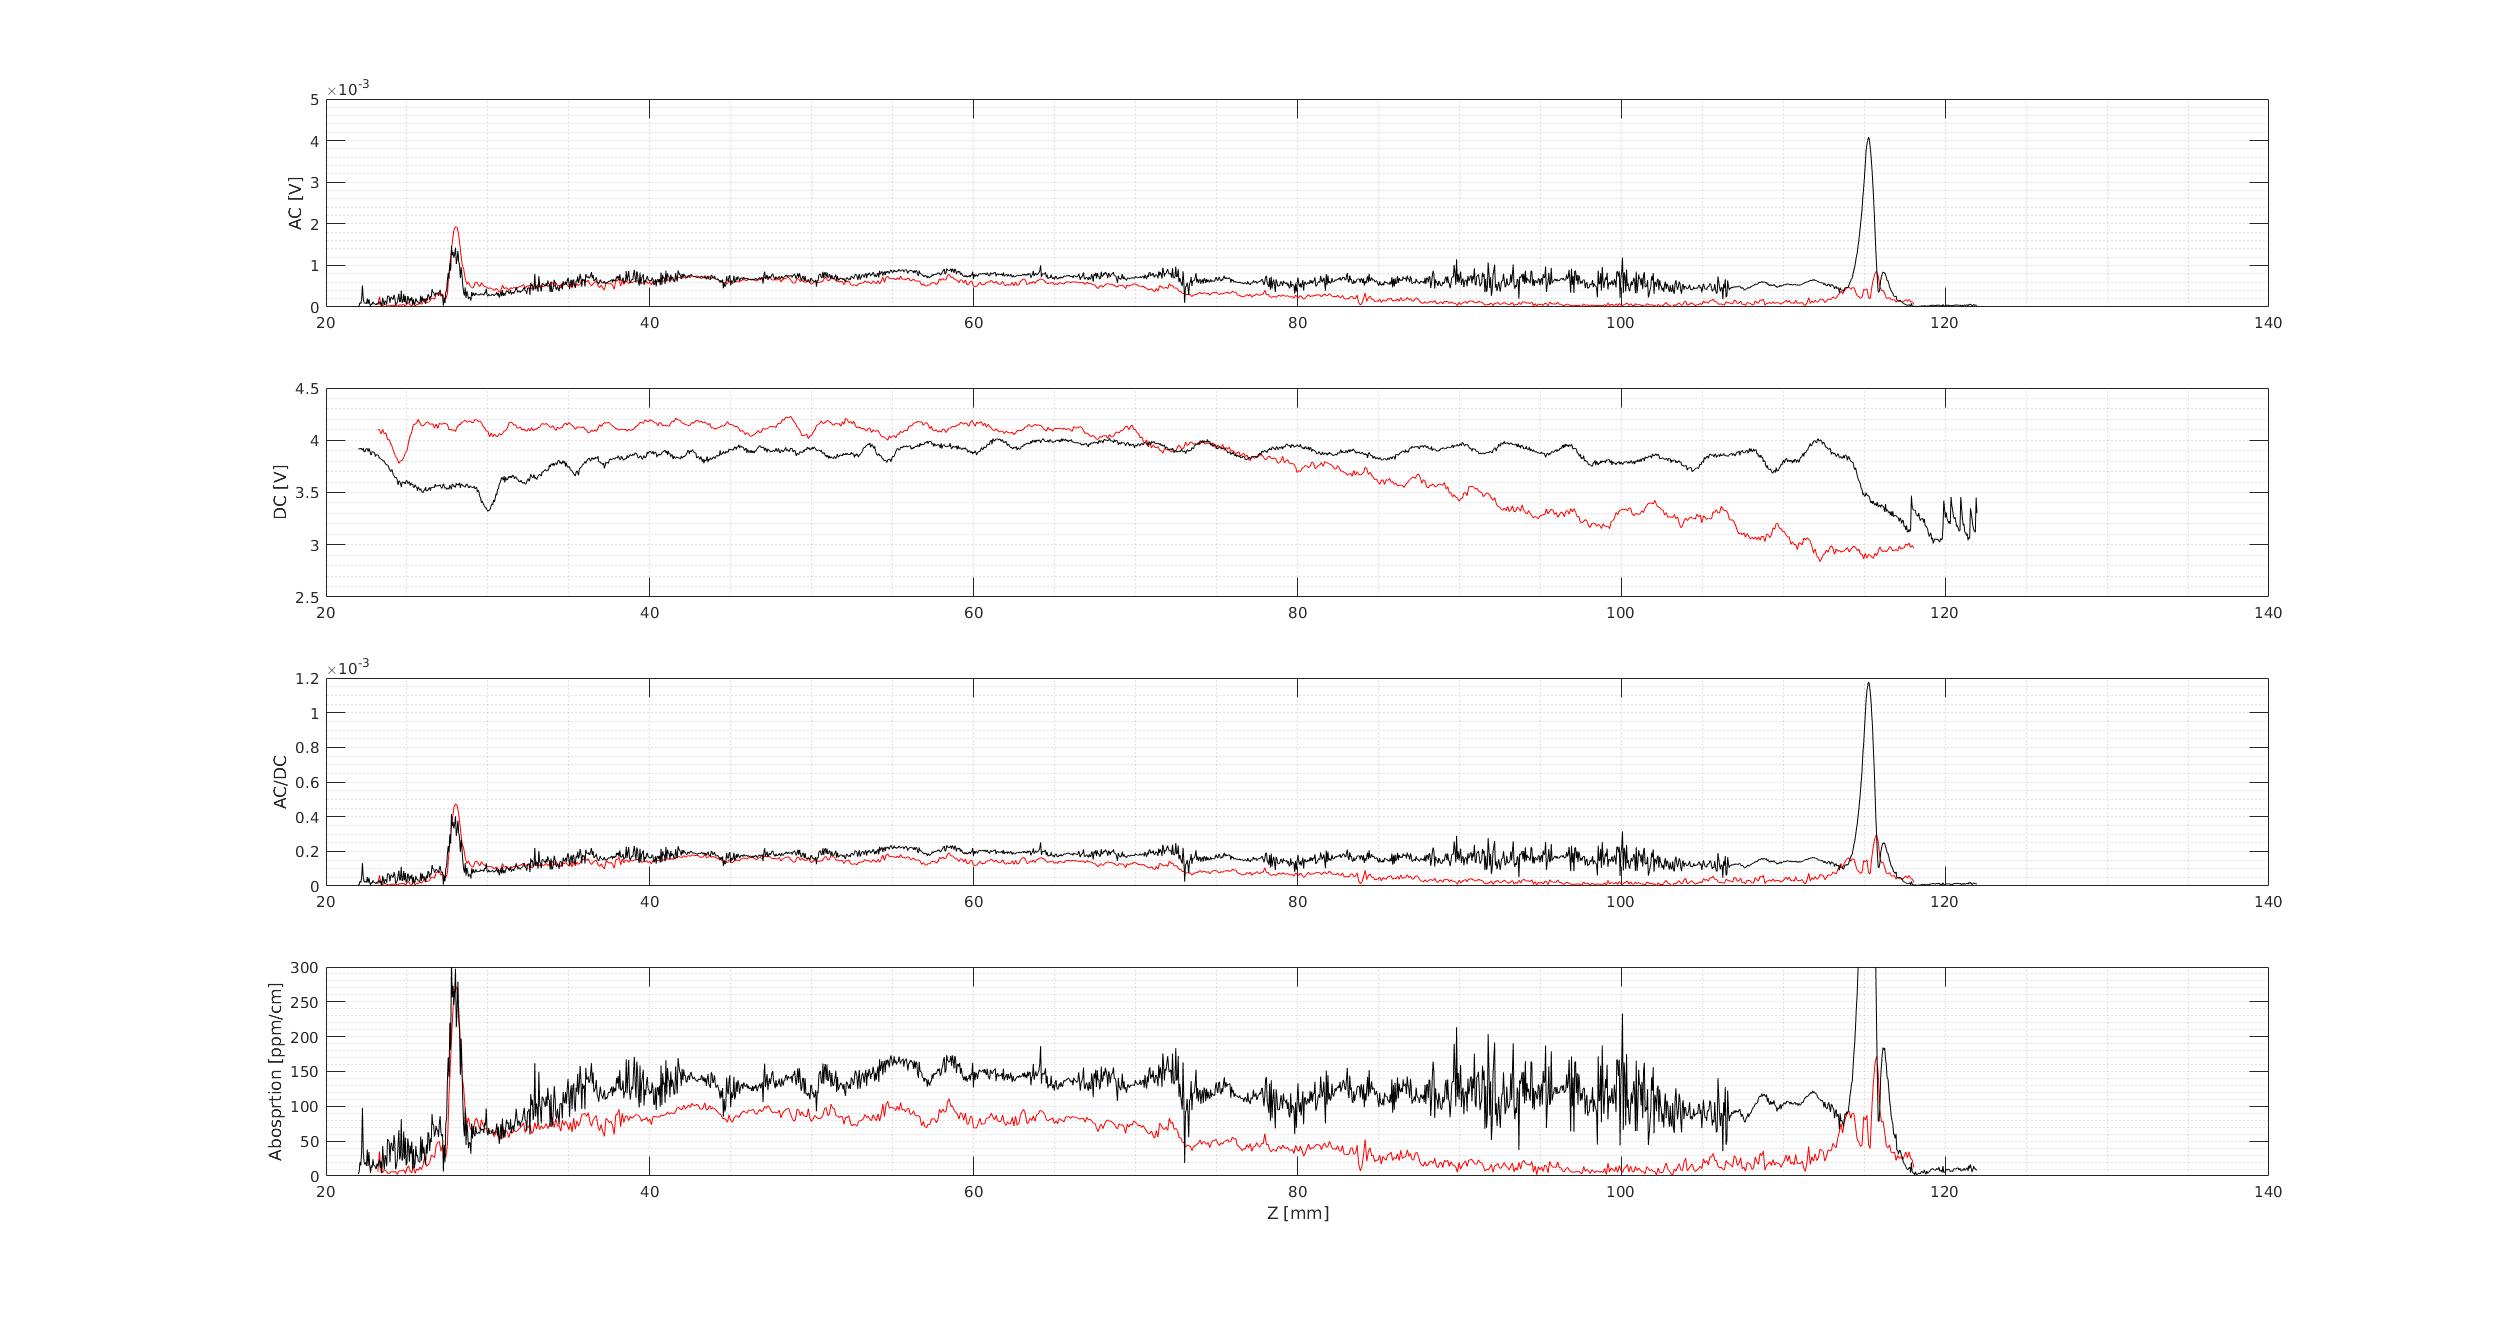
In the attached figure you can see the comparison between various signals for the previous long z scan (red) and current situation (black) taken at the mirror X and Y centers.
Note that the z axis has been shifted for the red using the surfaces signal and then interpolated to the new measurement (step size of 0.05 mm instead of 0.1 mm).
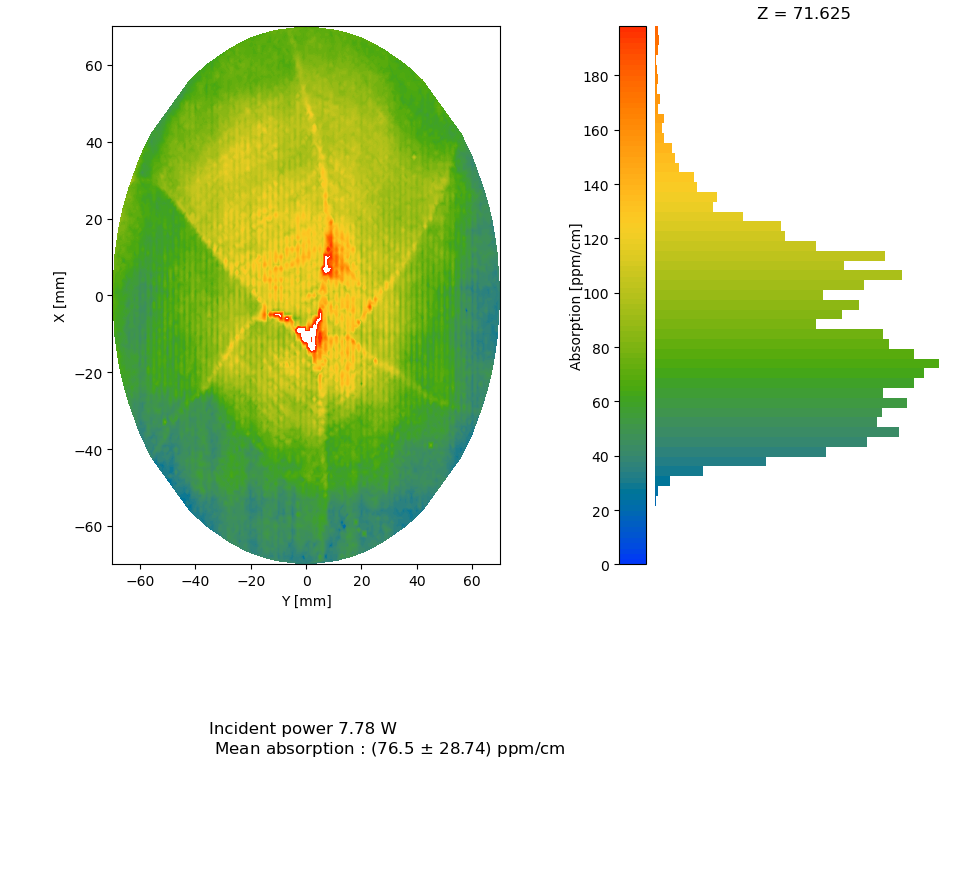
As expected, the absorption is larger now and it seems that we have something like at least a factor 1.4 increase.
However, I was expecting to see a somehow constant increase but this is not the case..
I started a XY absorption measurement at the mirror center (ie X = 399.08mm, Y = 122.175 mm and Z = 71.625 mm)
We finished the first 3 measurements taken at the same positions as in Caltech ie at the mirror center, 10 mm after the first surface and 10 mm before the second one.
The results are attached to this entry and compatible with their measurements (and therefore also with Manuel's ones).
So we started absorption measurements in between these positions to get more data for the integrated map along z.
Great achievement, Thank you!
Once the new data are ready, we can finish up the paper
Thank you!
I also finished the last 2 measurements in between the 3 previous measurements that are attached to this entry.
Katsuki, Marc
This is a summary of these past days activities.
As reported in entry 2863 we found out that the pump beam was larger than expected (48.5 um instead of 36 um).
In summary we had to act on the two lenses on the pump beam path to recover the good beam size and position following Jammt simulations.
These 2 lenses are now about 1 cm closer to the laser source.
During this realignment we also checked the the probe beam size to have a reference waist position.
We found out that it is not feasible to use the absorption DC photodiode together with the razor blade because there is scattering when we start to cut the beam that creates a spikes in the data and prevent a good fit of the data.
Furthermore, the probe beam is really large on this photodiode and is really astigmatic when setting up the imaging unit translation stage at z_IU = 0 mm (ie farthest from the translation stage).
In the end, we installed a power-meter in between the imaging unit lens and sphere and could get good data.
We also found out that a good step size for the translation stage is 20 um as it allows to get good enough resolution while not taking too long.
The attached figure reports the beam profiles of probe beam in vertical and pump beam in both vertical and horizontal directions.
The z axis is the same as Manuel's measurement (see elog 1089) ie the 0 mm is at 75mm from the breadboard.
We had to tweak a bit the tilt of the lenses to minimize the pump beam astigmatism.
We recovered the expected pump beam waist size and position so we will now switch to absorption measurement.
Note that probe beam power is 2.5 mW and pump beam power was about 150 mW for this measurement.
Nishino
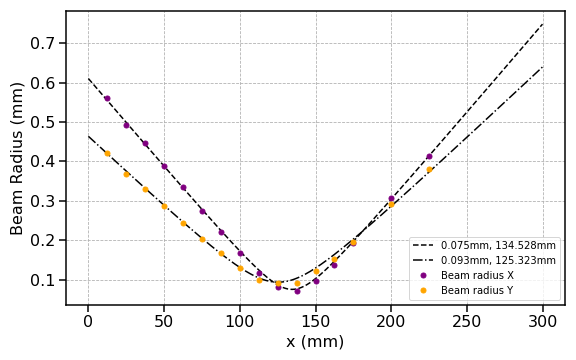
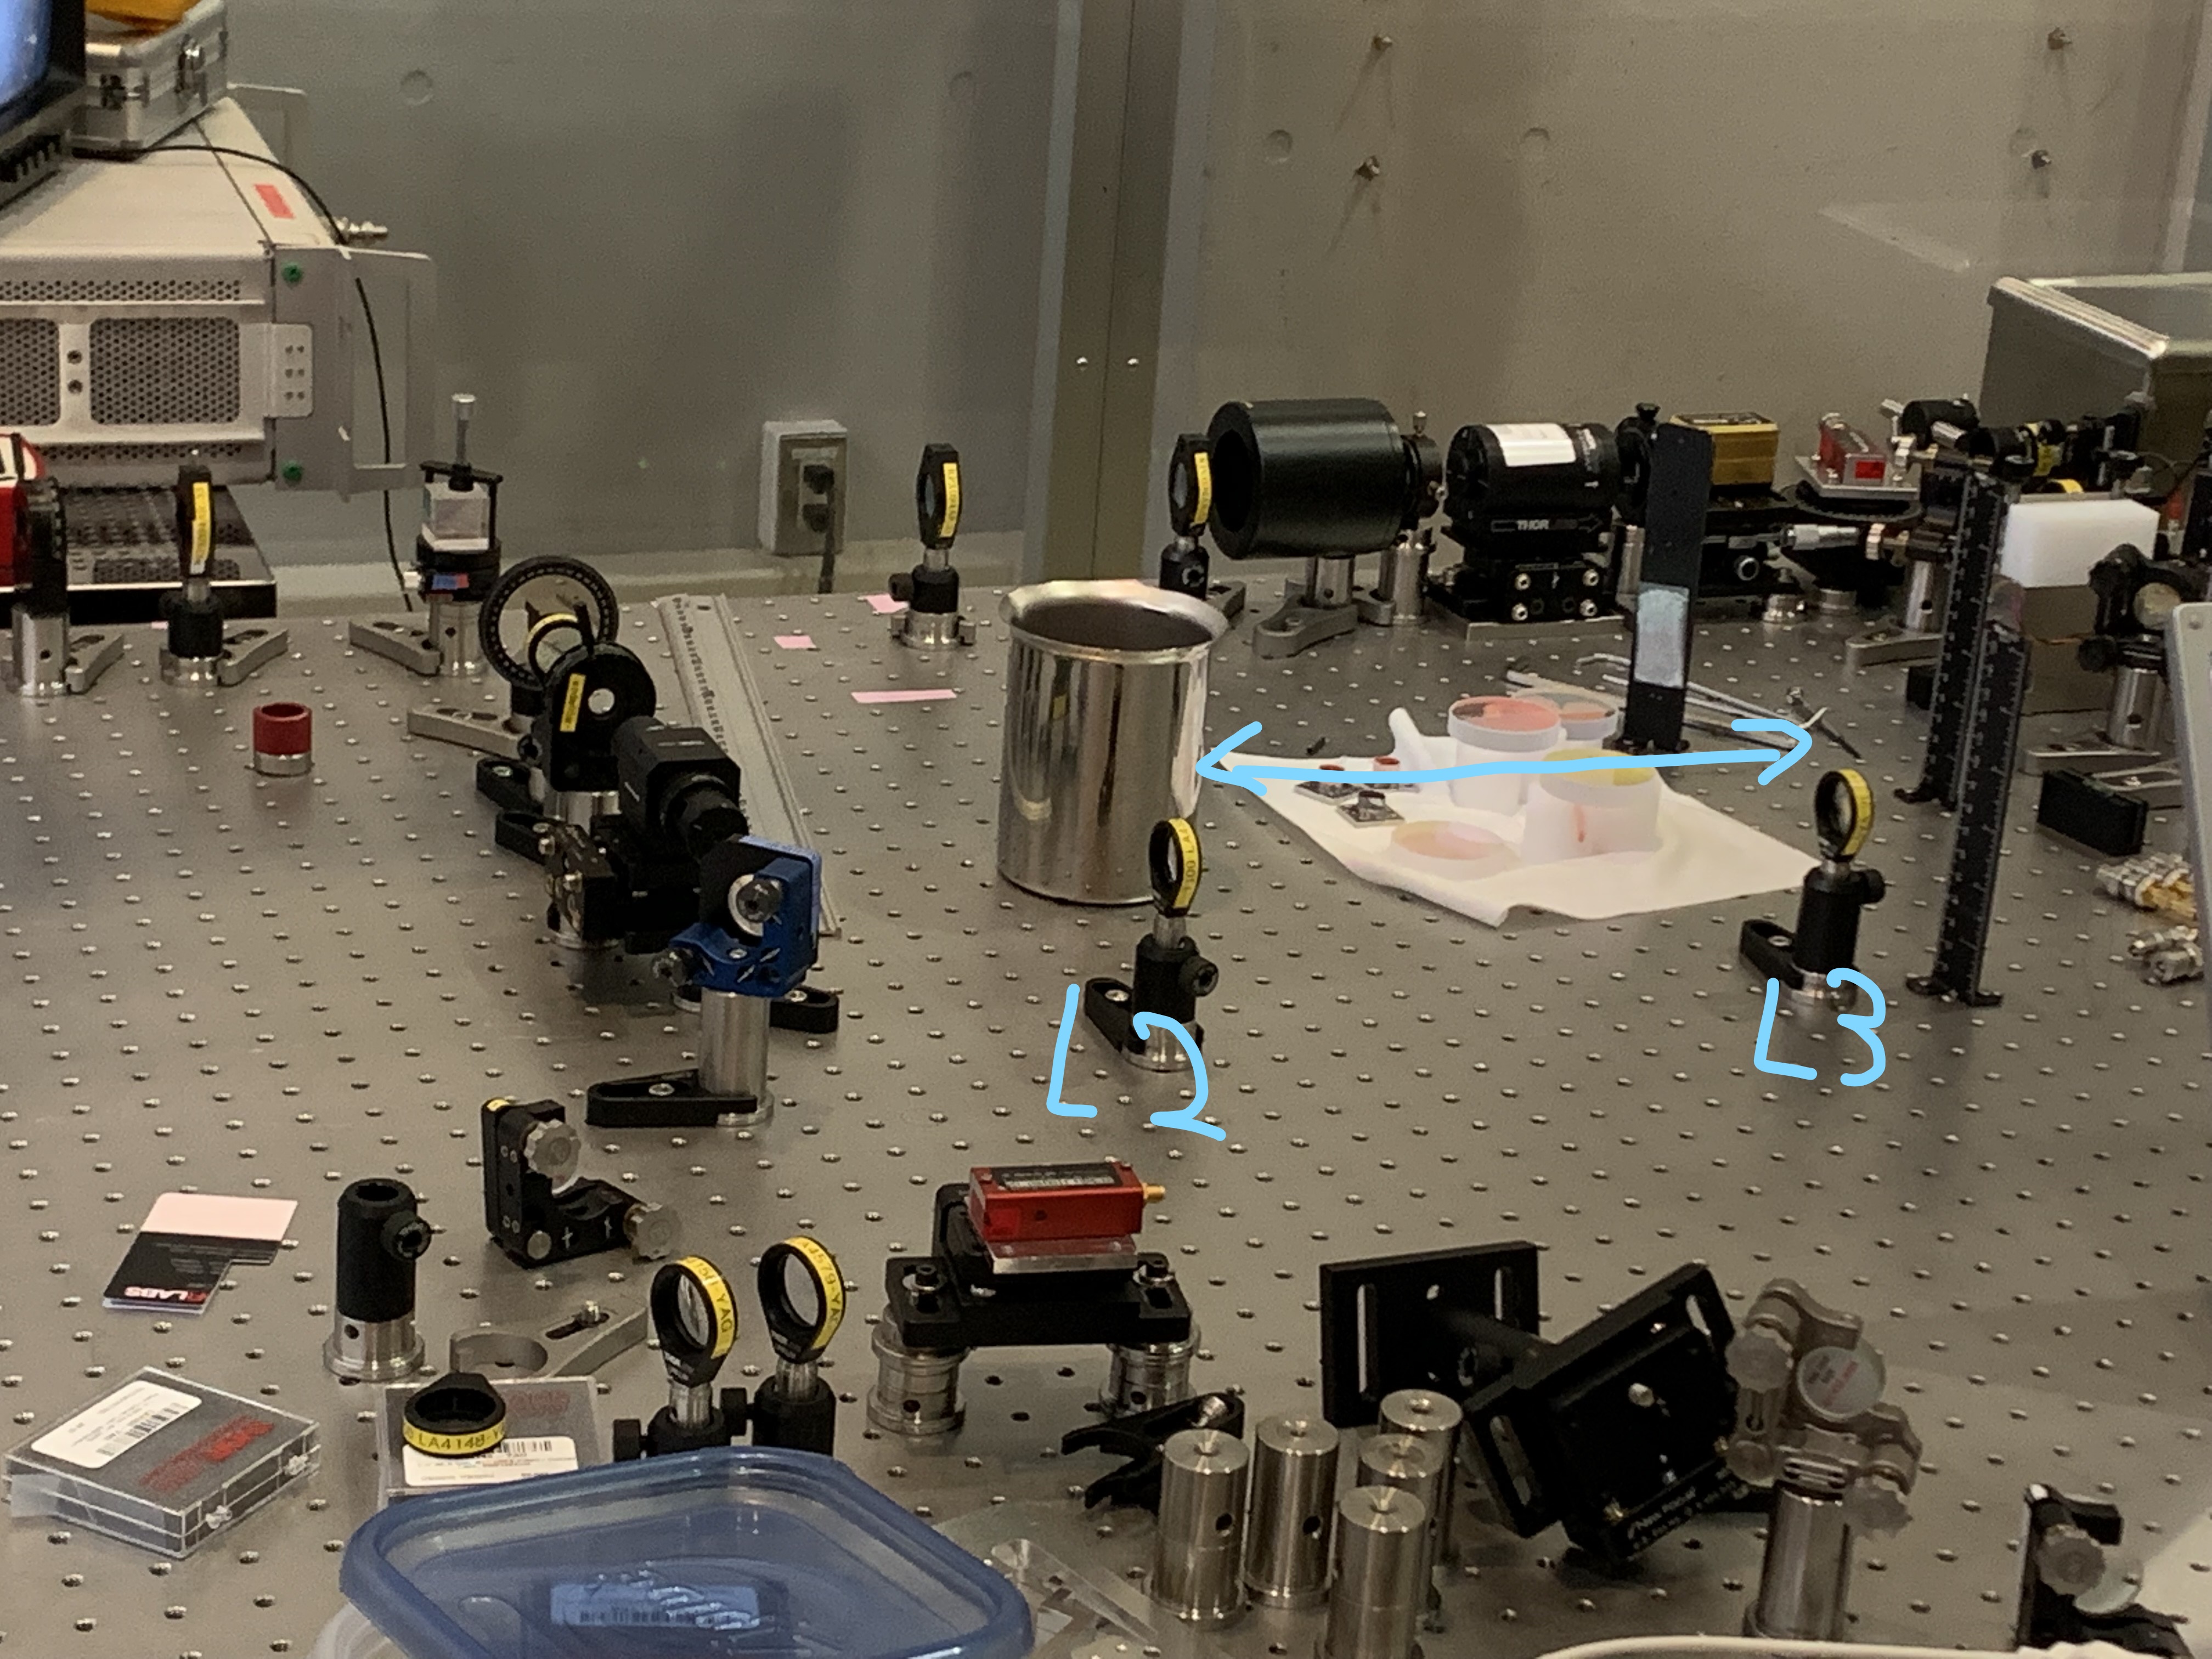
I measured the beam profile between L2 and L3. I got better results than the previous one (see 2856).
| waist size | waist position* | |
| x | 0.075 mm | 134.5 mm |
| y | 0.093 mm | 125.3 mm |
*starting position is 25 mm away from L2.
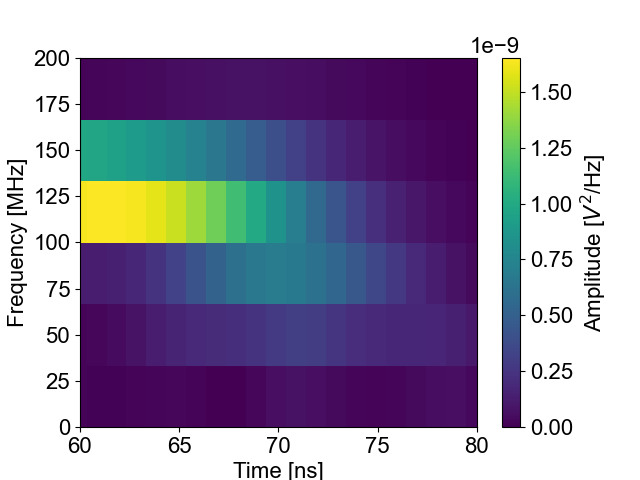
Taking the first 30ns of measurement data, I did a FFT analysis of the data and got a power spectrum density (PSD). Then the time span is shifted by 1ns several times to get the PSD evolution. In total, the 200ns data is shifted by 170 times to get the signal PSD change as a function of time. This is shown in attached figure one.
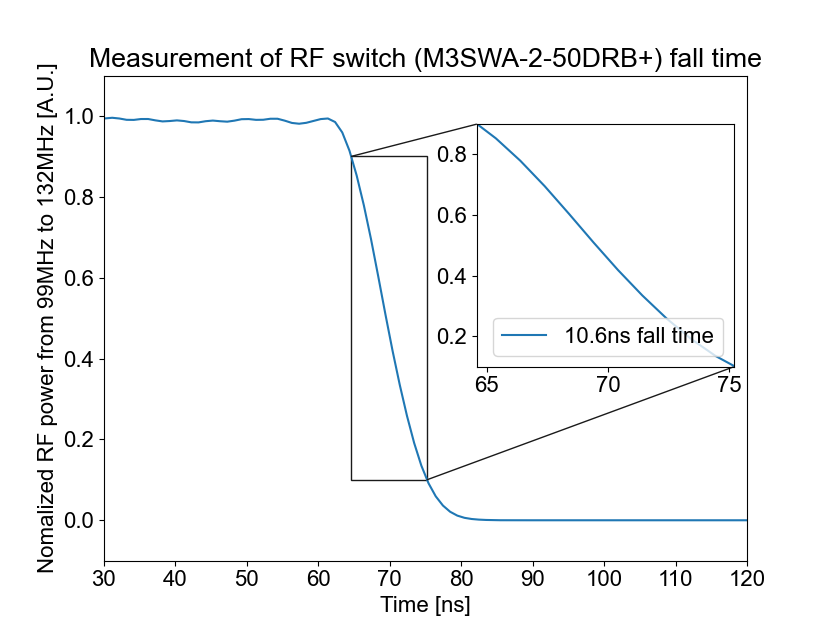
The FFT has a bandwidth of 33MHz (since I used 30ns to make a FFT). Because the RF signal has a frequency of 110MHz, I took the frequency span of 99-132MHz to check the amplitude of RF switch output.
From this analysis, the fall time, which is the time that signal drops from 90% to 10%, is 10.6ns.
In addition, I also put a time-frequency-amplitude plot of this signal.
Pierre Prat (remote), Yuhang and Michael
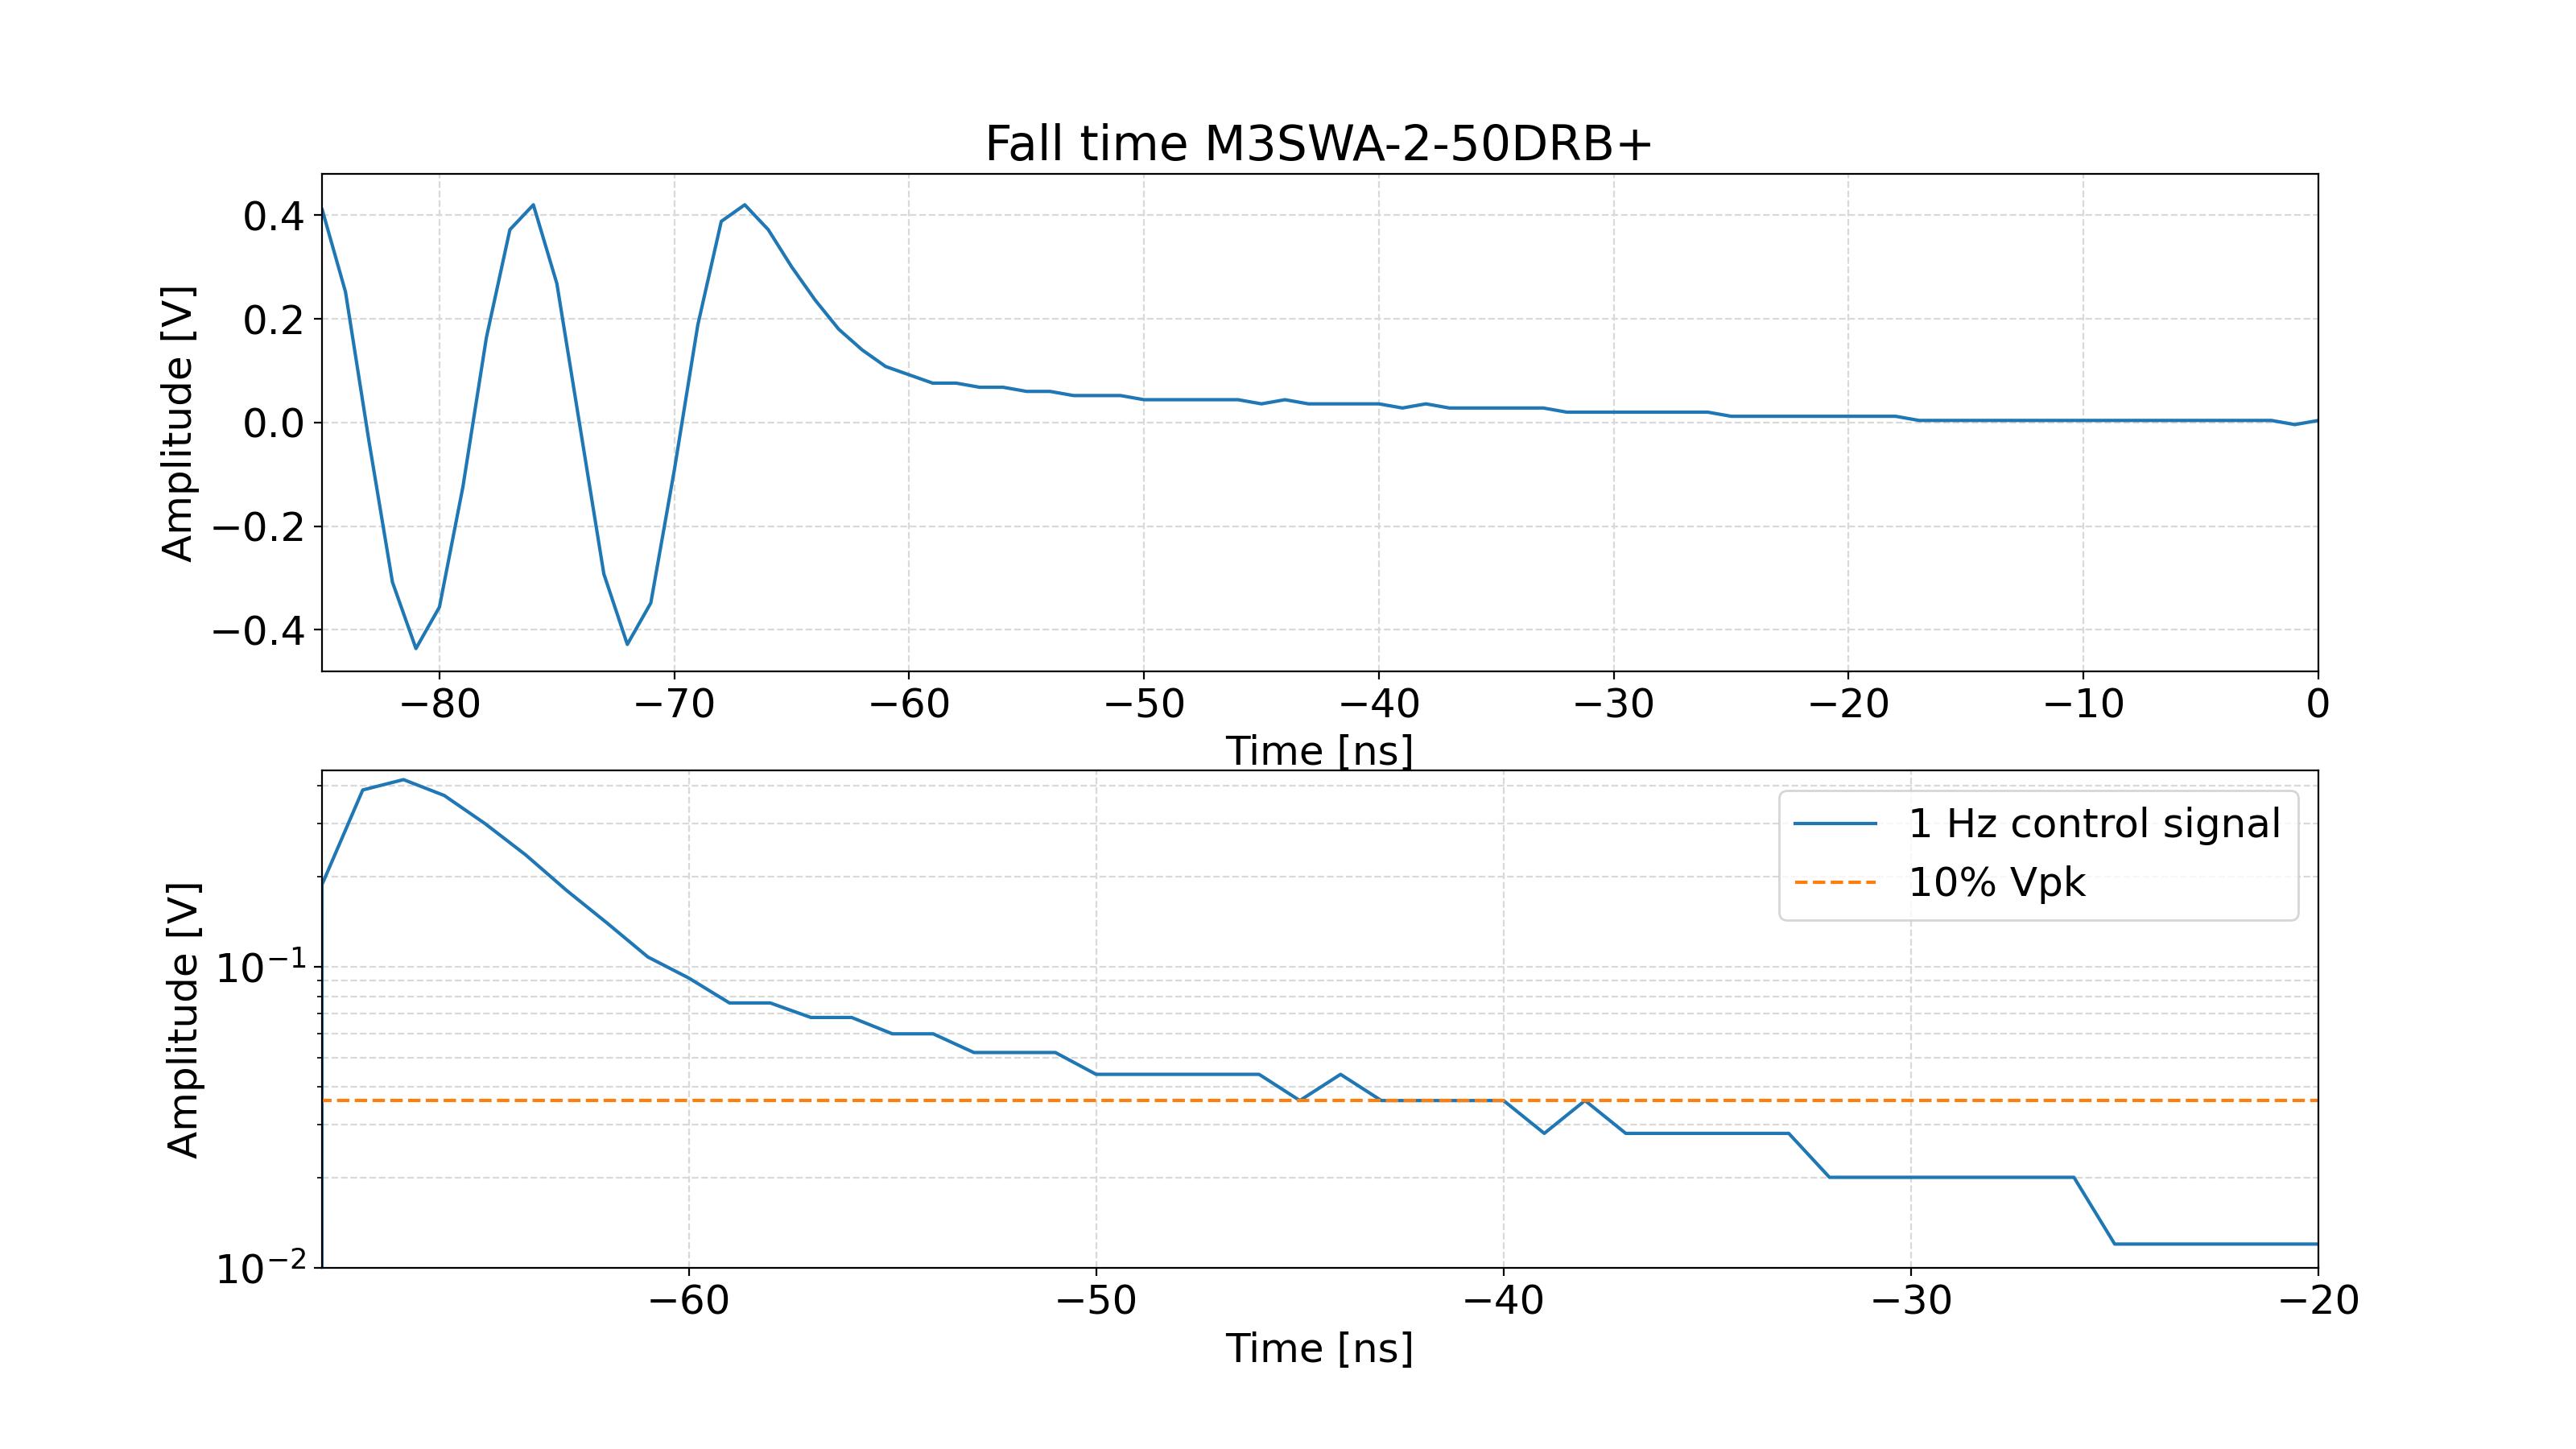
We received the Minicircuits M3SWA-2-50DRB+ absorptive RF switch evaluation board. Nominally, it has a fall time of 4.6 ns, well within bounds of what we want (400 ns). In this case, the rise and fall times have been specified by the manufacturer as the time it takes to go from 10% to 90% of the peak voltage and vice versa. The circuit can accept high input power > 24 dBm at 100 MHz. It is powered by -5/+5 V supply. The switch is activated/deactiveated by a TTL (transistor-transistor logic) control signal. In short, voltages in a certain low threshold (0-0.8 V) are considered "OFF" and in a certain high threshold (2.1-5 V) are considered "ON". In this case, we can just use a square wave oscillating between 0 and 5 V, and then trigger the oscilloscope to follow the rise/fall of the RF signal.
Chip manual: https://www.minicircuits.com/pdfs/M3SWA-2-50DRB+.pdf
Evaluation board diagram: https://www.minicircuits.com/pcb/WTB-M3SWA250DRB+_P02.pdf
-- Test --
The RF switch was tested in the filter cavity clean room using the already present oscilloscope, function generator and RF amplifier(s). We brought a DC power supply to send -5V/+5V to power the RF switch, as well as a Tektronix AFG320 function generator to provide the control signal to the RF switch (0 to 5V square wave, checked at 1 Hz and 12 kHz). Both of these were tested first to make sure they give the required voltage and square wave signal.
A 500 MHz RF signal was sent from the filter cavity function generator to the switch -> RF amplifier -> oscilloscope. A 20 dB attenuator with 50 Ohm impedance was connected to the oscilloscope to prevent back reflection. Unfortunately, the first RF amplifier (Minicircuits ZHL2) we were using stopped outputting. We did take care to say the order in which you should make connections with the RF amplifier. I hope it is not permanently broken...
-- Data --
The figure shows the fall time when a 1 Hz square wave is sent to the TTL port of the switch (rise time figure pending). The data is a bit low resolution. The lower half of the figure shows a zoom in of the timescale and indicates 10% of Vpk. This measurement doesn't seem very accurate, but regardless, the fall time is well below the target of 400 ns.
With these results, we moved the RF switch and the necessary electronics to the ATC cleanroom.
Taking the first 30ns of measurement data, I did a FFT analysis of the data and got a power spectrum density (PSD). Then the time span is shifted by 1ns several times to get the PSD evolution. In total, the 200ns data is shifted by 170 times to get the signal PSD change as a function of time. This is shown in attached figure one.
The FFT has a bandwidth of 33MHz (since I used 30ns to make a FFT). Because the RF signal has a frequency of 110MHz, I took the frequency span of 99-132MHz to check the amplitude of RF switch output.
From this analysis, the fall time, which is the time that signal drops from 90% to 10%, is 10.6ns.
In addition, I also put a time-frequency-amplitude plot of this signal.
This work is on 20220303.
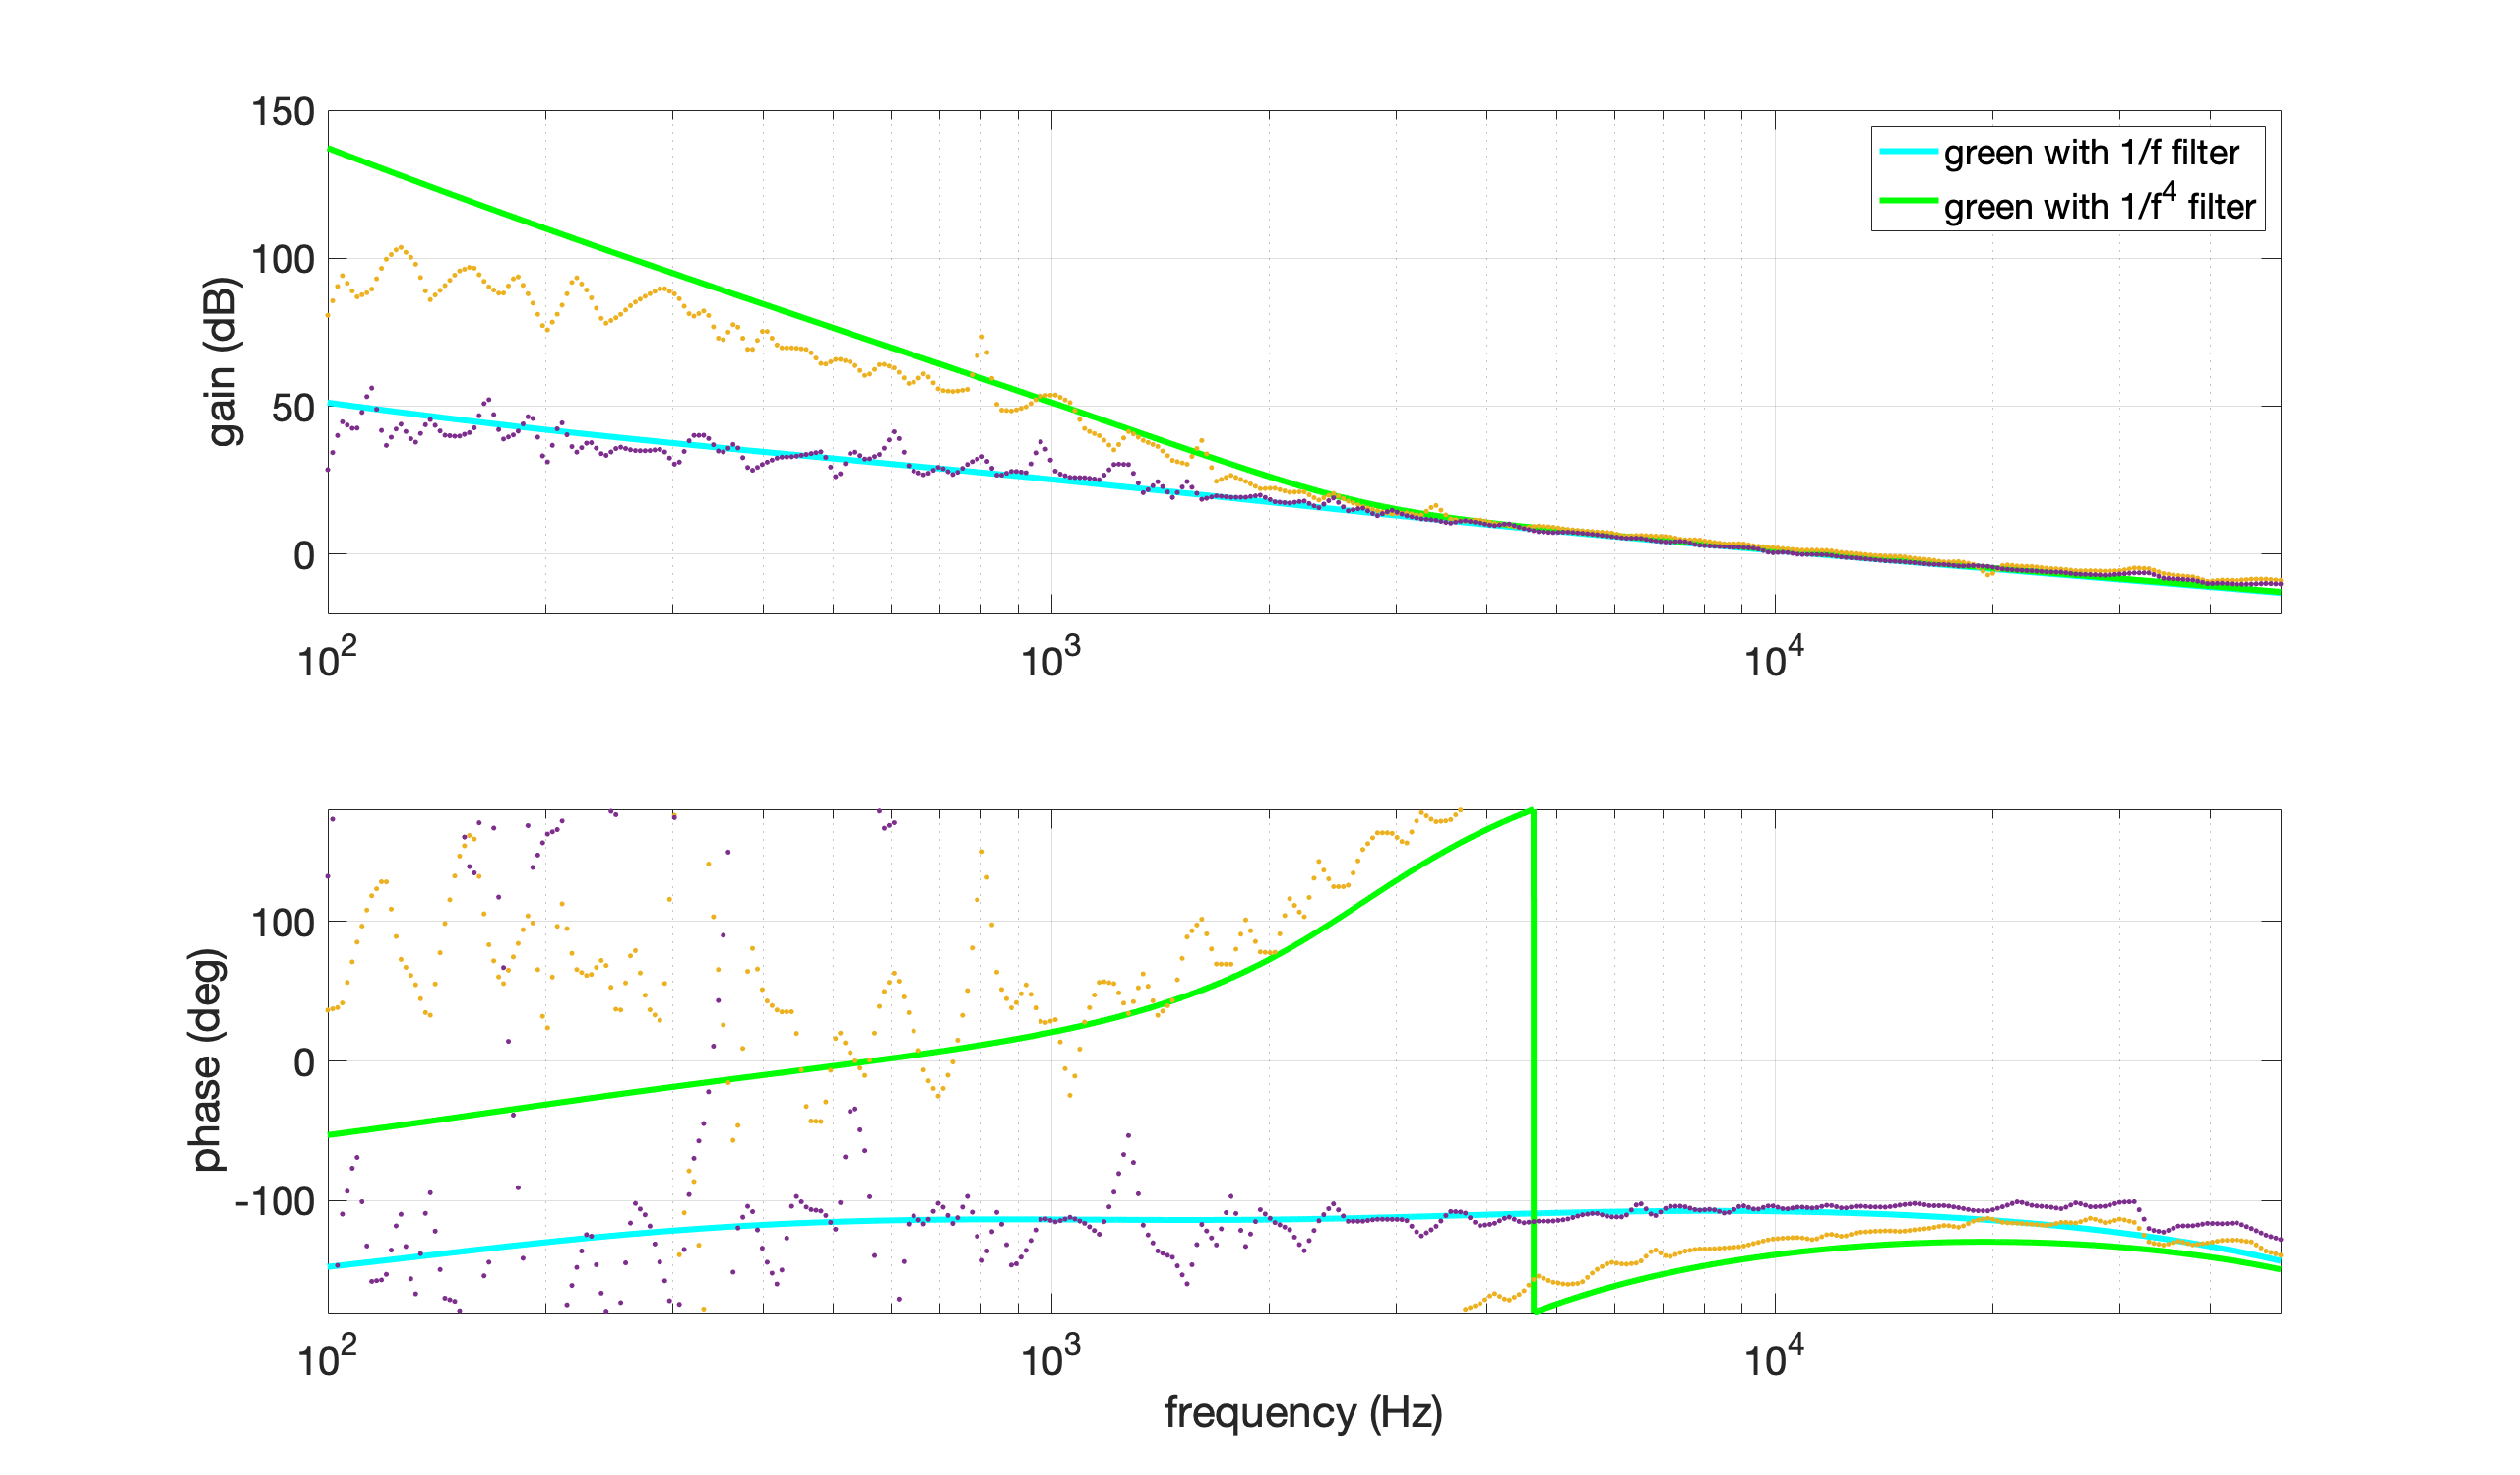
I measured CCFC error signal with green 1/f, 1/f^4 filters, and CCFC. The green transmission beam spot is upper side of camera (new beam spot). The green FC injection power was 23mW. The parameters for 1/f and 1/f^4 filters are as follows. Fig 1 shows the green OLTF.
| filter | input attenuator | piezo gain | UGF |
| 1/f | 0.8 | 8 | 11 kHz |
| 1/f^4 | 0.2 | 8 | 13 kHz |
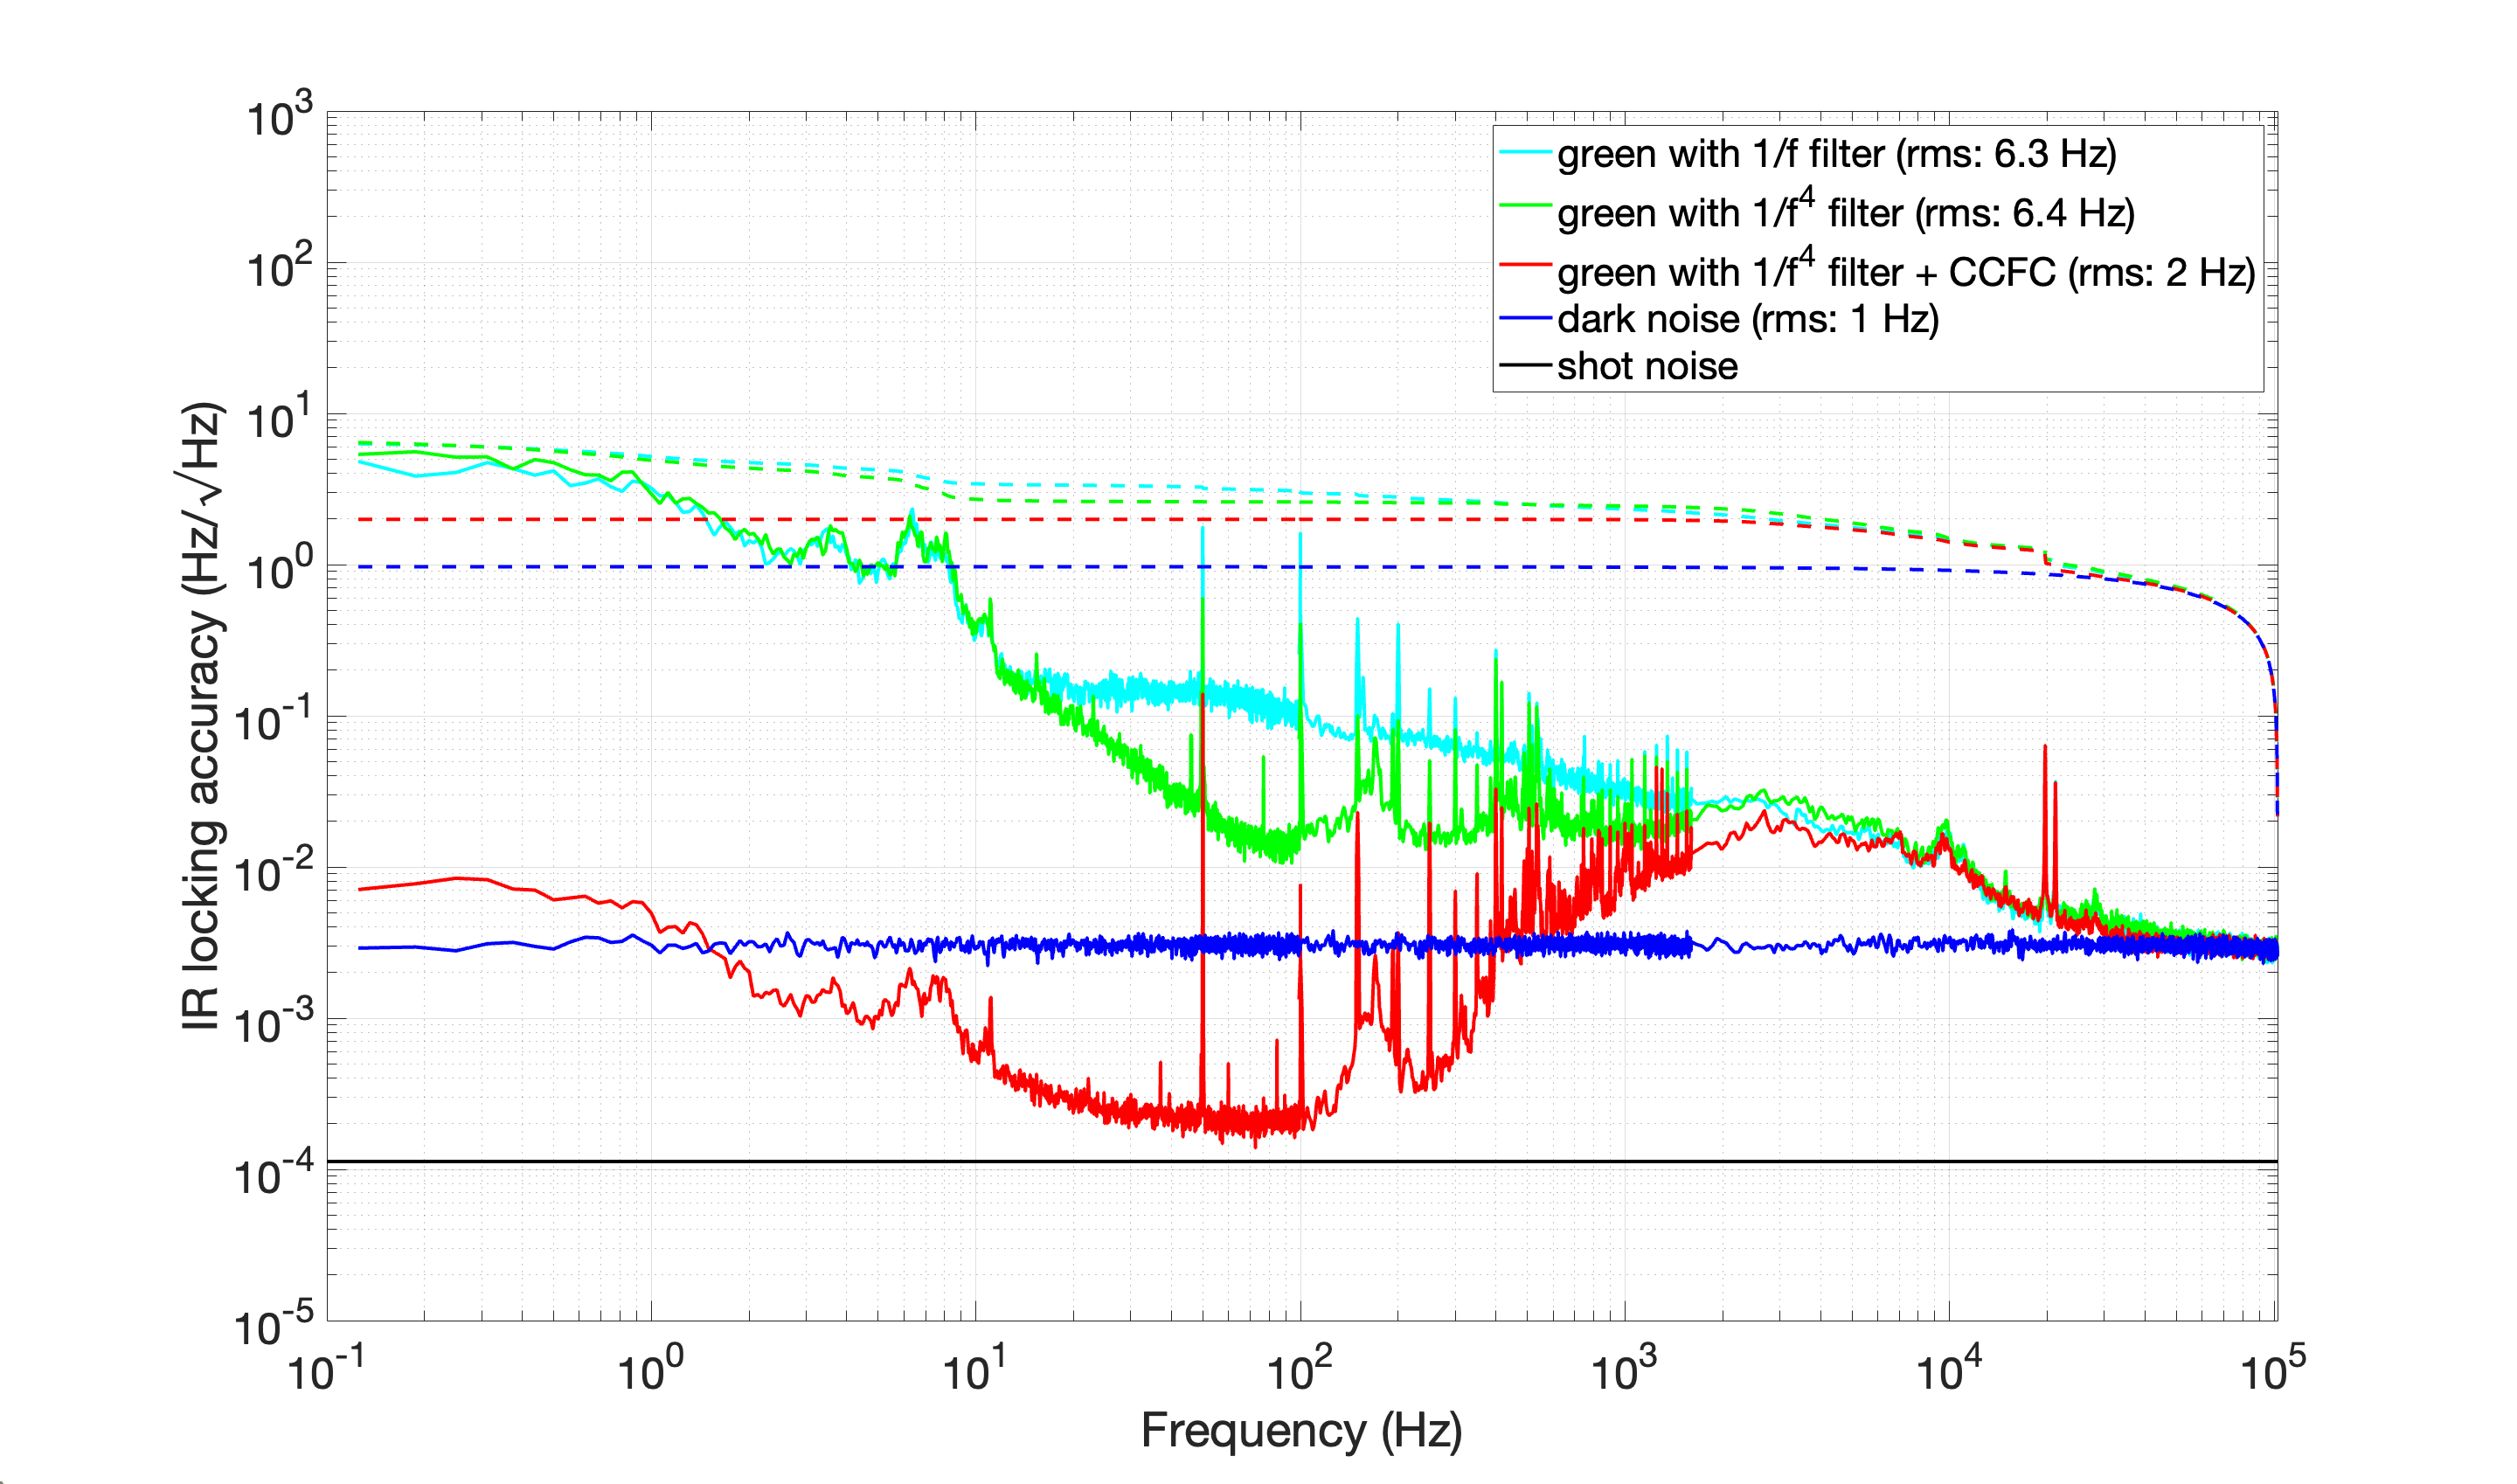
The measured CCFC error signal with green 1/f, 1/f^4 filters, and CCFC are shown in Fig. 2. The CCFC amplitude was 142mVpp. CCFC filter gain is 1000 with 30Hz LPF.
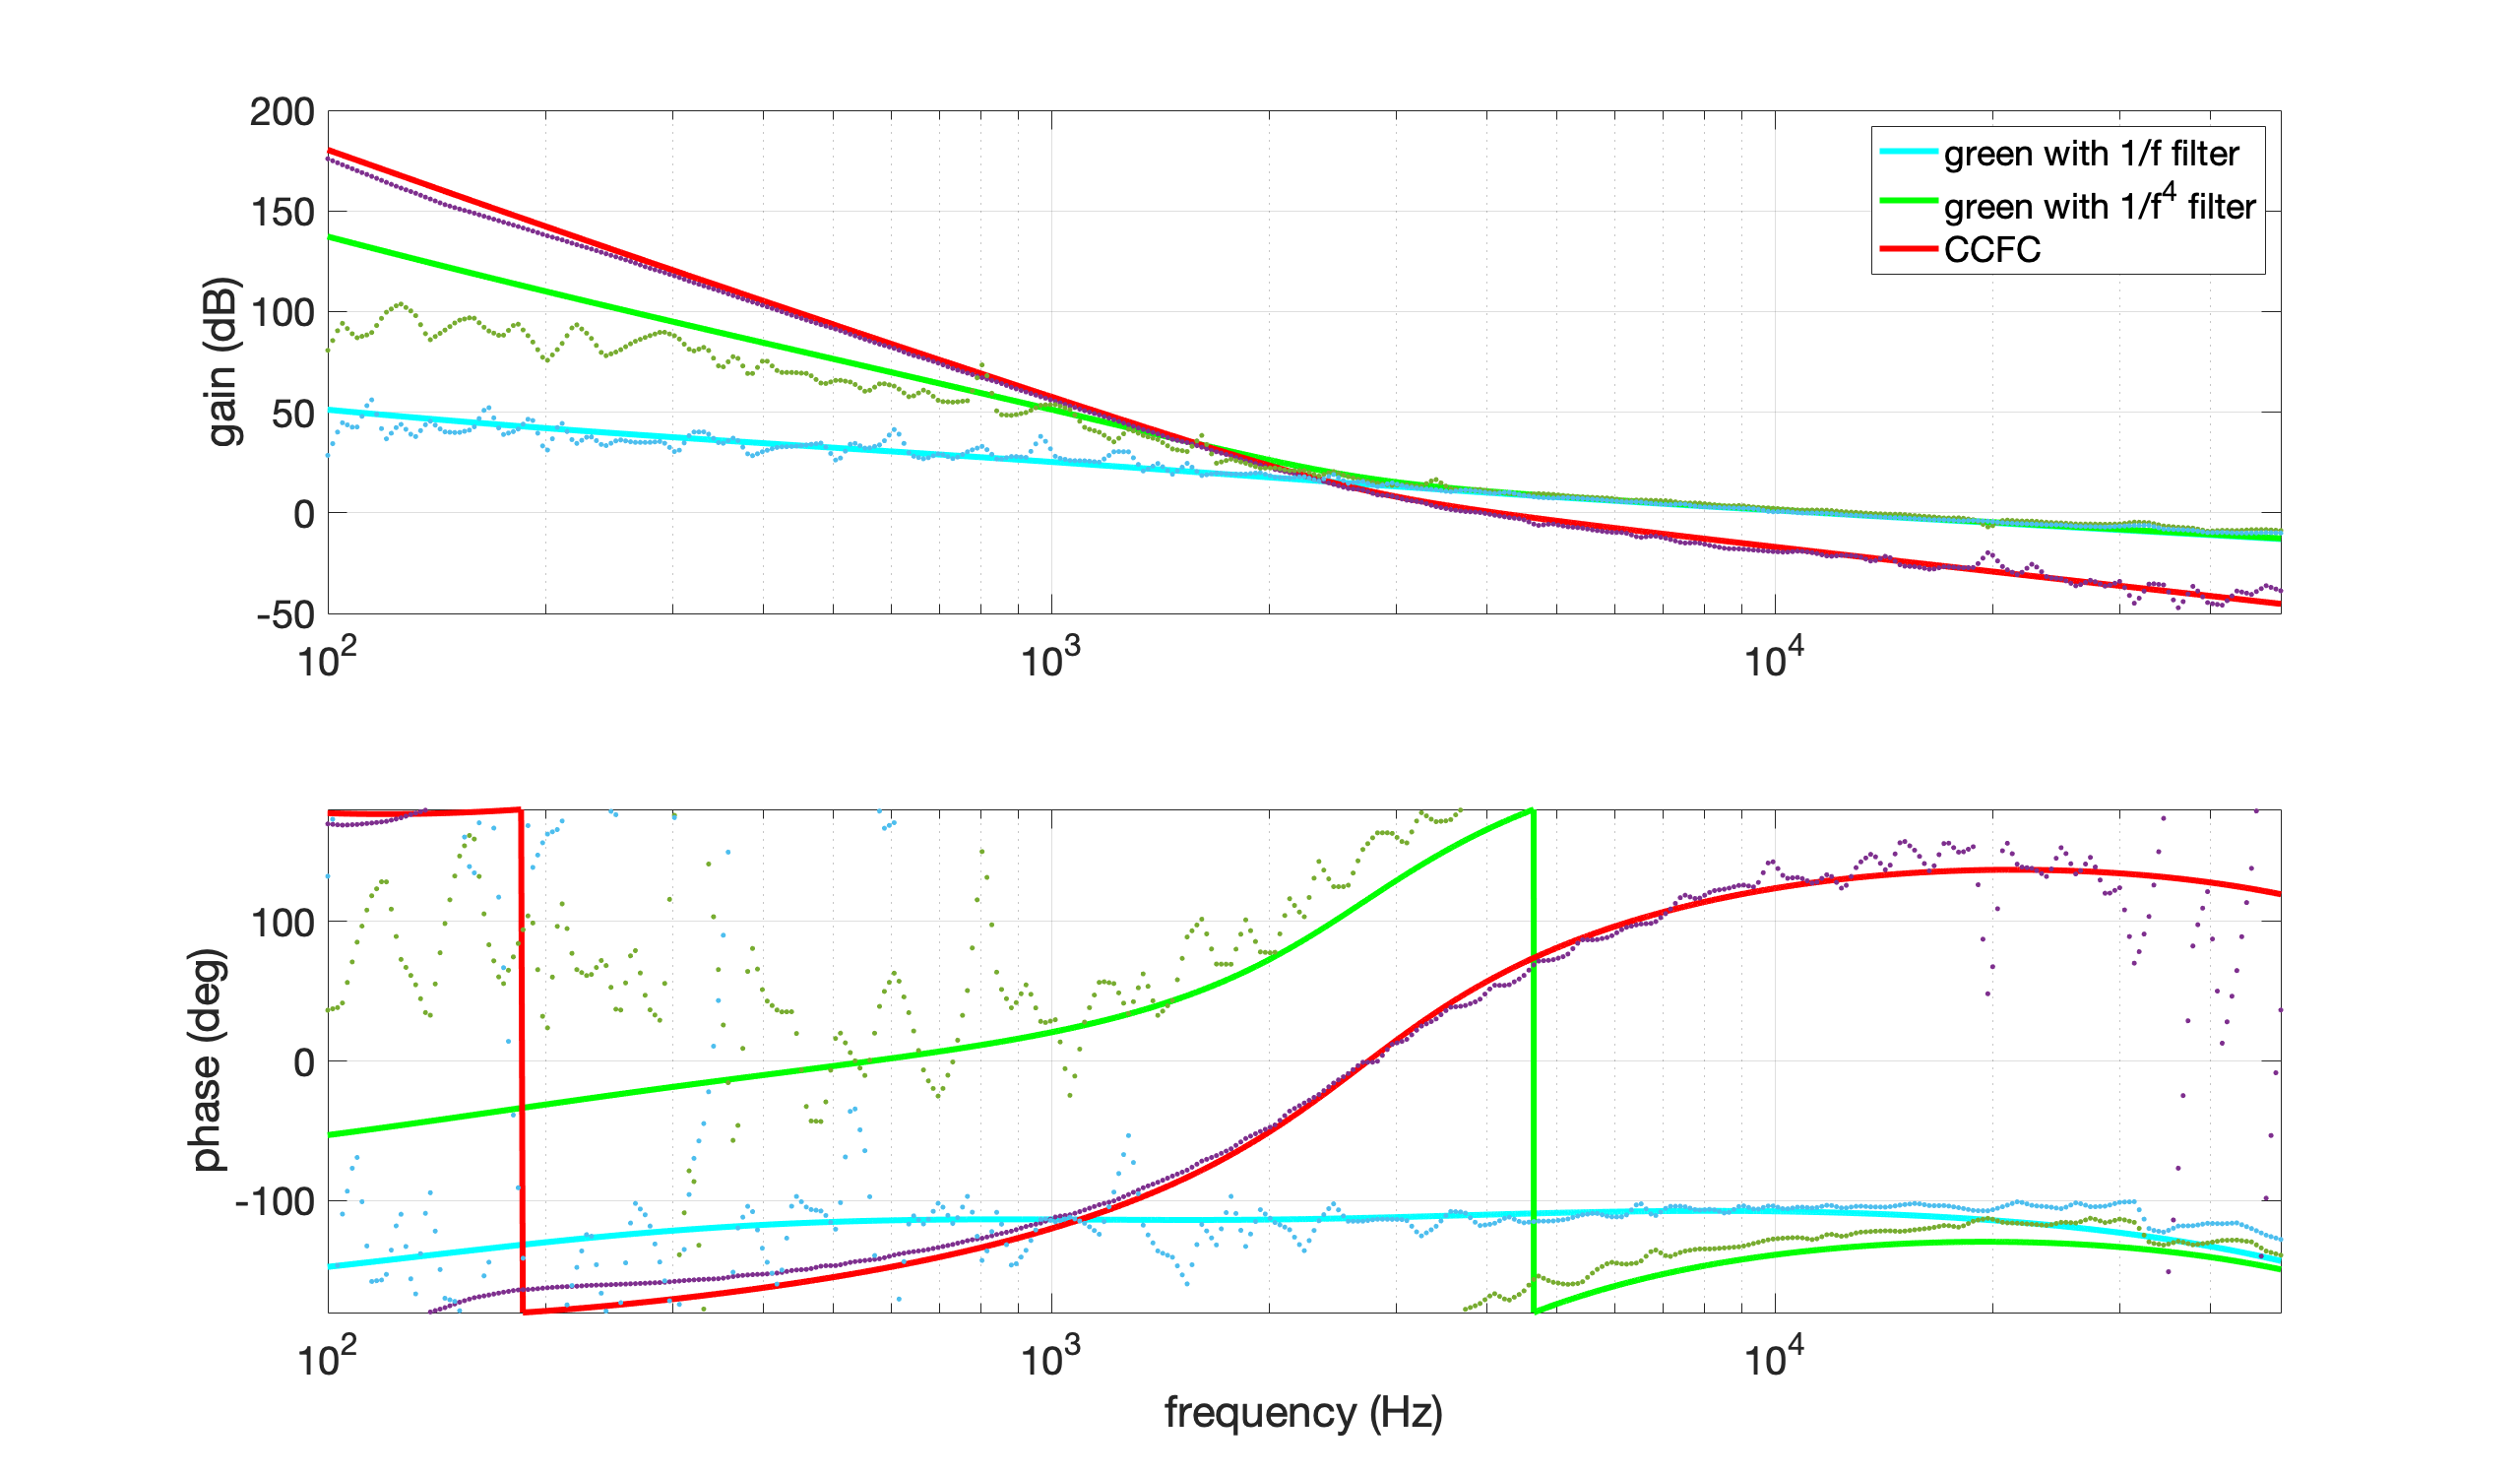
Measurement of CCFC OLTF
CCFC OLTF can be measured by injecting a signal to sum port of CCFC filter (SR560) and measuring CCFC filter input/output. The relation between this measurement and CCFC OLTF is as follows.
(CCFC filter input/output)*CCFC filter = - G_CCFC/(1+G_green)
G_CCFC = - (CCFC filter input/output)*CCFC filter*(1+G_green)
Since the CCFC filter and G_green are known, G_CCFC can be obtained. Fig. 3 shows green, CCFC OLTF. The crossover frequency between green/CCFC is 1.6kHz.
We tried to investigate possible explanations for this discrepancy.
First we performed along z scan to be sure that we are able to see the 2 surfaces of the samples.
We could find S1 at 34.8 mm and S2 at 122 mm along z.
We can see the ac/dc signal decreasing with an increase of z (same as Manuel's measurement) but the signal is roughly half of what he got.
We have the same chopper frequency, we're injecting pure s polarization, but differences are that he was injecting about 10 W vs our 8.5 W, he set the DC to about 2.5 V vs 4V now and in his computation he is using 1.16 /cm instead of the 1.04 /cm later measured and I'm not sure how the transmission was taken into account.
For reference Manuel's measurements and analysis are in the KAGRA#7 folder.
One strong possibility is that we have a too large pump beam size. Indeed Manuel found out that it could cause some factor discrepancy when he upgraded the setup.
We characterized the beam size with the razor blade as reported in figure 1. The beam waist is 48.5 um instead of the expected 35 um.
Following Jammt simulation that indicates that the beam waist of 35 um by moving the last lens by ~5mm we started to realign but without clear improvement so we'll continue on Monday.
I tried to check the PBS transmission.
Without PBS, Intensity is 25.7 mW.
Minimum transmission is 114 uW.
QWP angle is 220 deg, HWP angle is 96 deg.
Maximum transmission is 24.0 mW.
QWP angle is 220 deg, HWP angle is 50 deg.
Aso and Nishino did fit-check on Febrary 22nd.
There were 2 issues in the optical components
- the sizes of the screw head for OBS1 were too large and they touched both sides of the OBS1 mirror.
- the new mirror mount for OBS4 doesn't have a reference mark to set on the mirror
for the issue 1, Fukushima-san fixed it and Nishino did fit-check on March 4th.
Issue 2 is left on the date of this report.
I measured the beam profiles again on March 3rd. I took 10 samples for each point and used an average of them.
| width | weist position* | |
| x | 0.1347+- 0.0006 mm | -35.6 +-0.5mm |
| y | 0.139+-0.004 mm | 11.8+-2.3mm |
* start position is two holes (~50 mm) distant from the center of the BS.
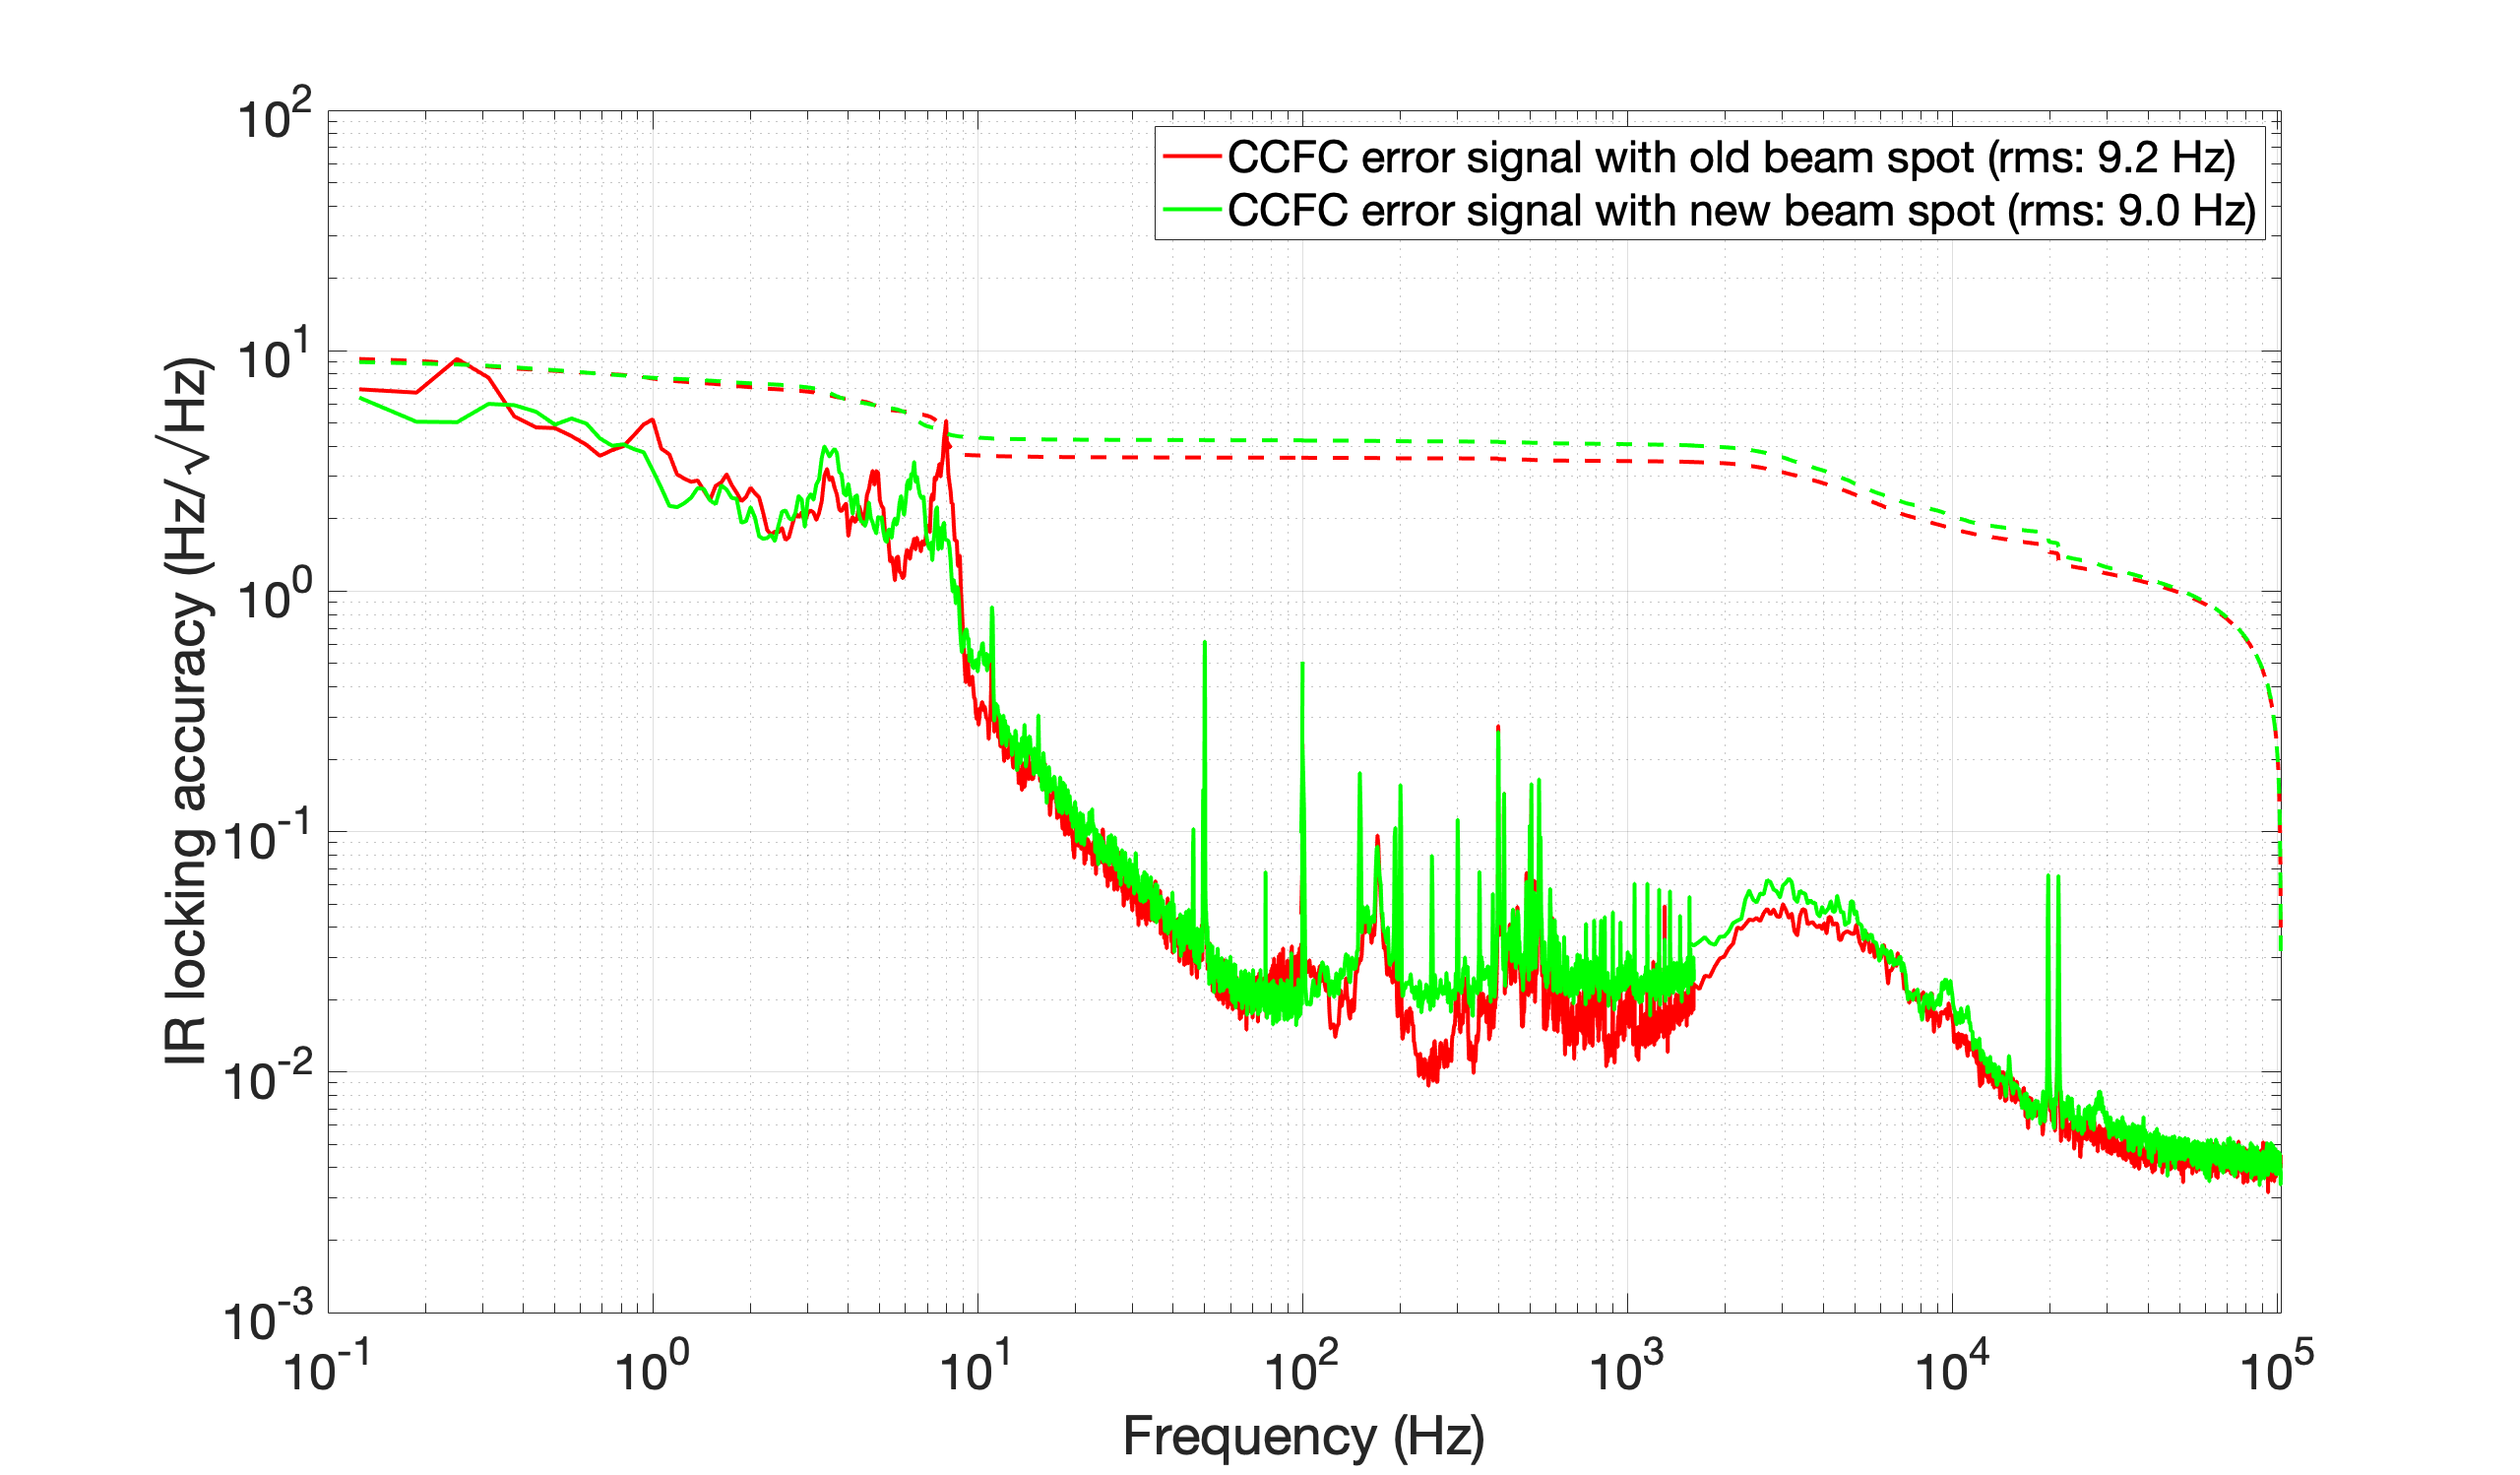
I compared CCFC error signal with old/new green beam spot. The new green beam spot is upper side of camera as shown in elog2613. The old green beam spot is center of camera.
The offset of BS pointing for old/new beam spot is as follows.
| old | new | |
| pitch | 26 | 6 |
| yaw | 14 | 14 |
The attached figure shows CCFC error signal. The CCFC amplitude was 118mVpp. The new beam spot is better than old beam spot below 10Hz.
As reported in elog2850, FC is sometimes very stable, but not very stable most of the time. I noticed that the BS coil output was too large (~20000). After BS offload with picomotor, FC got more stable. Maybe BS was touching somewhere and that could cause the unlock. However, FC still sometimes unlocks. It might be better to open PR chamber and check PR suspension.
Katsuki, Marc
We found the GPS receiver on the left of the network rack in the storage room (see attached pictures).
We tried to follow the black cable that seems to indeed go to the roof of the central building.
While LIGO recommends to have the cable between the GPS antenna and receiver as short as possible, our cable is really long so we should be able to have our GPS receiver on the rack close to the input mirror.
The GPS receiver user guide is accesible here : www.leapsecond.com/museum/hp59551a/097-59551-02-iss-1.pdf
The allocation of the computers is the following:
CSP-38XQDR4: FE computer for Center Area
CSP-30EGSR4: FE computer for End Stations
CSP-32XES: DAQ computer (to run DataConcentrator, FrameBuilder and NDS servers. Also, the IRIG-B card should be installed into this computer.)
813M-3, SN BT0-2947105-001: Probably a server for GigE camera